BCHUSDT → Consolidation ahead of news. Target 600?BINANCE:BCHUSDT.P is consolidating above key resistance. Consolidation is forming ahead of news. Are the bulls in play?
Bitcoin is consolidating, trading above key support at 111650. News ahead, a positive outcome could support the market, including altcoins...
As for BCHUSDT, the coin is breaking through the strong resistance zone of 549.15 as part of a bullish trend and is forming consolidation in the range of 549-570. A liquidity pool has formed below 549. There is a high probability of a long squeeze before growth.
Resistance levels: 570, 600, 612
Support levels: 549.15, 533, 511.25
The market is bullish, which is clearly visible on the D1 timeframe. After a strong rally, the coin is entering a consolidation phase, which is forming above the previously broken resistance. A retest of support could trigger growth in the direction of the trend.
Best regards, R. Linda!
Triangle

Breakout in VAIBHAV GLOBALBreakout in VAIBHAV GLOBAL.
Entry - 239
Target - 265
SL - 228
DISCLAIMER: I am not SEBI registered and the ideas posted are only for educational purpose. Do a proper analysis and always trade with STOP LOSS.

KIO - 7 months ASCENDING TRIANGLE══════════════════════════════
Since 2014, my markets approach is to spot
trading opportunities based solely on the
development of
CLASSICAL CHART PATTERNS
🤝Let’s learn and grow together 🤝
══════════════════════════════
Hello Traders ✌
After a careful consideration I came to the conclusion that:
- it is crucial to be quick in alerting you with all the opportunities I spot and often I don't post a good pattern because I don't have the opportunity to write down a proper didactical comment;
- since my parameters to identify a Classical Pattern and its scenario are very well defined, many of my comments were and would be redundant;
- the information that I think is important is very simple and can easily be understood just by looking at charts;
For these reasons and hoping to give you a better help, I decided to write comments only when something very specific or interesting shows up, otherwise all the information is shown on the chart.
Thank you all for your support
🔎🔎🔎 ALWAYS REMEMBER
"A pattern IS NOT a Pattern until the breakout is completed. Before that moment it is just a bunch of colorful candlesticks on a chart of your watchlist"
═════════════════════════════
⚠ DISCLAIMER ⚠
The content is The Art Of Charting's personal opinion and it is posted purely for educational purpose and therefore it must not be taken as a direct or indirect investing recommendations or advices. Any action taken upon these information is at your own risk.

XAU/USD – Triangle Breakdown Potential Toward 3,900 ZoneGold (XAU/USD) has been in a strong uptrend for the past few months, recently reaching new highs above US $4,300 before showing signs of slowing down. In your chart, the price has formed a triangle pattern (labelled A–B–C–D) after a sharp drop from the peak. This pattern usually means the market is taking a pause and preparing for the next move — either a breakout up or down. Based on the structure, momentum, and recent price behavior, the pattern looks more likely to break downward, which could send the price toward the support zone around US $3,900–3,950 (the blue area on your chart).
From a technical view, this makes sense because:
The strong rally lost strength after the sharp fall from the top.
The triangle is getting tighter, meaning volatility is compressing before a breakout.
Indicators like the RSI and Awesome Oscillator (AO) are showing bearish divergence, signaling weaker buying pressure.
If price breaks below US $4,100–4,050, it would confirm a bearish breakout and likely trigger a move to the support area marked in blue.
From a fundamental view, gold recently rallied due to expectations of Federal Reserve rate cuts, high inflation, and strong central bank demand. But in late October 2025, the market is cooling because the U.S. dollar has strengthened slightly and Treasury yields have bounced, causing short-term selling pressure on gold. Many traders are also taking profits after such a strong run.
Putting both sides together, the technical chart and the current fundamentals support a short-term bearish correction — a pullback that could test the US $3,900 zone before the next big move. However, if the price fails to break below the triangle and instead closes above US $4,180–4,250, it would cancel the bearish setup and signal a possible continuation of the uptrend toward new highs above US $4,350–4,400.
In short:
Bias: Short-term bearish correction
Breakdown trigger: Below US $4,050–4,100
Target zone: Around US $3,900
Invalidation: Above US $4,250

EURUSD: Buyers Gaining Momentum Near Key Support ZoneHello everyone, here is my breakdown of the current Euro setup.
Market Analysis
EURUSD has been moving within a clear downward channel, forming consistent lower highs and lower lows over the past few weeks. Each attempt to break above the resistance line has resulted in a fake breakout, confirming that sellers have maintained control through most of this structure.
Recently, the pair found strong buyer support near 1.1550, a key support zone that has held multiple times in the past. After testing this level, the price bounced upward, breaking the channel’s upper boundary and forming a triangle structure — signaling that market momentum is shifting from bearish to corrective. Currently, EURUSD is testing the Triangle Resistance Line around 1.1670–1.1700, an important resistance area where previous rallies have stalled. The overall structure suggests that the market might face renewed selling pressure from this zone.
My Scenario & Strategy
From my perspective, EURUSD could see a short-term pullback from the resistance area before any potential breakout confirmation. A rejection here would likely push price back toward the Triangle Support Line or even the 1.1580–1.1550 support zone, where buyers could reenter.If, however, the pair manages to break and hold above 1.1700, it would indicate growing bullish momentum, possibly targeting 1.1750 — the top of the previous resistance area.
Until such confirmation appears, I expect a corrective move downward within the triangle formation as part of a broader consolidation phase.
That's the setup I'm tracking. Thank you for your attention, and always manage your risk.

GOLD → The market is testing 4K ahead of the Fed's decision FX:XAUUSD is testing $4,000 ahead of the Fed's decision, partially recovering from a 3.5% drop this week. The fundamental backdrop is mixed, but technically, the signs of a bull market are positive.
Key factors : Fed decision (today): A 25 bps rate cut is expected, but the main focus is on the vote count and Powell's comments.
A dovish scenario (emphasis on risks to the labor market) will support gold. A hawkish surprise will reinforce the correction. Trump-Xi meeting (tomorrow): Statements about lowering tariffs weaken demand for defensive assets.
Gold is in limbo; in the second half of the European session and the beginning of the US session, the market may enter a phase of stagnation. Growth is only likely if the Fed takes a soft tone, while progress in trade negotiations or a hawkish surprise from the Fed will prolong the correction.
Resistance levels: 4015, 4050, 4085
Support levels: 3975, 3945, 3900
If the bulls can hold their ground above 4K, we will see strong support, in which case growth to 4050-4100 may be triggered. Otherwise, the market may form a correction to 3975-3945. It is worth keeping an eye on comments from Powell and Trump... Volatility will be high...
Best regards, R. Linda!

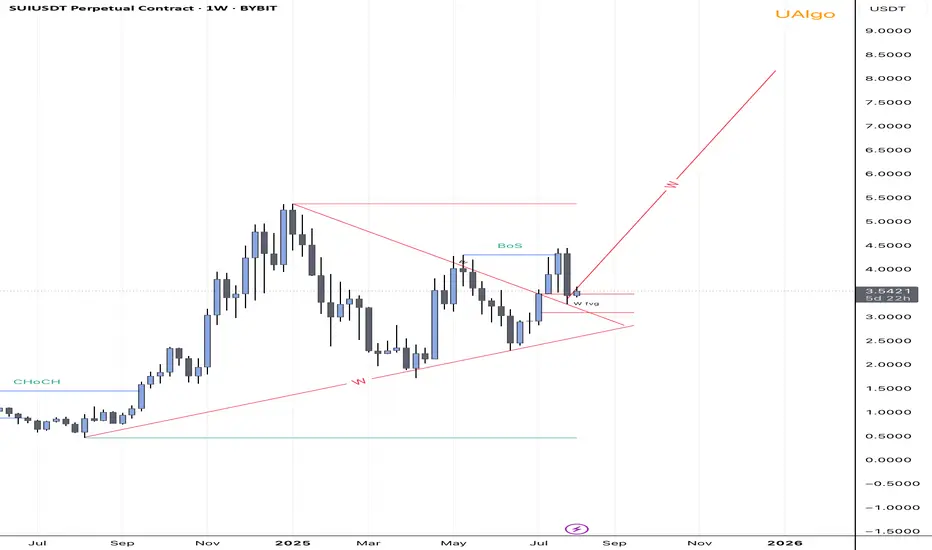
SUI Bullish Breakout Confirmed- $8 Target In sight! Hey everyone,
Today marks an important moment for SUI. We’ve just witnessed a clean breakout from a long-term symmetrical triangle on the weekly timeframe, supported by a confirmed Break of Structure (BoS) and a weekly Fair Value Gap (FVG) acting as strong support.
Price respected the FVG zone and bounced, showing clear bullish intent. With strong structure forming and momentum building, I’m targeting the $8 region as the next major level of interest. Market structure is bullish, and the confluence of trendline support, FVG, and the breakout gives me confidence in this move.
Key Highlights:
• Weekly CHoCH followed by BoS 🚀
• Price broke out of triangle and retested FVG🚀
• Bullish continuation structure (W formation)🚀
• Targeting $5.5 → $8 range if momentum holds🚀
DOLLAR INDEX (DXY): Consolidation Ahead of FOMC
Dollar Index weakens ahead of FED rate decision today.
The market formed a symmetrical triangle pattern on a daily.
A breakout of one of its boundaries after an interest rate decision
announcement will accurately indicate a future direction of the market.
❤️Please, support my work with like, thank you!❤️
I am part of Trade Nation's Influencer program and receive a monthly fee for using their TradingView charts in my analysis.

GOLD → Sell-off due to uncertainty FX:XAUUSD is falling, the trend is downward, and we have confirmation of this. Profit-taking is leading to a decline, which is causing buyers to exit the market...
Caution ahead of the Fed: Markets are pricing in a 25 bp rate cut, but the main thing is the tone of the statement and Powell's comments on further steps. The USD is not ready to continue its growth and is starting to look downwards. The US government shutdown continues, adding uncertainty, which supports gold.
However, an important issue is the trade deal between the US and China; a positive outcome could put pressure on gold.
Gold is balancing between hopes for a trade truce and risks from Fed policy.
Support levels: 3895, 3820
Resistance levels: 3943, 3975, 4015
Since the opening of the session, the price has fallen by 2.3%, which is an intraday range. The 3900-3895 area may see a reaction in the form of a false breakdown and a correction to the imbalance zone before a possible further decline.
Best regards, R. Linda!

AUDUSD → Attempt to reverse the trend to bullish FX:AUDUSD is forming a correction after breaking through the resistance of the downward channel. The market needs a trading range or consolidation above 0.6526.
The dollar is consolidating but is not ready to continue growing. Pressure on the currency is emerging ahead of the Fed meeting. This may support the growth of the Australian dollar.
The currency pair is entering a distribution phase after consolidation. The breakout of 0.6526 triggered a break of the downward channel resistance. An attempt to change the trend is forming. If the bulls keep the price above 0.6526, this could trigger further growth.
Resistance levels: 0.6567, 0.661
Support levels: 0.6526, 0.6493
At the moment, an attempt to change the trend has been initiated. Consolidation and distribution are a good sign, but above the previously broken trend line, a trading range should form, which will confirm the fact of a change in the local trend.
Best regards, R. Linda!

GRAPHITE INDIAGraphite India Ltd. (currently trading near ₹590.30) – Overview Headquartered in Kolkata, Graphite India Ltd. is one of India’s largest producers of graphite electrodes, catering primarily to electric arc furnace (EAF) steel producers. The company also manufactures calcined petroleum coke, impervious graphite equipment, and glass-reinforced plastic pipes. It operates manufacturing facilities in India and Germany, with exports contributing significantly to revenue.
FY22–FY25 Snapshot
• Sales – ₹2,950 Cr → ₹3,220 Cr → ₹3,480 Cr → ₹3,750 Cr Growth driven by global steel demand, electrode exports, and specialty carbon products
• Net Profit – ₹410 Cr → ₹520 Cr → ₹610 Cr → ₹700 Cr Earnings supported by pricing recovery, cost optimization, and improved utilization
• Operating Performance – Moderate → Strong → Strong → Strong EBITDA margins improving with better realizations and raw material cost control
• Dividend Yield (%) – 1.20% → 1.30% → 1.40% → 1.50% Consistent payouts; balance maintained between shareholder returns and reinvestment
• Equity Capital – ₹195.66 Cr (constant) No dilution; strong balance sheet with high reserves
• Total Debt – ₹120 Cr → ₹100 Cr → ₹80 Cr → ₹60 Cr Gradual deleveraging supported by internal accruals and export cash flows
• Fixed Assets – ₹1,650 Cr → ₹1,700 Cr → ₹1,750 Cr → ₹1,800 Cr Capex focused on electrode capacity, specialty carbon, and environmental upgrades
Institutional Interest & Ownership Trends Promoter holding stands at ~65.2%, with no pledging. FIIs and DIIs have selectively accumulated Graphite India citing its global exposure, margin recovery, and carbon transition relevance. Delivery volumes reflect long-term positioning by steel, infrastructure, and ESG-focused funds.
Business Growth Verdict Graphite India is scaling across electrodes, specialty carbon, and industrial equipment Margins improving via pricing recovery, cost control, and export leverage Debt is declining steadily with strong operating cash flows Capex supports long-term competitiveness and environmental compliance
Management Highlights • FY25 electrode volumes up 12% YoY; specialty carbon gaining traction • German subsidiary performance improved; new export contracts secured • R&D spend at ₹85 Cr; 5 new SKUs launched in industrial carbon and GRP pipes • FY26 Outlook: 8–10% revenue growth, margin retention, PAT expected to cross ₹800 Cr
Final Investment Verdict Graphite India Ltd. offers a global industrial play built on graphite electrodes and specialty carbon solutions. Its improving profitability, disciplined capital structure, and export-led growth make it suitable for accumulation by investors seeking exposure to steel-linked consumables and carbon transition themes. With strong execution, global reach, and margin recovery, Graphite India remains a durable value creator in the mid-cap industrial space.

NIFTY | Twin Bullish Patterns Signaling Market ConfidenceNIFTY | Dual Bullish Pattern on 15-Minute Timeframe
This is the 15-minute timeframe chart of NIFTY.
NIFTY is currently forming two bullish patterns — a triangle pattern and a falling flag pattern.
If the triangle pattern support breaks, the next strong support lies near the ₹25,550–₹25,600 zone, aligned with the lower boundary of the falling flag.
As long as this support zone holds, NIFTY is likely to resume its upward momentum, potentially heading toward a new high in the ₹26,250–₹26,300 range.
Thank You !!

AEROFLEX | Bulls Taking Charge from SupportAEROFLEX INDUSTRIES | Power Reversal from Support Zone
This is the weekly and daily timeframe chart of Aeroflex Industries.
The stock is holding a strong long-term support zone near the ₹160–₹170 range.
It has formed a symmetrical triangle pattern around the support area, with pattern resistance near ₹210.
On the daily timeframe, the stock is also trading within a broadening wedge pattern, showing support around ₹170 and resistance near ₹210.
If the support zone sustains, we may witness higher price action in the coming sessions, potentially leading towards the pattern breakout target.
Thank you.

Possibility of breakout in SWANCORPPossibility of breakout in SWANCORP.
Entry - 476
Target - 526
SL - 459
DISCLAIMER: I am not SEBI registered and the ideas posted are only for educational purpose. Do a proper analysis and always trade with STOP LOSS.

XAUUSD: Bullish Reversal Setup From Triangle SupportHello everyone, here is my breakdown of the current Gold setup.
Market Analysis
Gold (XAUUSD) continues to trade within a larger bullish market structure, maintaining higher lows above its key ascending Trend Line. After a strong impulsive rally that pushed the price above the 4,200 resistance, the market faced rejection near the top of the Range and entered a corrective phase. This correction evolved into a triangle pattern, with price now testing the Triangle Support Line, aligning closely with the horizontal Support area around 4,020 – 4,000 — a historically important demand zone.
Currently, the price is consolidating near the lower boundary of this structure, showing early signs of stabilization. This region also coincides with the previous breakout point, adding further confluence for potential buyer interest.
My Scenario & Strategy
I expect the price to hold above the Triangle Support Line and form a bullish reversal structure, signaling that buyers are once again defending this level. A confirmed breakout above the Triangle Resistance Line would indicate renewed bullish momentum and a potential continuation of the overall uptrend.
My primary target zone lies around 4,215, where previous resistance and the upper range boundary converge. However, if the support near 4,000 fails to hold, it could trigger a deeper correction toward 3,950, where the next demand zone is located. This setup offers a favorable risk-to-reward opportunity for traders anticipating a rebound from a major technical confluence zone.
That's the setup I'm tracking. Thank you for your attention, and always manage your risk.

ETHEREUM BULL-RUNI believe Ethereum is doing what bitcoin did in 2020-21 and 300% rise to about 14k in 2 months is pretty normal in cryptos

USD/CNH Break Lower Could Target 7.0000Is a possible reset in relations between the world’s two most powerful nations about to see the Chinese yuan strengthen sharply? USD/CNH is coiling in a descending triangle formation, and the risk of a break lower is arguably increasing—even if the reset proves short-lived.
After breaking beneath the 50-day moving average on August 28, USD/CNH tried twice to reclaim the level earlier this month but failed to sustain the move. The pair has since resumed its push lower, leaving it teetering on support at 7.1000 today. The last time USD/CNH attempted to break beneath this level, it triggered a sharp reversal, printing a hammer candle on the daily chart that marked the start of a squeeze higher.
While that move failed, this one may have more success, arriving just before a likely trade deal between the U.S. and China on the sidelines of the APEC summit in South Korea later this week. There’s always the risk the framework could unravel quickly, but the backdrop screens as supportive for the yuan: the Fed is widely expected to cut rates again while retaining a dovish bias, and risk appetite is strong across Asia.
Given the triangle pattern, a close beneath 7.1000 may spark a fresh wave of selling, putting the pair on track for a possible move toward the psychologically important 7.0000 level, based on the height of the triangle.
Shorts could be considered below 7.1000 with a stop above, targeting the September 17 low of 7.0850 initially. Beneath that, price action at 7.0600 and 7.0400 may provide clues as to whether the ultimate target of 7.0000 is likely to be reached.
Momentum indicators are generating strengthening bearish signals. RSI (14) is trending lower below 50 but is not yet oversold. MACD has confirmed by staging a bearish crossover of the signal line in negative territory, indicating downside pressure is building.
Good luck!
DS

ENSO / USDT approaching key breakout zone- Big move aheadCurrently watching ENSO for a potential breakout or breakdown from this symmetrical triangle formation.
Overall structure remains strong and bullish.
Bullish scenario: A breakout from the triangle could lead to a move towards $2.6 – $3.
Bearish scenario: A breakdown could trigger a correction towards $1.94 – $1.77.
Manage risk and wait for confirmation before entering any trade.

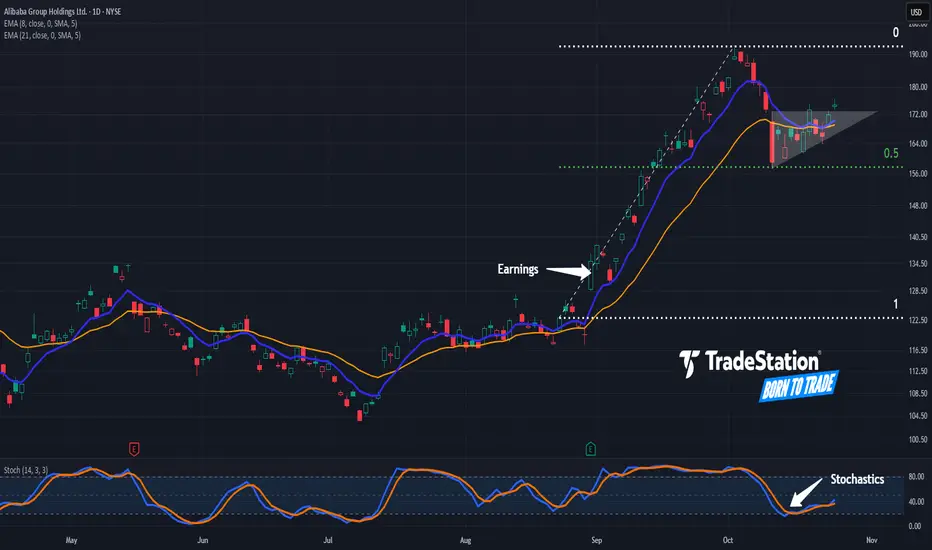
Potential Continuation Patterns in AlibabaAlibaba rallied in September. Now, after a pullback, some traders may see potential for continuation.
The first pattern on today’s chart is the advance between August 22 and October 2. The Chinese e-commerce giant stabilized after retracing half the move, which may suggest its direction remains upward.
Second, you have the series of higher lows since October 10 with prices mostly trapped below $173. That ascending triangle may be viewed as a bullish continuation pattern.
Third, the 8-day exponential moving average (EMA) has remained above the 21-day EMA.
Next, stochastics are rebounding from an oversold condition.
Finally, BABA is an active underlier in the options market. That could help traders take positions with calls and puts.
TradeStation has, for decades, advanced the trading industry, providing access to stocks, options and futures. If you're born to trade, we could be for you. See our Overview for more.
Past performance, whether actual or indicated by historical tests of strategies, is no guarantee of future performance or success. There is a possibility that you may sustain a loss equal to or greater than your entire investment regardless of which asset class you trade (equities, options or futures); therefore, you should not invest or risk money that you cannot afford to lose. Online trading is not suitable for all investors. View the document titled Characteristics and Risks of Standardized Options at www.TradeStation.com . Before trading any asset class, customers must read the relevant risk disclosure statements on www.TradeStation.com . System access and trade placement and execution may be delayed or fail due to market volatility and volume, quote delays, system and software errors, Internet traffic, outages and other factors.
Securities and futures trading is offered to self-directed customers by TradeStation Securities, Inc., a broker-dealer registered with the Securities and Exchange Commission and a futures commission merchant licensed with the Commodity Futures Trading Commission). TradeStation Securities is a member of the Financial Industry Regulatory Authority, the National Futures Association, and a number of exchanges.
Options trading is not suitable for all investors. Your TradeStation Securities’ account application to trade options will be considered and approved or disapproved based on all relevant factors, including your trading experience. See www.TradeStation.com . Visit www.TradeStation.com for full details on the costs and fees associated with options.
Margin trading involves risks, and it is important that you fully understand those risks before trading on margin. The Margin Disclosure Statement outlines many of those risks, including that you can lose more funds than you deposit in your margin account; your brokerage firm can force the sale of securities in your account; your brokerage firm can sell your securities without contacting you; and you are not entitled to an extension of time on a margin call. Review the Margin Disclosure Statement at www.TradeStation.com .
TradeStation Securities, Inc. and TradeStation Technologies, Inc. are each wholly owned subsidiaries of TradeStation Group, Inc., both operating, and providing products and services, under the TradeStation brand and trademark. When applying for, or purchasing, accounts, subscriptions, products and services, it is important that you know which company you will be dealing with. Visit www.TradeStation.com for further important information explaining what this means.
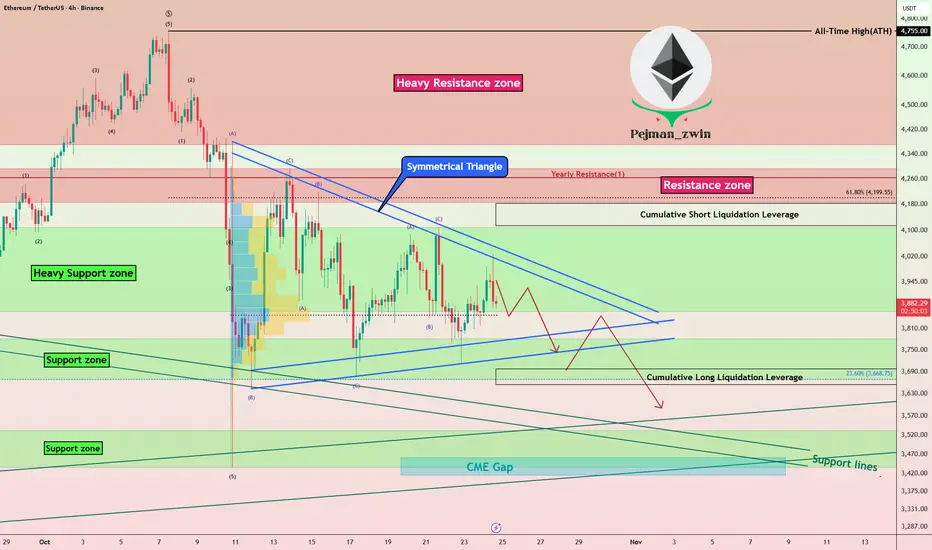
Ethereum in Symmetrical Triangle – Next Big Move Coming?Let’s take a look at Ethereum ( BINANCE:ETHUSDT ) on the 4-hour timeframe . Recently, Ethereum dropped by over -20% during the latest crypto market sell-off but has since started to recover. Right now, it appears to be in a corrective pattern, moving inside a Symmetrical Triangle Pattern .
Currently, Ethereum is testing a Heavy Support zone($4,107-$3,860) , and a break below that zone, confirmed by breaking the lower lines of the symmetrical triangle , could signal further downside.
Note: In general, a Symmetrical Triangle is a continuation pattern, and since the prior trend was downward, we might expect more downside if the broader crypto market continues to decline.
Before concluding, let’s also glance at the ETHBTC ( BINANCE:ETHBTC ) pair on the daily timeframe . It looks like ETHBTC has been in a downtrend and might revisit its support zone once more. That suggests if Bitcoin declines, Ethereum could see even more pressure .
In conclusion, I expect Ethereum to drop at least to its Support lines and Support zone($3,532-$3,436) after breaking the lower lines of the symmetrical triangle. There's also a CME Gap($3,461-$3,417) that might get filled.
Note: Keep in mind that weekend trading volumes are often lower, so the breakdown might not happen immediately. However, if tensions between the US and Venezuela escalate, we could see a sharper reaction even over the weekend.
First Target: $3,764
Second Target: $3,597
Stop Loss(SL): $4,044
Cumulative Short Liquidation Leverage: $4,182-$4,114
Cumulative Long Liquidation Leverage: $3,697-$3,3654
Please respect each other's ideas and express them politely if you agree or disagree.
Ethereum Analyze (ETHUSDT), 4-hour time frame.
Be sure to follow the updated ideas.
Do not forget to put a Stop loss for your positions (For every position you want to open).
Please follow your strategy and updates; this is just my Idea, and I will gladly see your ideas in this post.
Please do not forget the ✅' like '✅ button 🙏😊 & Share it with your friends; thanks, and Trade safe.
GOLD → A psychologically important level of $4,000 lies aheadFX:XAUUSD continues to correct, unable to consolidate above $4,100, with the 4K mark ahead. Pressure is intensifying due to hopes for a trade deal between the US and China, as well as profit-taking ahead of the Fed's decision on interest rates...
Key factors:
Progress in trade negotiations: the US has withdrawn the threat of 100% tariffs, and China may support the situation. Thursday's meeting between Trump and Xi Jinping increases the chances of a deal.
Bets on two rate cuts in 2024 are almost fully priced in. US inflation (3% y/y) was lower than forecast (3.1%), but did not change expectations.
The correction may continue if the positive backdrop for the trade deal remains. The Fed's decision on Wednesday will be a key catalyst.
Technically, the 4K zone is ahead, and it is too early to talk about a break of this support, as we do not know how the market will react. However, at the moment, the price is in the range of 4000-4163, and from a technical analysis point of view, it is logical to consider a false breakdown and a pullback.
Support levels: 4000, 3975, 3944
Resistance levels: 4060, 4090, 4163
As part of the decline, the market may test one of the specified zones: 4000, 3975, 3944. However, since a liquidity pool has formed below 4K, the reaction to the psychological support level may be aggressive. It is important to monitor the situation, as closing below 4K and consolidating below a strong level could trigger a further decline. Otherwise, if the bulls manage to hold their ground above 4K and bring the price back above 4050, the market may have a chance to grow.
Best regards, R. Linda!

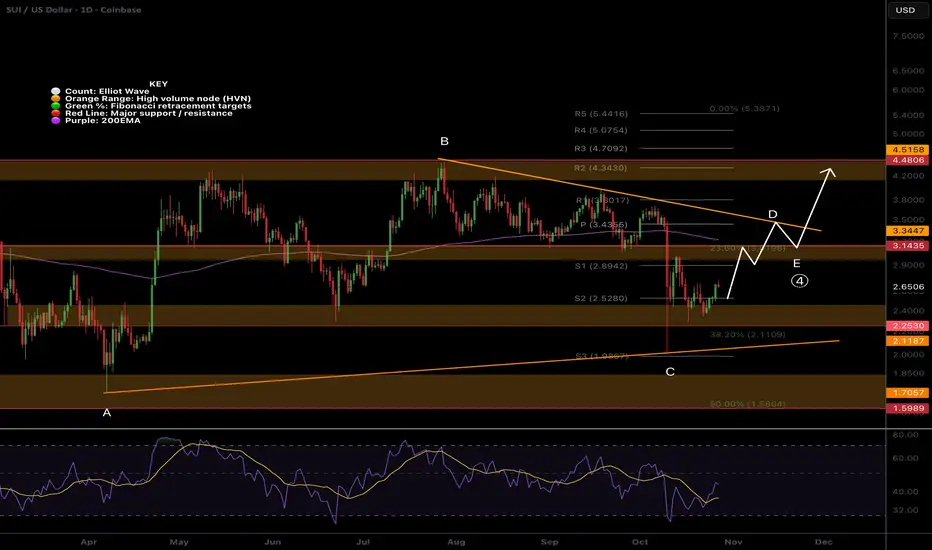
SUI remains in macro triangleNothing changed form last update, plan is playing out. Wave (c) of D is underway and should test the triangle upper boundary and find resistance at the High Volume Node along the way- $3.14.
Daily RSI hit oversold with no divergence. wave E is expected to be shallow
Safe trading
XRPUSDT → Pre-breakout base. Are the bulls back?BINANCE:XRPUSDT is attempting to break through the resistance of the trading range as part of a bullish run across the entire market. There is a chance that a breakthrough could form after a pullback...
The market is gradually buying back the liquidation that occurred on October 10. Bitcoin is breaking the structure, which indicates a possible return of the bulls. This sets a positive tone for the cryptocurrency market.
XRP is testing resistance and entering a consolidation phase. The trigger that could provoke growth is 2.661. However, as part of the consolidation, the market may test support before growth in order to hunt for liquidity.
Resistance levels: 2.661, 2.739
Support levels: 2.587, 2.547, 2.500
Since the opening of the session, the market has formed a fairly strong momentum, and at the beginning of the European trading session, a correction may form before the growth continues. As part of the correction, XRP may form a pullback to 2.587 - 2.500.
Best regards, R. Linda!
