CHANDI CHANDI CHANDIChandi made classic triangle pattern on daily charts & its on the verge of breaking out of golden triangle .
Risk:Reward = 1:3
Could b bought above 93660 with short/long term stoploss & mentioned target.
Triangle

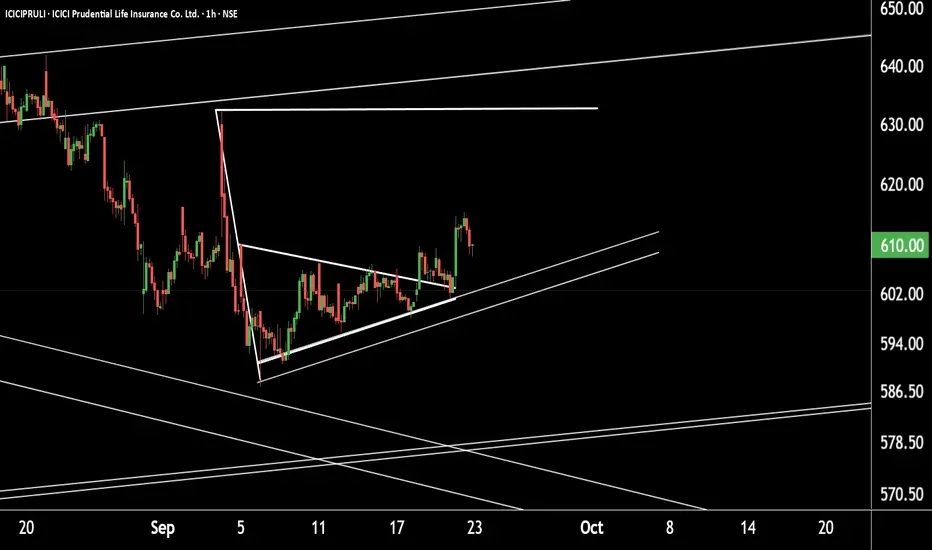
Securing growth with ICICI Prudential Life –A BUY for the futureTechnical Update: ICICI Prudential Life Insurance (1H Timeframe)
ICICIPRULI is currently moving in a Higher High – Higher Low (HH-HL) structure, indicating a strong uptrend. The stock is taking support near the ₹595–600 zone.
f this level is sustained, we may see the stock move towards its pattern target at ₹632–640.
Thank you!
GOLD → The rally continues. We are waiting for a pullback to buyFX:XAUUSD is rallying since the opening of the trading session. The movement has been continuing since Friday, after the end of the correction. The market is realizing the potential for interest rate cuts...
The metal is showing gains for the fifth week in a row, despite the local recovery of the dollar.
Key supporting factors: The forecast of two rate cuts before the end of the year continues to fuel interest. Tensions in US trade relations with India and other sources of instability. Upcoming PCE data on Friday may confirm the need for a soft policy. BUT! Caution is needed, as a short-term correction (profit-taking) is possible after record growth.
Resistance levels: 3730, 3740, 3750
Support levels: 3703, 3685, 3674
The price is in the ATH zone, having come a long way since the opening of the session, and a correction may form. It is dangerous to sell in the current zone, and for trading within the bullish trend, it is worth waiting for a pullback to the nearest local support levels...
Best regards, R. Linda!

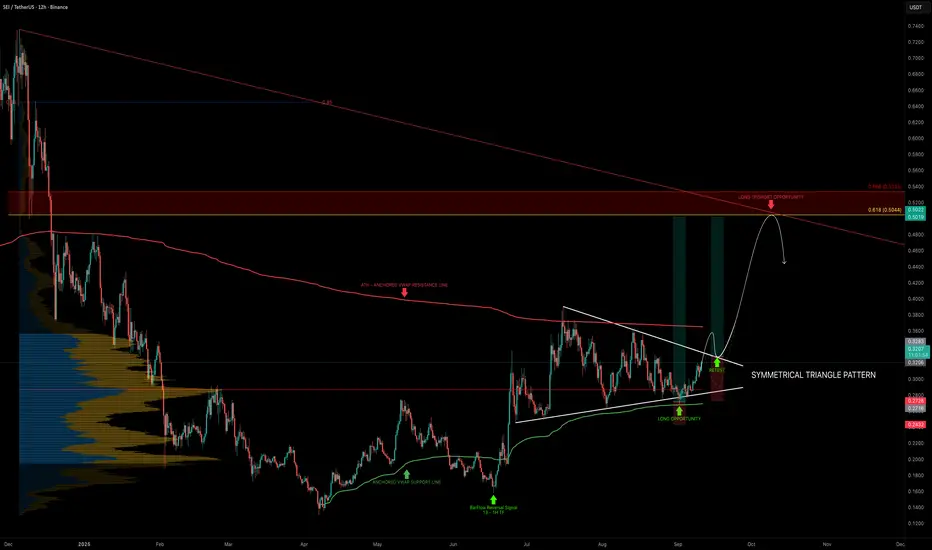
SEI — Triangle Pattern Breakout Ahead?SEI has been consolidating in a symmetrical triangle for the past 78 days, now reaching the apex, signaling that a big move is coming soon.
Price has been trading between two anchored VWAPs:
From the $0.13 low → acting as support (currently ~$0.27)
From the ATH → acting as resistance (currently ~$0.365)
The POC of the 280-day trading range sits at $0.287, a key pivot level to watch.
Support Confluence
Anchored VWAP (from $0.13 low): ~$0.27 (long entry zone already tested)
POC (280-day range): $0.287 → key stop-loss reference
Symmetrical triangle breakout retest: ~$0.33 → potential re-entry after breakout
Fib Speed Resistance Fan 0.618: ~$0.27 → reinforcing support at the anchored VWAP
Resistance Confluence
0.618 Fib retracement: $0.5044 → aligns with $0.5 key level
3B Market Cap resistance: ~$0.505
Fair Value Gap (FVG): sitting around $0.5
Trend-Based Fib Extension 1.0: $0.5 → major target confluence
🟢 Long Trade Setup
Entry Zone: Retest around $0.33 after breakout
Stop-Loss: Below $0.287 (POC), to be adjusted after seeing a clear reversal sign.
Target (TP): $0.50
Potential Gain: ~+50%
Timeframe: Could take ~1 month to play out
Technical Insight
SEI has been compressing for over two months, and volatility is about to expand.
The ideal entry at $0.27 (anchored VWAP support) has already triggered.
The next opportunity lies in a triangle breakout + retest around $0.33.
The $0.50 level stands out as a high-confluence target, combining Fib levels, market cap, FVG, and extension symmetry.
_________________________________
💬 If you found this helpful, drop a like and comment!
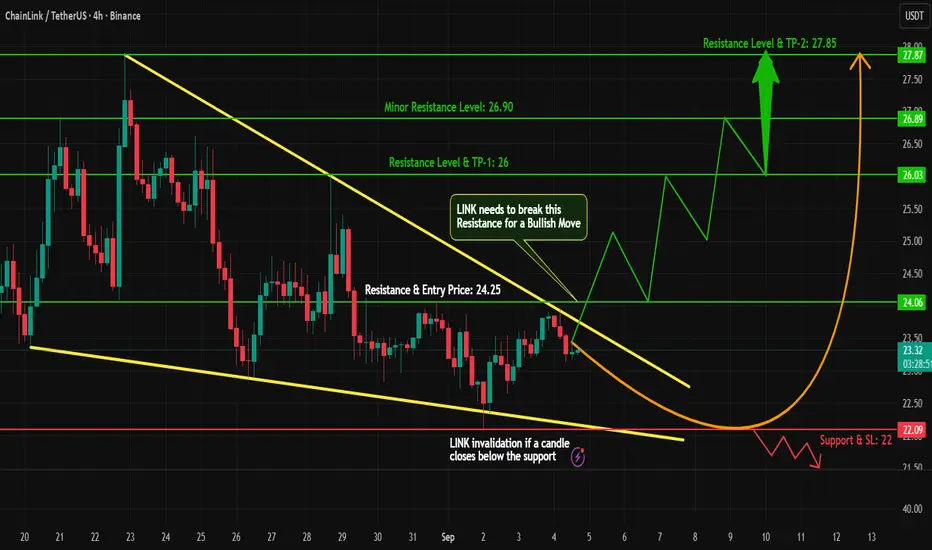
LINK (Chainlink) – Triangle Pattern Breakout Loading?#LINK is currently consolidating within a triangle pattern on the 4H timeframe. No bearish signals are visible for now, but volume remains low — indicating traders are waiting for a decisive move.
Key Points:
Triangle pattern forming on 4H chart
No bearish structure yet
Low volume = patience needed
Breakout above resistance with strong volume = bullish confirmation
Best setup: Enter long on retest with proper risk management
Plan the trade, trade the plan. A clean breakout with strong momentum could bring exciting upside opportunities.
What’s your outlook on #LINK? Do you expect a bullish breakout, or will bears surprise us? Drop your thoughts
#LINK #Chainlink #Crypto #Altcoins #Breakout #TrianglePattern #TradingView #CryptoTrading #PriceAction #CryptoCharts
WORLD LIBERTY FINANCE(#WLFI): Strong Bullish Signs?!📈WLFI may have completed the accumulation
Period following a completion of a strong bearish movement after launch.
I see a bullish breakout of a resistance line of a symmetrical triangle
on a 4H time frame.
This seems to indicate considerable buying interest.
The price could potentially continue to rise, possibly reaching the 0.30 to 0.50 level.

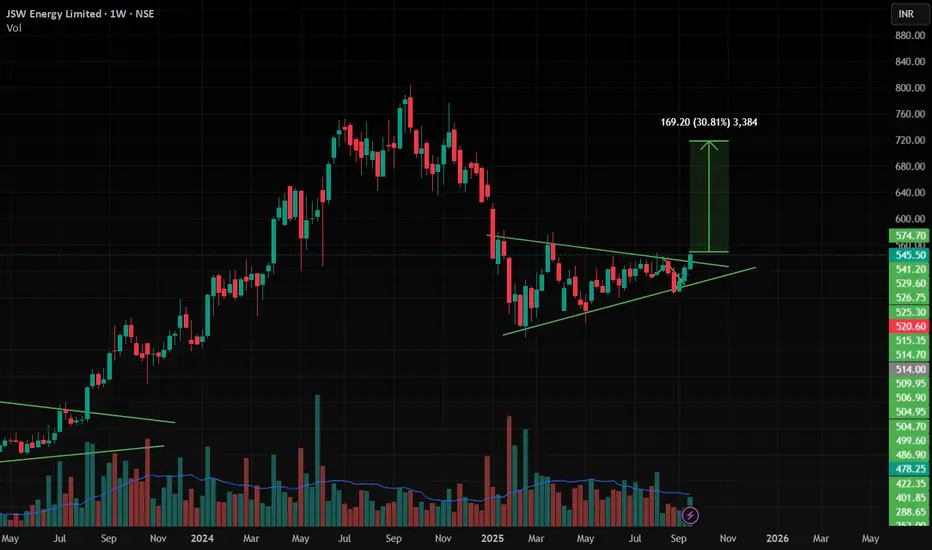
JSW Energy , 1W Breakout In this stock we clearly see the Triangle pattern is formed and given Breakout ,we can see very good move up to 30% nearly .
As now nifty is given Breakout from 1D Channel pattern and in Market Breadth 1D has given breakout and in weekly market Breadth it is near the Resistance , if we see good volume close in this week we can expect Market will be Bullish for next 2-3 Months .
Follow for more Swing Ideas Like This .
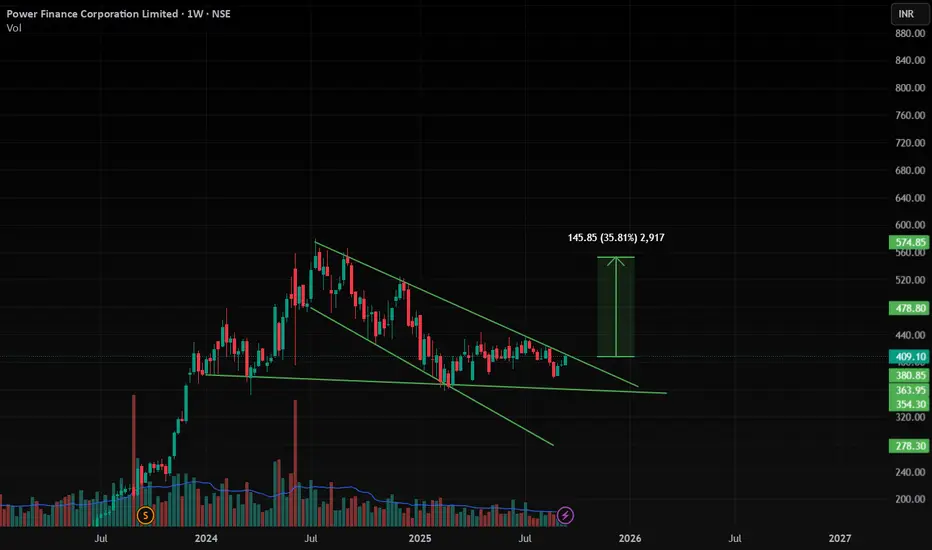
PFC , 1W Breakout In this stock we clearly see the Channel pattern is formed and Ready for Breakout , Wait for candle Close in 1D with good volume , then we can see very good move up to 35% nearly .
As now nifty is given Breakout from 1D Channel pattern and in Market Breadth 1D has given breakout and in weekly market Breadth it is near the Resistance , if we see good volume close in this week we can expect Market will be Bullish for next 2-3 Months .
Follow for more Swing Ideas Like This .
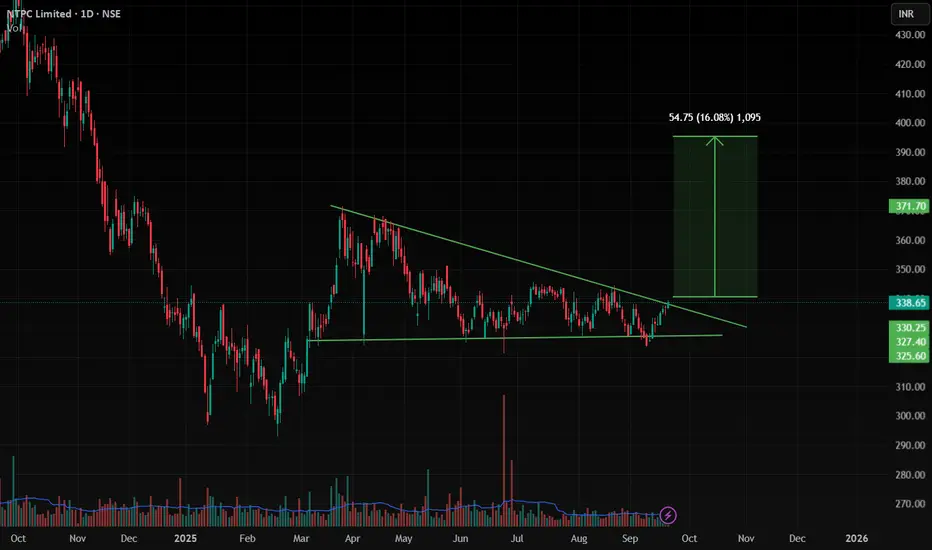
NTPC , Daily Breakout In this stock we clearly see the Triangle pattern is formed and Ready for Breakout , Wait for candle Close in 1D with good volume , then we can see very good move up to 15% nearly .
As now nifty is given Breakout from 1D Channel pattern and in Market Breadth 1D has given breakout and in weekly market Breadth it is near the Resistance , if we see good volume close in this week we can expect Market will be Bullish for next 2-3 Months .
Follow for more Swing Ideas Like This .
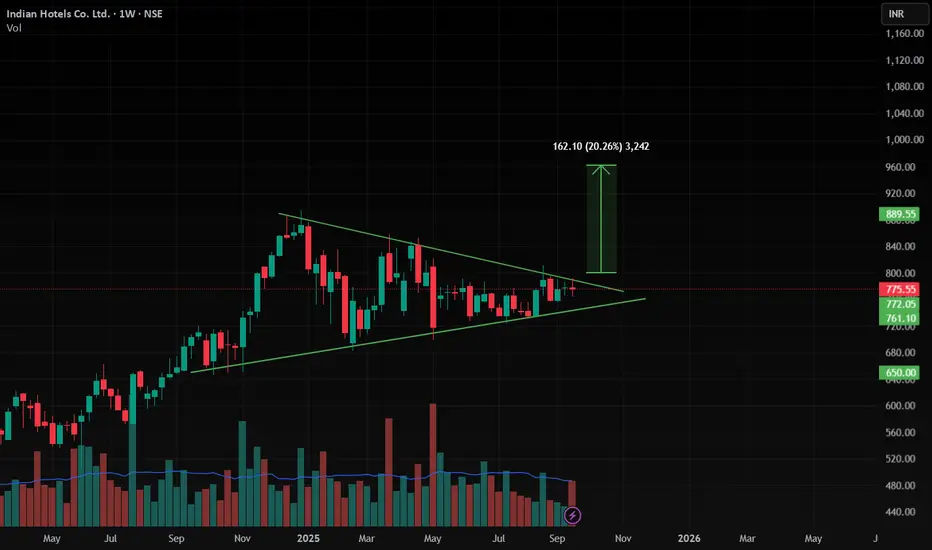
IndHotel Weekly Breakout In this stock we clearly see the Triangle pattern is formed and Ready for Breakout , Wait for candle Close in 1D with good volume , then we can see very good move up to 20% nearly .
As now nifty is given Breakout from 1D Channel pattern and in Market Breadth 1D has given breakout and in weekly market Breadth it is near the Resistance , if we see good volume close in this week we can expect Market will be Bullish for next 2-3 Months .
Follow for more Swing Ideas Like This .
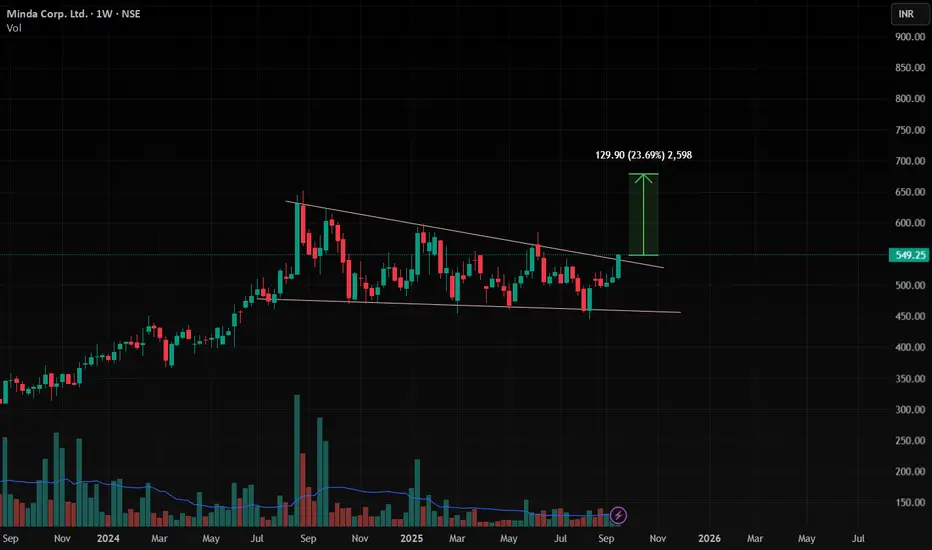
MindaCorp Weekly Breakout In this stock we clearly see the Triangle or Wedge pattern is formed and given Breakout ,we can see very good move up to 25% nearly .
As now nifty is given Breakout from 1D Channel pattern and in Market Breadth 1D has given breakout and in weekly market Breadth it is near the Resistance , if we see good volume close in this week we can expect Market will be Bullish for next 2-3 Months .
Follow for more Swing Ideas Like This .
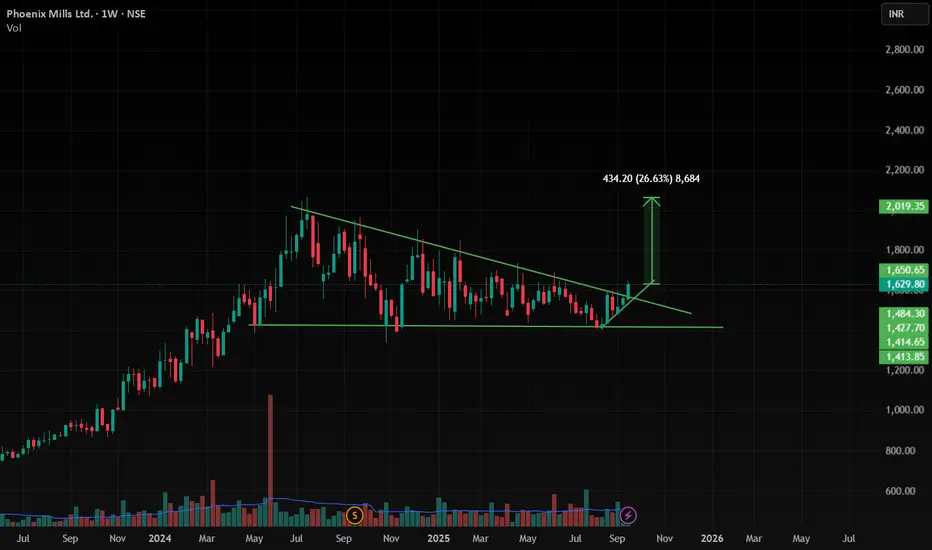
Phoenix Weekly Breakout In this stock we clearly see the Triangle pattern is formed and given Breakout , we can see very good move up to 30% nearly .
As now nifty is given Breakout from 1D Channel pattern and in Market Breadth 1D has given breakout and in weekly market Breadth it is near the Resistance , if we see good volume close in this week we can expect Market will be Bullish for next 2-3 Months .
Follow for more Swing Ideas Like This .
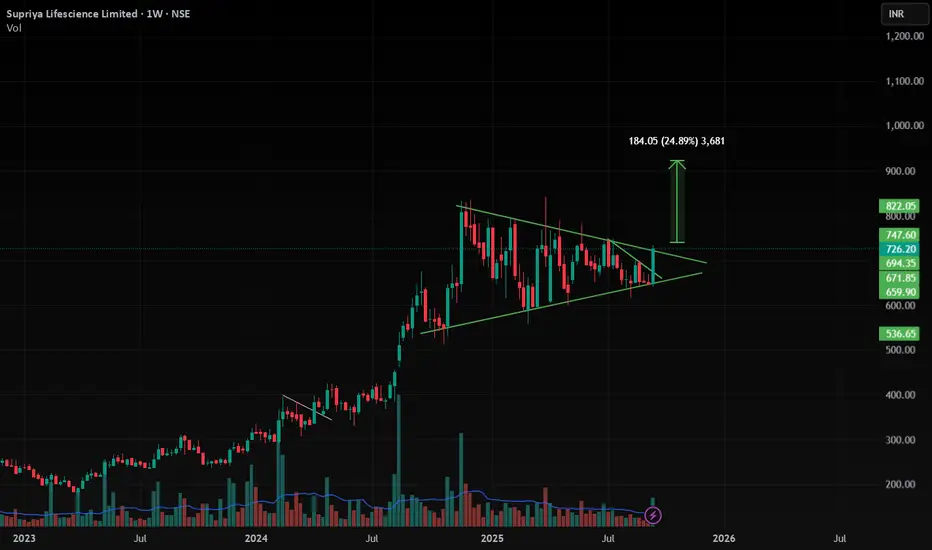
Supriya Weekly Breakout (Triangle)In this stock we clearly see the Triangle pattern is formed and Ready for Breakout , Wait for candle Close in 1D with good volume , then we can see very good move up to 30% nearly .
As now nifty is given Breakout from 1D Channel pattern and in Market Breadth 1D has given breakout and in weekly market Breadth it is near the Resistance , if we see good volume close in this week we can expect Market will be Bullish for next 2-3 Months .
Follow for more Swing Ideas Like This .
CAT - ASCENDING TRIANGLE BREAKOUT#1000CAT - Bullish breakout daily ✅🚀
As expected few days ago, price is tanking!
📈Ascending triangle breakout
📈Double bottom daily
📈Bullish trend ichimoku
Market looks also good to see a 10 - 15% bull move on #CAT !
#altcoins #1000cat #MEME

Triângulo Simétrico ETHWait for breakout with volume to define strategy. Recommended trigger: Return test on one of the lines (HTL or BTL). Pivot below MM21 with Fibonacci projection.

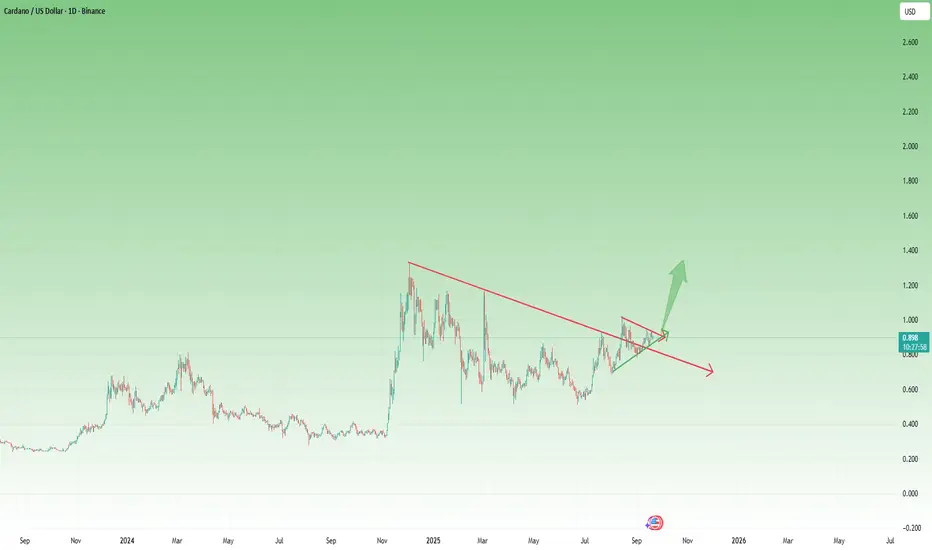
ADAUSD – Symmetrical Triangle Points to Upside BreakoutAs highlighted in my previous ADA analysis, I’ve maintained a bullish bias, recommending buys below 0.80 USD. Since then, price has indeed revisited the 0.80 support zone and rebounded strongly.
More importantly, since mid-August, ADA has been consolidating within a symmetrical triangle. Technically, this is a continuation pattern, and given that the broader trend from 0.50 (mid-June) has been constructive to the upside, probabilities favor an eventual bullish breakout.
Key Levels & Plan:
✅ Bullish bias remains intact above 0.80 USD
⚡ Breakout confirmation above 0.95 USD (recent resistance)
🎯 Upside target: 1.30 USD – a reasonable and achievable objective if momentum extends
Conclusion: Until proven otherwise, ADA’s structure suggests an upside continuation once resistance gives way. A breakout above 0.95 would serve as the clear green light for further gains. 🚀
Ethereum Triangle Breakout Trap – Bear Market FocusEthereum (ETHUSD) has formed a symmetrical triangle pattern, but an early breakout has already taken place before the structure was fully completed. Historically, such premature breakouts during the end phase of a crypto cycle often hint towards a bearish trend continuation.
Looking at past bear market cycles, there is a possibility that Ethereum could enter a deeper corrective phase in 2026, aligning with historical crypto market patterns. The key support zones to watch remain at $3000, $2300, and $1800, which could act as major levels in the upcoming months.
On the upside, Ethereum faces strong resistance between $4700 and $4900, where short setups become more favorable. For risk management, a stop loss above $5200 is recommended. Long positions have already been closed, and the focus now shifts towards short opportunities at resistance zones.
📌 This setup provides a clear risk-reward strategy for traders who are closely monitoring ETH price action in relation to cycle completion and historical bear market patterns.
👉 Follow me on TradingView for more crypto market insights, technical analysis, and trading updates. Share your thoughts in the comments – your feedback helps shape future analysis!

GOLD → Retest of resistance at 3660. What could happen?FX:XAUUSD is testing resistance to correction after breaking the local market structure from bearish to bullish. A breakout of 3660 could give buyers a chance...
A 25 bp rate cut to 4.25% was expected, but the forecast for further cuts came as a surprise: now two cuts before the end of 2025 (instead of one) and one in 2026.
The reason for the shift: fears of a slowdown in the labor market outweighed the risks from inflation (2.9% in August).
The dollar continues its countertrend correction (rebound) after Powell's speech and economic news. This temporary phenomenon may soon end. Gold, after a manipulative phase, may return to an upward movement if the price breaks 3660 and consolidates above this level.
The Fed preferred to support employment, risking accelerating inflation. In the long term, this will support risk assets and commodities, but in the short term, the markets have taken a pause.
Resistance levels: 3360, 3675, 3688
Support levels: 3643, 3631
Gold is not updating local lows, a cascade bottom is forming and the local bearish structure is breaking down. If the market manages to overcome the resistance of the correction, a bullish impulse may form!
Best regards, R. Linda!

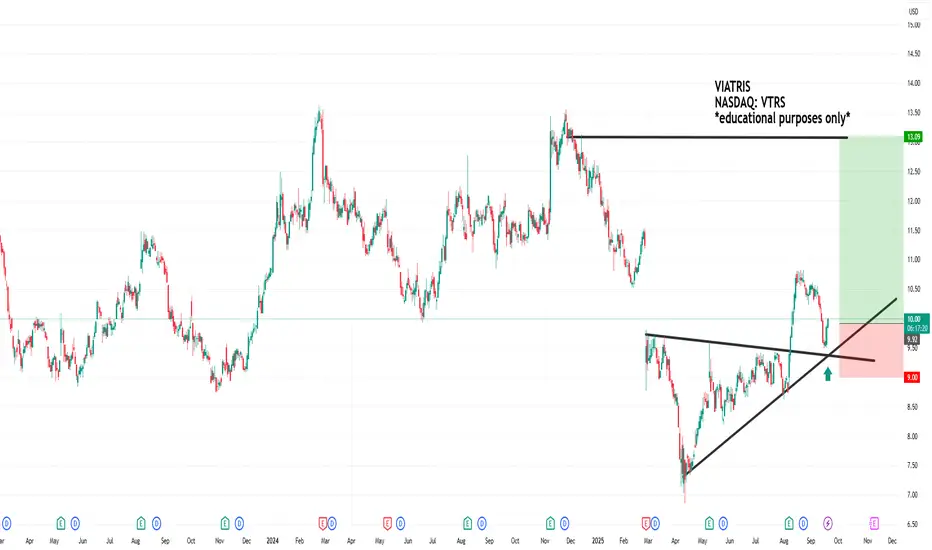
VTRS LONG Set-UpIt is a good spin off company. Pays a dividend, and the price action on the daily chart here is lining up nicely for a 2 - 6 month long position. Thank you !
SOLUSDT → Correction amid a strong bullish trend BINANCE:SOLUSDT , after updating its next high, formed a false breakout of local resistance and returned to the trading range as part of a correction. What to expect from altcoin?
The main driver of the crypto market, Bitcoin, is consolidating above 115K and facing fairly strong resistance at 117400. Earlier, the price completed a downward correction. The market is dominated by a positive technical and fundamental background.
SOL looks stronger than Bitcoin and is testing new highs...
The price of SOLANA is forming a false breakout of resistance and is entering a correction phase amid a bullish trend. As part of the correction, the price may test the local imbalance zone and the key liquidity level of 242.5.
Resistance levels: 244, 249.2, 253.5
Support levels: 242.5, 239, 231.5
Technically, the price may form a false breakdown of the nearest zone of interest at 242.5, and if the bulls manage to keep the price above the resistance zone of 242.5-244.0 after this maneuver, the coin may return to an upward movement. However, if this does not happen, I would wait for a retest of the 239.0 zone, where the trend support line is located. The medium- and long-term outlook for SOL is positive, and the price is highly likely to test the ATH 295.0.
Best regards, R. Linda!

Bitcoin Cornered as Bulls and Bears Battle for ControlWe’re approaching what may be a key moment for bitcoin’s medium-term directional risks, with the price sandwiched between horizontal resistance at $117,600 on the topside and the 50-day moving average and September uptrend on the downside. Whichever way it breaks—if that happens—may provide clues as to whether we’ll see another retest of the record high of $124,500.
From a momentum perspective, upside is favoured: RSI (14) continues to set higher highs above 50, while MACD has staged a bullish crossover of the signal line and is now pushing into positive territory. It’s not a slam-dunk case for bulls, but it’s a better backdrop than for bears.
Should we see a break above Thursday’s high and preferably a close, longs could be established above $117,600 with a stop beneath for protection. Minor resistance is located at $119,000, putting that on the radar as an initial target. If that level is cleared, eyes will then turn to a potential retest of the August highs.
Of note, bitcoin has performed particularly well in the December quarter recently, coinciding with the Fed’s dovish pivot in 2023 and Fed rate cuts and Donald Trump’s re-election in 2024. That doesn’t guarantee a similar outcome this time, but with the Fed signalling further rate cuts this year, it probably doesn’t hurt the bullish case either.
Should bitcoin break beneath the 50DMA/September uptrend, it could sow the seeds for a bearish setup, where shorts could be established beneath with a stop above, targeting $113,500 initially.
Good luck!
DS

After Breaking Massive Triangle, DOT’s First Real Test is at $5Polkadot has been a quiet story in 2025. From May to September, it sat in a big consolidation while rivals Solana and Cardano moved ahead.
Back in 2022–2023, all three were grouped together as Ethereum challengers. Over time, though, DOT slipped out of the spotlight while ADA and SOL kept building bullish structures.
That’s what makes the recent breakout interesting. Early September finally saw DOT push out of its triangle, and now it’s heading into its first real resistance test.
🔑 Key Levels
$5.00: 23.6% Fib retracement + Anchored vWAP since DOT’s $55 peak.
$6.45: Triangle measured-move target with the 38.6% Fib retracement from ATH.
Both levels are clean markers traders can build around. For traders, that’s the real story: DOT has clear levels and opportunities to exploit on the CFD chart.
📊 Cross-Pair View
DOT/ADA → Still suppressed under the 100 EMA band (blue).
DOT/SOL → Still capped by the 50 EMA band (green) and 200 EMA band (purple).
Relative to these two Layer-1 peers, DOT looks undervalued, but is beginning to chip away at resistance.
⚡ Posted by Alchemy Markets. Not financial advice — just sharing levels and setups we’re watching.

DOUBLE PATTERN:Cup and TriangleHello Traders,
All the eyes now on the next leg for the copper if Trump did not Finalize the Tariffs copper will go back to at least the bottom again 3.4 3.1 as every one kept loading up for the imports now the states is overloaded with loads of materials and minerals imagine what could happened if he didn't sign up this Tariffs on the mineral! they will be selling it for so cheap to cover the losses dramatically same like what happened with the oil its a commodity right !that's one scenario, the other one is every thing move as planned and the copper get back to the bottom of the triangle and shoot straight up so lets see what could happed I'm in short for now good luck, kindly support my idea if you like and make your decisions based on your research
