XAUUSD: Liquidity Grab Below Support, Expansion Ahead To $5,110Hello everyone, here is my breakdown of the current XAUUSD setup.
Market Analysis
Gold has been trading within a well-defined bullish environment, previously respecting a clean ascending channel, where price consistently formed higher highs and higher lows. This structure reflected strong buyer dominance and healthy trend continuation rather than impulsive exhaustion. During this phase, XAUUSD also went through a consolidation range, signaling accumulation before the next impulsive move. The breakout from the range triggered a strong bullish impulse, pushing price aggressively toward the 5,110 Resistance Zone, where sellers became active. This area acted as a major supply zone, leading to a sharp rejection and a deep corrective move. Price dropped impulsively, breaking below the rising channel and testing lower liquidity, which marked a short-term shift in market structure.
Currently, XAUUSD is stabilizing above the reclaimed support zone, with multiple breakout attempts confirming acceptance above demand. This price behavior indicates that buyers are gradually regaining control, while sellers are unable to push price back below key support.
My Scenario & Strategy
My primary scenario favors a bullish continuation, as long as XAUUSD holds above the 4,970 Support Zone and continues to respect the rising triangle support line. The recent reclaim and consolidation above support suggest that the prior drop was a fake breakdown, not the start of a sustained bearish trend. From a structural perspective, pullbacks toward the support zone are considered corrective, offering potential continuation opportunities rather than reversal signals. The next key upside objective lies at the 5,110 Resistance / Supply Zone (TP1), which aligns with previous supply and remains the main barrier for further upside. A clean breakout and acceptance above the 5,110 resistance would confirm bullish continuation and open the door for a renewed expansion toward higher levels.
However, a decisive breakdown and acceptance below the support zone and triangle support line would invalidate the bullish scenario and signal a return of bearish pressure. For now, structure favors buyers, with Gold holding above key demand and building strength for the next directional move.
That’s the setup I’m tracking. Thank you for your attention, and always manage your risk.
Triangle

BTCUSDT: Bullish Reclaim Opens Door to Higher LevelsHello everyone, here is my breakdown of the current BTCUSDT setup.
Market Analysis
BTCUSDT was previously trading within a well-defined downward channel, characterized by a clear sequence of lower highs and lower lows. This structure reflected controlled bearish pressure, where sellers remained in control but price action stayed orderly rather than impulsive. Each rally toward the channel resistance was consistently rejected, confirming the validity of the bearish trend and the dominance of supply at higher levels. As price approached the lower boundary of the descending channel, selling momentum began to weaken. BTC formed a base near the Support Zone around 69,700, where demand stepped in aggressively. This resulted in a sharp bullish reaction and a breakout below the channel followed by a quick reclaim, signaling a potential exhaustion of sellers. After this move, price successfully broke back above the key Support Zone, confirming acceptance above demand and shifting short-term market sentiment.
Currently, BTCUSDT is consolidating above the reclaimed support while respecting a rising triangle support line, indicating that buyers are gradually gaining control. This consolidation appears constructive rather than distributive, suggesting accumulation before the next directional move. The market is now transitioning from a bearish continuation phase into a corrective recovery structure.
My Scenario & Strategy
My primary scenario favors bullish continuation, as long as BTC remains above the Support Zone around 69,700 and continues to respect the rising triangle support line. The recent breakout and successful hold above support suggest that the move down was a fake breakdown rather than the start of a new bearish leg. From a structural perspective, the failure of sellers to push price back below support indicates weakening bearish momentum. The next key upside objective lies at the Resistance Zone around 73,000, which aligns with previous support-turned-resistance and the upper boundary of the prior structure. This level represents a logical TP1, where partial profits can be considered and where sellers may attempt to re-enter. A clean breakout and acceptance above 73,000 would confirm bullish continuation and open the door for further upside expansion.
However, if price fails to hold above the support zone and breaks decisively below the rising triangle support, the bullish scenario would be invalidated, and downside pressure could return. Until such a breakdown occurs, pullbacks toward support are viewed as corrective and potential buying opportunities rather than signals of renewed bearish continuation.
That’s the setup I’m tracking. Thank you for your attention, and always manage your risk.

EURUSD Buyers in Control After Corrective Move, Eyes on 1.1930Hello traders! Here’s my technical outlook on EURUSD (1H) based on the current chart structure. EURUSD previously traded within a strong bullish environment, supported by a well-defined rising trend line. During this phase, price consistently formed higher highs and higher lows, confirming sustained buyer control and healthy upside momentum. This bullish impulse led to a breakout above the key Buyer Zone around 1.1810, which acted as a strong demand area and structural support. After the impulsive move, price reached the Seller Zone / Resistance Level near 1.1930, where selling pressure stepped in. This resulted in a corrective pullback, with price respecting a descending resistance line, indicating a controlled correction rather than a full trend reversal. Importantly, the pullback found support back at the previous Buyer Zone, which has now been tested multiple times and shows clear acceptance as support. Currently, EURUSD is consolidating inside a tight range above the Buyer Zone, while also respecting the rising trend line from below. This compression between horizontal demand and dynamic support suggests that the market is building energy for the next directional move. The recent breakout attempt from the range indicates early bullish intent, while the structure still favors higher continuation as long as support holds. My primary scenario favors a bullish continuation as long as EURUSD remains above the 1.1810 Buyer Zone and continues to respect the rising trend line. The current consolidation appears to be a corrective pause within a broader bullish structure rather than distribution. A successful hold above support could lead to a gradual push higher, with the 1.1930 Resistance / Seller Zone acting as the first upside target (TP1). A clean breakout and acceptance above this resistance would confirm trend continuation and open the door for further upside expansion. However, a strong rejection from the Seller Zone could trigger another pullback toward demand. A decisive breakdown and acceptance below the Buyer Zone and trend line would invalidate the bullish scenario and signal a deeper corrective phase or potential range expansion to the downside. For now, market structure favors buyers, with demand holding firm and price compressing below resistance — a classic setup for a potential continuation move. Please share this idea with your friends and click Boost 🚀

GOLD - Consolidation above 5000. Awaiting NFP...CAPITALCOM:GOLD consolidates above $5,000 in anticipation of key data from the US. Economic data may set the medium-term tone for the market. A long squeeze before the move cannot be ruled out...
Central banks continue to buy metal, expectations of a more dovish Fed policy weaken the dollar. Easing tensions in the Middle East and growing risk appetite in global markets support the gold trend.
Ahead of us are the Employment Report (NFP) on Wednesday and
Inflation Data (CPI) on Friday .
These data will determine further expectations for Fed rates and the direction of the dollar.
Gold is in a state of equilibrium ahead of the release of critical data. A sustained breakout from the current range ($5000-5100) is likely only after the release of US employment and inflation reports, which will clarify the trajectory of the Fed's monetary policy.
Resistance levels: 5047, 5098, 5100
Support levels: 4946, 4902, 4811
The zone of interest and liquidity within the current movement is the 4950-4940 area. There is a possibility that during the transition from the European to the US session, the market will test this area before growing. However, a premature breakout of 5047 and a close above 5050 could trigger a rally to 5150-5250.
Best regards, R. Linda!

BITCOIN - From the DISTRIBUTION phase to the CONSOLIDATION phaseBINANCE:BTCUSDT.P tested 60K during the current cycle and formed a fairly significant pullback to 70K. However, it is too early to talk about a bullish trend; this is just a reaction to liquidation. The cycle continues...
At the moment, the decline is 52%, which is historically within acceptable limits and is a relatively average indicator.
Fundamentally, there is no support for the crypto market, and Friday's pullback was supported by the recovery of the US stock market.
Global and local trends are bearish, and local spikes in volume and bullish impulses are possible in the hunt for liquidity, which should be viewed conservatively.
The price has entered the key trading channel of 53K - 73K and is likely to stop within the current cycle and form another trading range, which may subsequently reinforce the reversal momentum. Key liquidity zones have not yet been tested: 59650 - 53330.
Resistance levels: 71,900, 73,800, 82,200
Support levels: 65,000, 59,650, 53,330
How can we tell that the market is ready to reverse? Technically, the reversal phase does not come immediately after distribution, the cycle of which is still ongoing. The market must enter a consolidation phase with the gradual formation of sequentially rising lows/highs. The breakdown of local structures + the market holding above key resistance levels will hint at a positive market sentiment.
Thus, we are waiting for the formation of an intermediate bottom and a change in the market phase from distributive to consolidation...
Best regards, R. Linda!

EURUSD Long: Demand Support Fuels Potential Upside Move Hello traders! Here’s a clear technical breakdown of EURUSD (3H) based on the current chart structure. EURUSD previously traded within a well-defined consolidation range, where price moved sideways for a prolonged period, signaling temporary equilibrium between buyers and sellers and gradual liquidity buildup. This ranging phase eventually resolved to the downside, leading to a sustained bearish move that developed into a clean descending channel, characterized by consistent lower highs and lower lows. Price respected the channel structure well, confirming controlled bearish pressure rather than panic selling. The decline culminated at a clear pivot low, where selling momentum weakened and buyers began to step in, triggering a structural shift. Following this pivot point, EURUSD broke out above the descending channel resistance, initiating a sharp bullish impulsive move. This rally reclaimed key levels and pushed price into the former Supply Zone around 1.1860–1.1870, where bullish momentum stalled.
Currently, EURUSD is consolidating above the Demand Zone and along the rising Demand Line, suggesting that the pullback is corrective rather than the start of a new bearish trend. Multiple reactions from this demand area indicate active buyer interest and defense of the level. As long as price continues to hold above the Demand Zone and respects the rising demand structure, the broader bias remains cautiously bullish.
My primary scenario favors upside continuation after consolidation. A successful hold above demand opens the door for a push back toward the 1.1870 Supply Zone (TP1), which represents the first major upside objective and a logical area for partial profit-taking. A clean breakout and acceptance above this supply level would confirm bullish continuation and signal potential expansion toward higher highs. On the other hand, a decisive breakdown and acceptance below the Demand Zone and the rising demand line would invalidate the bullish recovery scenario and signal a deeper corrective move. Until such confirmation appears, current market structure suggests balance with a bullish continuation bias from demand. Manage your risk!

EURUSD - Breakthrough of consolidation resistance. Growth?FX:EURUSD is ending its correction. A breakout of resistance and bullish momentum are forming. If the market maintains its current direction, the price could reach 1.197-1.210 in the medium term.
The dollar is falling due to the rise of the Japanese yen after early parliamentary elections, the impact of which may be medium-term.
After the dump, the currency pair formed a consolidation that stopped the local downtrend. The weakening of the dollar triggered a breakout of resistance. The exit from consolidation and the bearish wedge is a fairly strong bullish signal. The market may form a retest of 1.1829 before breaking through 1.1875. If the bulls break through resistance, the medium-term bullish trend may continue.
Resistance levels: 1.1875, 1.1972
Support levels: 171829, 1.1778, 1.1769
After consolidation, the market has entered a distribution phase. Given the current trend, the weak dollar, and the current market phase, there is potential for continued growth.
Best regards, R. Linda!

EURUSD: Triangle Resistance Holds - Bearish Bias Toward 1.1730Hello everyone, here is my breakdown of the current EURUSD setup.
Market Analysis
EURUSD previously traded within a well-defined consolidation range, where price moved sideways for an extended period, reflecting temporary balance between buyers and sellers and gradual liquidity accumulation. This range eventually resolved to the downside, initiating a sustained bearish move that developed into a clean downward channel, marked by consistent lower highs and lower lows. This structure confirmed strong seller control and an orderly bearish continuation rather than a panic-driven sell-off. After reaching the lower boundary of the descending channel, selling pressure weakened and price staged a corrective rebound. This rebound led to a breakout above the channel resistance and triggered a sharp bullish impulsive move, which reclaimed the Support Zone and extended into the Resistance Zone around 1.1800–1.1810.
Currently, EURUSD is trading below the Triangle Resistance Line, with price showing a weak pullback and consolidation just under the resistance zone. This behavior suggests a classic bearish retest scenario, where former support has flipped into resistance. The lack of impulsive bullish continuation and repeated rejections from the triangle resistance further reinforce the bearish bias.
My Scenario & Strategy
My primary scenario favors short continuation, as long as EURUSD remains below the 1.1800 Resistance Zone and the descending triangle resistance line. The recent bullish push appears corrective and liquidity-driven rather than the start of a sustainable trend reversal. From a structural perspective, the market has failed to reclaim higher highs, and the rejection from resistance confirms that sellers remain in control. As long as price stays capped below resistance, rallies are viewed as selling opportunities rather than signals of bullish continuation. The first downside objective lies near the 1.1730 Support Zone, which represents a key demand area and a prior reaction level. This zone is expected to act as the first major downside target where buyers may attempt a reaction or short-term stabilization. If EURUSD reaches the support zone and shows strong rejection or consolidation, a temporary bounce is possible.
However, a decisive breakdown and acceptance below 1.1730 would confirm further bearish continuation and open the door for a deeper move toward lower demand areas. The short bias remains valid as long as price respects resistance and the descending structure stays intact. A clean breakout and acceptance above the triangle resistance and the 1.1800 zone would invalidate the short scenario and shift focus back toward bullish continuation. Until then, overall structure clearly favors sellers.
That’s the setup I’m tracking. Thank you for your attention, and always manage your risk.

CLSK Still in a triangle, nothing change on the weekly/macroNASDAQ:CLSK remains firmly in the macro triangle boundaries and has not penetrated wave E on last weeks dumping price action.
In fact, wave (2) is still alive and now printing weekly bullish divergence!
Fib depths for the triangle remain deep 0.786+ which is a characteristic of triangle.
Price left a long lower wick and Friday closed at the high of a 22% bullish engulfing daily candle. Closing at the high on a Friday is a significant move as it shows investors are confident in holding over the weekend news cycle and Bitcoin price action.
The goal is still to break wave D to end the triangle and thrust us in our final move to take profits around $40. This will be highly likely one we get back above the weekly pivot and 200EMA ~£14.
Safe trading

Can Anything Stop Intel?Intel pulled back after reporting earnings, but some traders may think the chipmaker’s comeback is still underway.
The first pattern on today’s chart is the December 3 close of $43.76. INTC dropped to that level January 26, stabilized on January 27 and bounced on January 28. Has old resistance become new support?
Second is the January 15 high of $50.39. The stock has made a series of higher lows while staying below that level. The resulting ascending triangle is a potentially bullish continuation pattern.
Third, prices have remained above the 50-day simple moving average and the 8-day exponential moving average (EMA) is above the 21-day EMA. Those signals may reflect positive trends.
Next, some fundamental investors may see INTC as a value stock because it trades at lower price/sales and price/book ratios than many peers.
Finally, INTC is an active underlier in the options market. (Its average daily volume of 884,000 contracts ranks fourth in the S&P 500, according to TradeStation data.) That may help traders take positions with calls and puts.
TradeStation has, for decades, advanced the trading industry, providing access to stocks, options and futures. If you're born to trade, we could be for you. Learn more here about TradingView’s Broker of the Year!
Past performance, whether actual or indicated by historical tests of strategies, is no guarantee of future performance or success. There is a possibility that you may sustain a loss equal to or greater than your entire investment regardless of which asset class you trade (equities, options or futures); therefore, you should not invest or risk money that you cannot afford to lose. Online trading is not suitable for all investors. View the document titled Characteristics and Risks of Standardized Options at www.TradeStation.com . Before trading any asset class, customers must read the relevant risk disclosure statements on www.TradeStation.com . System access and trade placement and execution may be delayed or fail due to market volatility and volume, quote delays, system and software errors, Internet traffic, outages and other factors.
Securities and futures trading is offered to self-directed customers by TradeStation Securities, Inc., a broker-dealer registered with the Securities and Exchange Commission and a futures commission merchant licensed with the Commodity Futures Trading Commission). TradeStation Securities is a member of the Financial Industry Regulatory Authority, the National Futures Association, and a number of exchanges.
Options trading is not suitable for all investors. Your TradeStation Securities’ account application to trade options will be considered and approved or disapproved based on all relevant factors, including your trading experience. See www.TradeStation.com . Visit www.TradeStation.com for full details on the costs and fees associated with options.
Margin trading involves risks, and it is important that you fully understand those risks before trading on margin. The Margin Disclosure Statement outlines many of those risks, including that you can lose more funds than you deposit in your margin account; your brokerage firm can force the sale of securities in your account; your brokerage firm can sell your securities without contacting you; and you are not entitled to an extension of time on a margin call. Review the Margin Disclosure Statement at www.TradeStation.com .
TradeStation Securities, Inc. and TradeStation Technologies, Inc. are each wholly owned subsidiaries of TradeStation Group, Inc., both operating, and providing products and services, under the TradeStation brand and trademark. When applying for, or purchasing, accounts, subscriptions, products and services, it is important that you know which company you will be dealing with. Visit www.TradeStation.com for further important information explaining what this means.

Imminent break out for SOL!So currently we are in a triangle pattern and compressing/consolidating. There is a micro resistance at 89.61 that must break to continue up to the structural resistance level at $93.65. Expect a strong reaction here, and with a break here we should see an expansion to the upside to about the $106.00 area as depicted by the chart and price projection.

EURUSD Bullish Recovery After Healthy Correction, Target 1.1870Hello traders! Here’s my technical outlook on EURUSD (4H) based on the current chart structure. EURUSD previously traded within a mixed structure that transitioned from a broader corrective phase into a clear bullish recovery. After forming a base near the rising higher-timeframe trend line, price began to print higher lows, signaling the gradual return of buyer control. This recovery phase was supported by a breakout above the descending triangle resistance line, which marked an important structural shift and confirmed the end of the prior bearish pressure. However, after reaching the upper Resistance / Seller Zone around 1.1870, bullish momentum slowed, and the market faced rejection from this key level. This rejection initiated a corrective pullback, which brought price back toward the former breakout area and the Support Level / Buyer Zone near 1.1780–1.1800. This zone is significant, as it represents previous resistance turned support and aligns with the rising triangle support line, making it a critical area for buyers to defend. Currently, EURUSD is stabilizing above this support zone, suggesting that the pullback is corrective rather than the start of a new bearish leg. As long as price holds above the Buyer Zone and continues to respect the rising support structure, the overall bias remains bullish. My primary scenario favors continuation to the upside after consolidation or a shallow pullback, with a potential move back toward the 1.1870 Resistance Level (TP1). This area stands as the first major upside target and a logical zone for partial profit-taking. If EURUSD manages to break above the 1.1870 resistance with strong acceptance, this would confirm bullish continuation and open the door for further upside expansion. On the other hand, a decisive breakdown and acceptance below the Buyer Zone and rising support line would invalidate the bullish scenario and signal a deeper correction. Until such confirmation appears, EURUSD remains positioned for a bullish continuation within the current market structure. Always manage your risk and trade with confirmation. Please share this idea with your friends and click Boost 🚀

EURUSD - Bullish BiasAfter breaking out of the symmetrical triangle, the price is retesting the Resistance zone turned Support zone and that too at the crucial Golden FIB zone. There is a high chance that the price goes up to the high and possibly makes a higher high.
Please do your own analysis. This is not a BUY/SELL signal.
This is just my analysis regarding what the price might do in the coming week.

$USO TARGET $85Looking at the USO chart rough target up to $85 for the 5th Elliot wave and symmetrical triangle breakout $CL_F AMEX:USO

CIFR Triangle path played out nicely..NASDAQ:CIFR triangle in wave B played out, following my path closely, touching the daily 200EMA and major High Volume Node support line, at the 0.236 Fibonacci retracement. This is a highly probable place for wave 4 to end.
Triangle are a penultimate pattern, so that thrust lower last week should mark the end of the downtrend.
There is no divergence in the daily RSi and has a little room left to hit oversold but can do so on a bullish divergence without a new low.
Price closed Fridays candle at the highs +16% showing consumer confidence to hold over the weekend news cycle.
Safe trading

GOLD - Consolidation in a symmetrical triangle. Up or down? FX:XAUUSD showed signs of recovery on Friday, but the price is stuck within the boundaries of a symmetrical triangle, which generally indicates market uncertainty.
Key fundamental factors
The ADP, JOLTS, and unemployment claims reports pointed to weakness in the labor market, supporting expectations of two Fed rate cuts this year, which is positive for gold. Upcoming US-Iran talks are supporting demand for safe-haven assets, despite the conclusion of the Ukraine talks. Other central banks (the ECB and the Bank of England) easing policy has strengthened the dollar, putting pressure on gold.
Gold's attempt at recovery looks vulnerable. Although weak employment data and geopolitical risks provide support, the main counterforce remains the global rotation of capital in favor of the US dollar.
Technically, the market may have a chance to break through the correction resistance, but will there be support from traders?
Resistance levels: 4901, 5021, 5100
Support levels: 4811, 4751, 4670
I expect that before attempting a breakout, the market may try to test liquidity in the 4812 zone. However, if the market breaks through the resistance conglomerate and manages to close above 4901, then the market will be able to continue its growth towards 5000.
Otherwise, if 4812 does not hold the price, the market will close within the boundaries of a symmetrical triangle (flat).
Best regards, R. Linda!

EURJPY - Breaking through resistance. Ready for growth FX:EURJPY is consolidating above the previously broken resistance level of 184.75 as part of a bullish trend. If the bulls maintain support, the price will be able to continue growing.
The euro continues to strengthen against the weak Japanese yen. The market is consolidating above the interim high of 184.75. Support plays an important role before the continuation of growth
The trend is bullish, with the 182.7 long squeeze triggering a recovery phase in which the currency pair calmly overcame key resistance at 184.39-184.75 and formed consolidation above the level, confirming bullish intentions
Resistance levels: 185.53, 186.42
Support levels: 184.75, 184.39
Consolidation above 184.75 - 185.0 followed by a breakout of local resistance could trigger another rally within the bullish trend.
Best regards, R. Linda!

GOLD - Correction (local downtrend). Range?FX:XAUUSD is showing increased volatility on Thursday, fluctuating within a wide range of 4800-5100. The market may move into consolidation...
Key fundamental factors
The USD's rise to two-week highs is putting pressure on gold. A weak ADP private sector employment report (22K vs. 48K forecast) supports expectations of two Fed rate cuts this year (limiting gold's decline). The agreement on negotiations between the US and Iran in Oman on Friday temporarily reduces demand for safe-haven assets.
Today's JOLTS (job openings) data and weekly jobless claims may strengthen or weaken expectations for Fed rates.
Gold is balancing between conflicting factors: a strong dollar and reduced geopolitical risks are weighing on prices, while weak employment data and general uncertainty about Fed policy are providing support.
Resistance levels: 4941, 5021, 5100
Support levels: 4856, 4751, 4670
The market is in a correction phase, with pressure in the 4950-5000 zones intensifying local sell-offs ahead of the news. The structure will be broken if gold breaks through the 4950 conglomerate and downward resistance and consolidates above this zone. But at the moment, I am considering a decline to 4751-4670 and a possible rebound with the aim of forming a sideways range.
Best regards, R. Linda!

NVDA 1D: Pause before the next chipOn the daily chart NVIDIA has shifted from a strong impulsive advance into a consolidation phase. After printing new local highs, price formed a contracting structure, broke higher, and returned for a retest of the breakout area. Selling pressure remains limited, with no follow-through to the downside, suggesting a pause within trend rather than a reversal.
Structurally, price action reflects consolidation inside a broader uptrend. The 185–190 area remains the key holding zone, where price stabilized after the retest and continues to trade above the 100-day moving average. Higher lows are preserved, keeping the higher timeframe structure intact. MACD holds above the zero line, while ADX continues to decline, confirming compression rather than directional expansion.
The primary reaction level sits near 212, marking the upper boundary of the current consolidation. Acceptance above this level would allow for continuation toward the 230–232 area, aligning with the upper expansion of the range. A failure to hold the 185-190 zone would shift price into a wider neutral structure without confirmation of trend continuation.
Fundamentally, NVIDIA remains strong. Q3 2025 EPS came in at 1.30 USD, with Q4 2025 EPS estimated at 1.52 USD ahead of the February 26, 2026 earnings release. Revenue reached 57.01B USD in Q3, with expectations of 65.56B USD for Q4. Cash flows remain robust, with operating cash flow at 83.16B USD and free cash flow at 77.32B USD. Compute and Networking continues to be the dominant revenue driver.
As long as structure holds, the market remains in digestion mode following the prior impulse.
Price action leads before fundamentals follow.

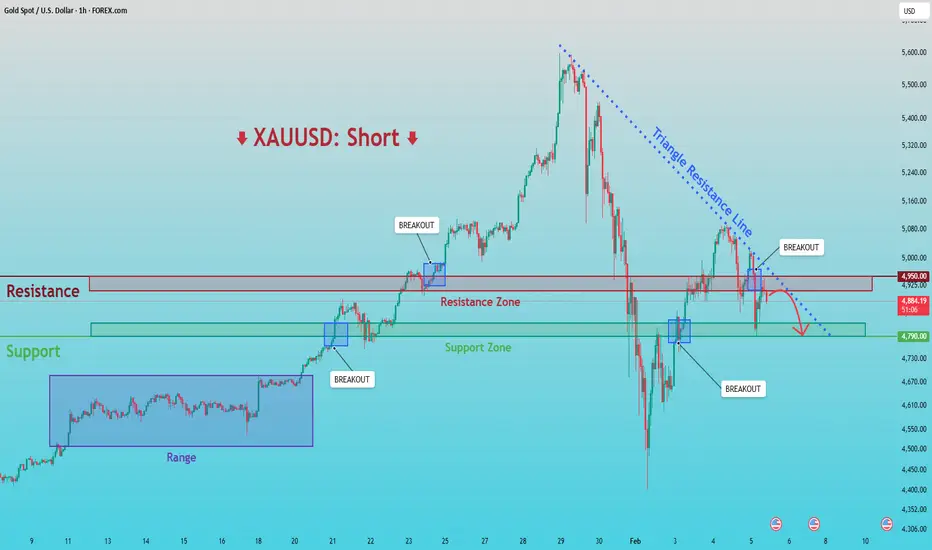
XAUUSD: Breakdown & Retest Signals Bearish ContinuationHello everyone, here is my breakdown of the current XAUUSD setup.
Market Analysis
XAUUSD previously traded within a well-defined consolidation range, where price moved sideways for an extended period, indicating balance between buyers and sellers and gradual liquidity accumulation. This range eventually resolved to the upside, triggering a clean bullish breakout and a strong impulsive rally. Following the breakout, gold expanded higher aggressively, confirming bullish intent and attracting momentum buyers. However, after reaching the upper highs near the peak of the move, bullish momentum began to fade, and price formed a clear swing top.
Currently, XAUUSD is trading below a key Resistance Zone around 4,950, which previously acted as support but has now flipped into resistance. Several breakouts above this zone failed, suggesting lack of acceptance and strong seller presence. At the same time, price recently broke below the descending triangle support and is attempting a weak pullback toward the broken structure — a classic bearish retest scenario.
My Scenario & Strategy
My primary scenario favors a short continuation, as long as price remains below the descending triangle resistance line and below the 4,950 Resistance Zone. The recent breakout attempts above resistance appear corrective and liquidity-driven rather than signs of a trend reversal. As long as these levels cap price, rallies are viewed as selling opportunities rather than bullish continuation signals. From a structural perspective, the market is transitioning from a bullish expansion phase into a broader corrective or distribution phase. The loss of higher highs and repeated rejections from resistance support the bearish case. The first downside objective lies near the 4,790 Support Zone, which represents a key demand area and a prior breakout level. This zone is expected to act as the first major target where buyers may attempt a reaction. If price reaches the support zone and shows strong rejection or consolidation, a temporary bounce is possible.
However, a clean breakdown and acceptance below 4,790 would confirm bearish continuation and open the door for a deeper move toward lower demand areas. The short bias remains valid as long as price stays below resistance and the descending structure remains intact. Any strong breakout and acceptance above the triangle resistance and the 4,950 zone would invalidate the short scenario and shift focus back to bullish continuation. Until then, structure favors sellers.
That’s the setup I’m tracking. Thank you for your attention, and always manage your risk.
EURUSD: Buyers Defend 1.1780 - Upside in Focus 1.1870Hello everyone, here is my breakdown of the current EURUSD setup.
Market Analysis
EURUSD was previously trading within a well-defined downward channel, where price consistently respected the descending resistance and support boundaries, forming a series of lower highs and lower lows. This structure confirmed sustained bearish control and orderly downside continuation. During this phase, several bearish pushes developed smoothly within the channel, highlighting strong seller dominance. After breaking the channel, EURUSD continued higher and successfully reclaimed the Support Zone around 1.1780, which acted as a key decision level. The breakout and subsequent hold above this zone confirmed a change from bearish structure into a bullish recovery phase. Price then accelerated toward the 1.1870 Resistance Zone, where supply became active again, resulting in consolidation and multiple breakout attempts.
Currently, price is trading above the rising trend line, while also forming a descending corrective structure beneath the triangle resistance line. Despite the pullback, the market continues to respect higher lows, suggesting that the recent decline is corrective rather than impulsively bearish. The ability of EURUSD to hold above the support zone keeps the bullish structure intact.
My Scenario & Strategy
My primary scenario favors a long continuation as long as EURUSD holds above the 1.1780 Support Zone and respects the rising trend line. The current consolidation appears to be a corrective pause within a broader bullish structure. A successful break and acceptance above the triangle resistance and the 1.1870 Resistance Zone would likely trigger renewed upside momentum. If buyers manage to reclaim and hold above resistance, the next bullish leg could extend higher, following the direction of the dominant trend.
However, a decisive breakdown below the support zone and trend line would weaken the bullish scenario and signal a potential deeper correction or range formation. For now, structure favors buyers, with pullbacks viewed as opportunities for continuation rather than trend reversal. EURUSD remains at a key technical decision area, and price reaction around support will be critical for the next move.
That’s the setup I’m tracking. Thank you for your attention, and always manage your risk.

Coiling inThe price is trading within the triangle shown on the chart. This stock makes explosives moves. I think one is coming up. It might take a couple of more weeks or not, who knows but I'm not missing the break out. SL triggers if a weekly candles breaks down the support zone shown and CLOSES under it.

CIFR triangle in wave B has completed, per previousNASDAQ:CIFR has completed the triangle in wave B of 4 with thrust down in wave C, characteristic behaviour of wave Cs.
Triangle are patterns found before a terminal move suggesting we are nearing a bottom at the daily 200EMA, 0.236 Fibonacci retracement.
Safe trading
