THE WEEK AHEAD: TWTR EARNINGS; USO, EEM, IWM, UNG, XOPTWTR announces earnings on Thursday before market open, and with a rank of 92 and a 30-day implied of 70, it presents ideal metrics for a earnings announcement volatility contraction play.
As of Friday close, the November 16th 25/34 short strangle is paying 1.57 (.79 profit at 50% max), with a net delta of .39 and a theta of 6.45, and break evens of 23.43/35.57 (wide of the expected move).
For those willing to bet a little more strongly on its not moving much more than the expected move: the November 16th 29 short straddle is paying 4.47 (1.12 profit at 25% max), with break evens of 24.26/33.74.
On the exchange-traded fund front: USO (73/30), EEM (67/25), and IWM (66/22) round out the top three underlyings when sorted by rank. UNG (42/41); EWZ (56/38); and XOP (53/32) are the top three when sorted by 30-day implied.
Possible Trades:
A USO December 21st 14.5/15 skinny short strangle* is paying 1.10 at the mid price with break evens of 13.40/16.10. Given the fact that this is basically a short straddle setup where I would shoot for 25% max, 1.10 isn't exactly compelling on a 1-contract basis (.28 at 25% max), but its small size makes it ideal for layering on setups over time in order to generate a worthwhile, multiple contract position that has some juice in it.
An EEM, December 21st 39/40 skinny short strangle is paying 2.68 at the mid price with break evens of 36.32/42.68. Go 25-delta short strangle -- the 37/42, and you bring in 1.24 in credit with 35.76/43.23 break evens. For defined risk, there's the double diagonal, (See Post Below). The December 21st 35/37/41/43 iron condor pays .70; going three-wide won't pay at least one-third unless you bring in the wings to a 35/38/41/44, which is paying 1.33.
An IWM December 21st, 16 delta, 139/165 short strangle is paying 2.43 with break evens of 136.57/167.43, which encompasses much of the last 52 week's range between 142.50 and 173.39. A delta neutral 141/145/162/165 iron condor pays 1.40; the slightly narrower 142/145/162/164 pays 1.05.
With UNG, I've had my eye on a short setup, (See Post Below), but don't want to pull the trigger too early. We're winding into winter, after all, which generally means increased natural gas usage and draw downs of current supplies. That being said, the notion behind the setup is that even if my timing is slightly off, a setup with a long-dated back month will eventually benefit as we emerge from winter, so I'm looking at putting the back month out in time and in an expiry when seasonality favors natty weakness. Unfortunately, the only available post-winter expiry is April, and I'd rather have an early to mid summer back month, so I'm fine with being patient here.
XOP has been double whammered with broad market weakness on top of oil weakness and is now at the bottom of the range between 40 and 45.50 it's been in since mid-April and a bit above the middle of its 52-week range between 31 and 45.50 with the low set in the early February sell-off. To me, that suggests "directionally neutral": the December 21st 40 short straddle pays 4.16 with break evens at 35.84 and 44.16; the 36/44 short strangle in the same expiry pays 1.40 with break evens at 34.60/45.40.
* -- The reason I would go with a skinny short strangle here instead of a short straddle is because price was 14.72 as of Friday close, which is in between the 14.5 and 15 strikes.
UNG

TRADE IDEA: UNG JAN/APRIL 23/32 PUT DIAGONALMetrics:
Max Profit on Setup: 3.00
Max Loss/Buying Power Effect on Setup: 6.00
Break Even: 26 versus 26.06 spot
Debit Paid to Spread Width Ratio: 67%
Delta: -48.42 (bearish assumption)
Theta: .28
Notes: In an ideal world, there would be a December expiry currently available for the front month leg (there will be one after October drops off) and a price in the 28 area to put this on, but I wanted to get a preliminary idea of whether it would pay and what the metrics were, with the focus being on the debit paid/spread width ratio (<75% is bueno). I'll look at pulling the trigger on this if price gets back to 28, adjusting the strikes if necessary to accommodate ... .


Nat Gas - Daily RSI overbought, Weekly has some room to runNat Gas - Daily RSI overbought, Weekly has some room to run. Fib levels - .382 support = $3.08, Fib .5 resistance = $3.53. EIA nat gas report thursday should determine NG direction. $HNU 2x ETF for canadians or $ugaz 3x ETF for USA

F/U on Natural Gas My last posting suggested natural gas may turn up and it has ( see link below from 2.12). It’s corrected some the last few days. Is the up trend now over? I favor it is not. I remain long. If get bullish action I will add to my position. Notice positive reversal in 4 hour RSI.
If you go long could use a close <than the 4 hour up trend line as a stop. Process your way. Feedback welcome.

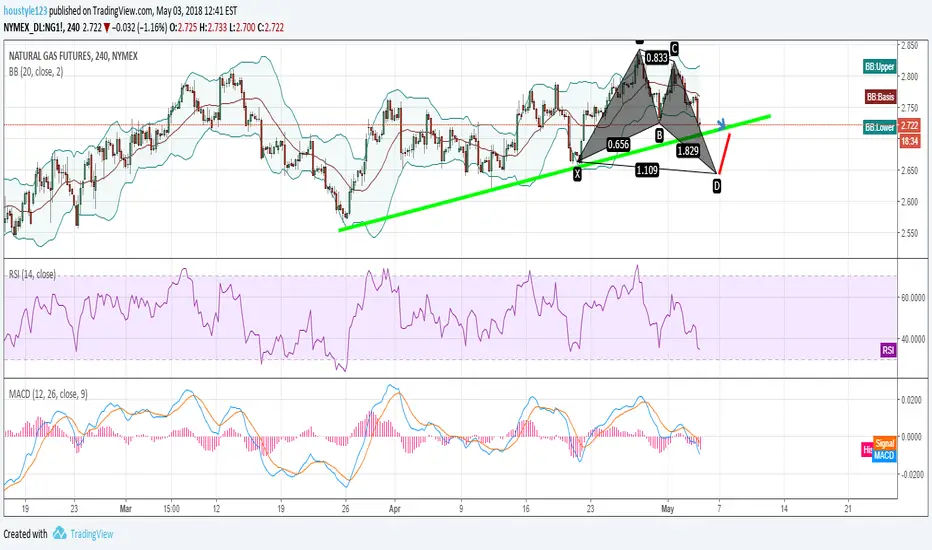
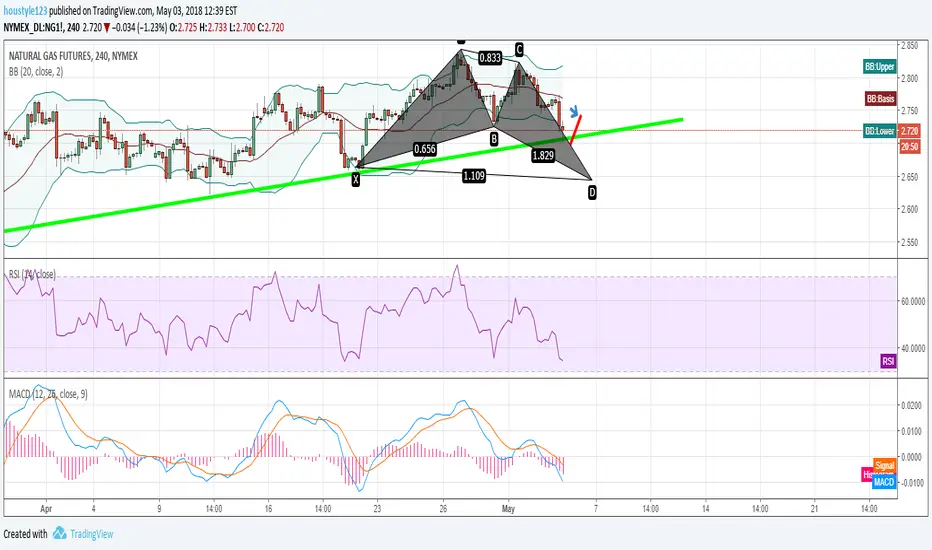
natural gasI have been trading these larger swing over the last few weeks and have been pretty accurate. Todays reversal was a happy site. But this pattern is anything but simple. I don't think we are in a typical short term, ABC due to the pattern. And there was a bullish divergence that appears to be starting to play out. The BBands on the daily are very very tight. Big move coming!
And this monthly chart below is showing a very large bullish divergence. From this long term view...this looking like a typical B wave pattern that we are working through. I really feel that we are close to making a move. With the BBands showing that we are about to make a very big move...I am biased with a move up to break out of this flag and complete the B wave.
GL


Natural Gas "my long term perspective"This is the monthly chart for Nat Gas. As you can see I think we are nearing the next push up to finish a large B wave. But if you look at the time frame...it could be a while until such a big move happens. Short term thought....I think we are going to be starting a 3rd subwave up soon. Hope this helps a little bit.

Natural Gas Ugaz DgazSo this wave count is nearly impossible to make out. But I believe that we are near the top of the beginning diagonal and should make a brief correction soon. I tried to get a measurement of the beginning of the wedge for a measured move down. Interestingly it is nearly perfect with a .618% Fib assuming I lined up with the correct bottom. The volume is nearly gone so that is another reason why I think we could get a brief drop before the big push up. So maybe sometime tomorrow I might sell ugaz and wait to buy the dip. GL

NATGAS Range Interesting Adam-Eve bottom pair potential.
Also, here are the levels that I'm watching. Anything could happen here, and would not be surprised to see it hit the bottom Green line or break above the resistance Red Line.
Short term support at black line.
Current position at Black line. Will continue to accumulate more if we come back to the black line, and double down on at the Green Line.
Swing Trade

Natural Gas: Maybe about to turn upNatural Gas from the weekly chart clearly is in a longer term downtrend. From the daily chart we are now for the 2nd time at a .62 retraction of the recent rise. IFFF the sideways action since is what the EWT folks call a "flat" we may well be ready for a sizable up move. Stay tuned. Feedback on this would be greatly appreciated as the picture is far from clear. Would like to know what others think.

Natural Gas "going up Finally"Here on a smaller time frame....I am expecting another push up tomorrow to complete the larger wave 1. I will probably sell at that point and buy the dip. Hoping for a .618% pullback before the real big run starts. GL

Natural Gas "It just Dawned on me"I was laying on my couch thinking about NG and wondering what in the hell is going on with it. Then it dawned on me. After years of a bear market for natural gas, We are in a corrective ABC pattern. DUH, right. So then I was wondering about the last month of this uptrend and how complicated it was and thought, what if we had an ending diagnol for the A wave and we are now in the B wave. When I drew it, I saw how this drop over the last few days now made sense. SO assuming the drop has completed, we should get a zig zag moving up and then another drop and then a larger C wave up to higher highs. I would not be surprised if the zig zag moves up to the decending trend line. This makes the most sense for me right now. So I am in UGAZ for now. GL


Natural Gas "Maybe Finally the winter rally"Lets see how this plays out ...but....I think that grey area that I had previously talked about was squashed today. I am hoping we close above the first trend line. A close above the next one is super bullish. I think a little flag consolidation just below the next trend line would be a great sign.

Natural Gas UGAZ DGAZHere is the Natural Gas 4 hour chart. I still think we are in a grey area and some type of confirmation should be waited upon. We could very well be in a zig zag corrective pattern. We will know in the next couple days. If it drops again into that red zone then I think I will buy UGAZ again. On a side note....if by chance UGAZ dropped below the red zone then perhaps the cycles do work. But we will cross that bridge when we get there.

Natural GasNatural gas is simply killing me. I left up the possible cycles just in case for some strange reason, NG dumps into mid January. But it sure does not look like its going to dump. It appears that we have started that winter rally. If this is the real winter rally, then a brief pullback would be a great opportunity to get back in this thing. NG left a large upper wick today so we will see what happens next week. I tried to apply wave analysis to NG but that looks to be a mistake. This has more to do with supply demand in cold weather. I am just going to watch this thing and see what happens to it if it does drop back to test that black trend line. If this is the start of the rally then that should last at least a month of huge gains.

NATGAS Bullish Once MoreNATGAS has has both a strong local and general double bottom and is looking to retest 3.0-3.1 and higher before it sees 2.5 again. Strong gap up over weekend was very predictable as is evidenced from my idea last week.
With both strong fundamentals (bullish report) and strong technicals (respected double bottoms) shorts would be wise to wait and watch for a while.
For those who are getting in late, UGAZ should still be a good buy come market open on Tuesday with a safe selling target of 3.05 (in the NATGAS index) or possibly even higher should we break into the fib channel at 3.1 or so.
Stay safe and good luck!
EDIT:
Attached is an image of the local double bottom in case you can't see it because of my text bubble.

Natural Gas "UGAZ DGAZ"SO we did fill the gap. I am thinking that we will touch that red line which corresponds to a couple bottoms last year. The question is whether or not we finally start the winter rally or simply set up to fill that last gap. Today a subscription that I get, had an update for XLR (the general energy ETF). Their chart showed the general energy fund dropping until January 18th. Before this came today, I was toying around with the cycle analysis tool and was trying to find a pattern in the cycles (if there were any). Not really an easy task with NG. BUT...I did have that tentative cycle showing a bottom on....coincidently....January 18th. That made me go HMMMM. Is NG going to have a very late winter rally. I think I will hold off on this trade and just watch the price action. If I am correct....THIS TIME....then NG could drop way down there and have a short by rapid winter rally. Perhaps that has something to do with the 10 to 1 reverse split for UGAZ coming up on the 20th.
above is a longer term view of NG with my cycle analysis. It looks pretty fitting.

What to do with NATGAS going forwardNATGASUSD
Double top testing green fib chamber rejected and dropping to bottom of yellow fib chamber. While 2.5 or below is possible it looks as though a double bottom may form at around 2.583 or so matching up with the price in February.
Looking for confirmation of a bounce before riding AMEX:UGAZ all the way back up to an almost guaranteed 3.0 or so.
Be careful and take extra caution when trying to catch a falling knife. Look for confirmation of a double bottom and miss a little profit rather than miss the trend entirely and get cut.
Tentative long if we bounce here. If there is no bounce we may be seeing just the start of a natural gas bear run.

Natural Gas "Historical Evidence discovered"Yep. The title says it all. I have found evidence to support what I believe is future upward price movement over the next 2 months. After many many hours of exhaustive research, I can say with 100% certainty, backed up by years and years of historical data that......IT GETS COLD IN THE WINTER! Just some light humor.
So I have two price targets for this upward move. This is not to be confused with what I think is going to happen by February (a much higher high at least $4.10), I'm talking short term...2 weeks from now before a decent pullback. The first is for Natural gas to reach the 100% measured move of "W" at $3.30, which happened in the beginning of November. There is a pretty good resistance level there as well. The 2nd price target, which is what I am hoping for and which makes a little more sense to me, is the 100% measured move of the first part of this current "Y" wave that began last week. That is the FIB that is colored purple. There is a gap to be filled there AND, a 50% typical correction for this WXY wave move would bring it down to retest the trend line and also stay within the yellow path.
As far as how this would equate to UGAZ prices.....I really don't know yet. I watch the NG chart to get an idea of when we are close to a trend change for UGAZ. I will be watching the structure on the daily to try to figure out where we are in the wave count and weather or not we are close to a warm weather reversal. GL
