VIX !VIX — Gap Filled
The April 7 gap has been closed following the spike into the 22–24 zone.
Price has since rejected that area and is now around 19.41.
Next objective: liquidity sweep around 16.50–16.70.
Further levels below: 15.67, 15.08, 14.41 and 13.46.
The immediate focus is the move toward lower liquidity.
Follow, Boost, Join, Thank You!
Financial Disclaimer: This post is not financial advice. I am not your financial advisor, your life coach, or your legally responsible adult. Always d
Vixindex
VIX – Calm Before the Storm? Fear Eyes a Return to 22
The VIX remains under pressure, but support around 15 is holding. A volatility rebound is developing; buyers still need confirmation.
📊 Technical analysis
The daily chart shows descending resistance pressing towards horizontal support at 15—a tightening descending triangle.
At 15.89, the VIX sits just below the blue SMA at 15.95 and black SMA at 18.05. A break above descending resistance, followed by reclaiming 18.05 and 20, would strengthen the rebound case.
🎯 Target: 22 VIX points
Cond
SPY/SPX Expected Move High Tagged - Landed Right Above ZoneKey Level: 750.98 (EM high — tagged and initially rejected intraday -- closed just above PDH at 751.28, just overhead.
Closed just beyond the band — SPY finished at 751.28, overhead the EM high at 750.98 and Friday's high at 751.31 after the morning tag and intraday rejection. The level shaped the session, but it's a range, not a wall.
Acceptance above both levels is the open question into tomorrow.
— Janice
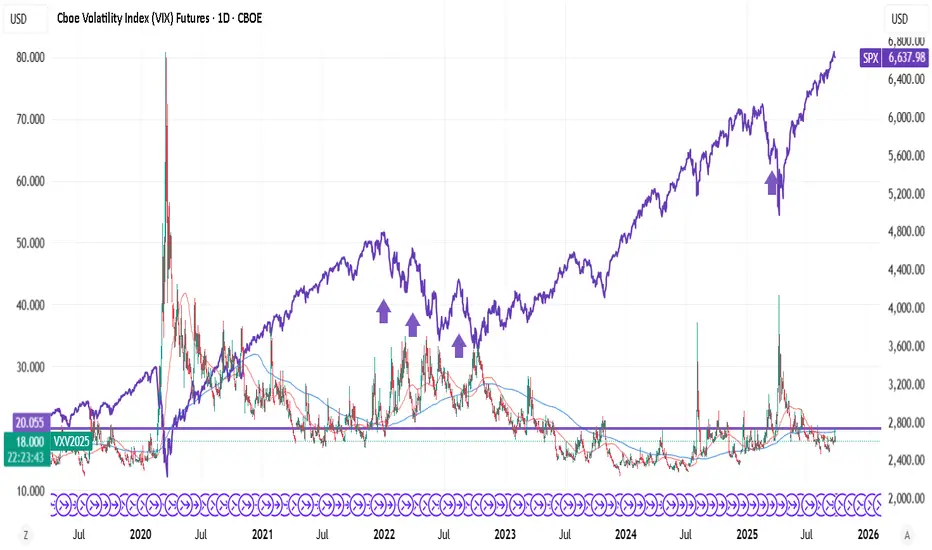
VIX Bullish BoS: Why the S&P 500 and Nasdaq could be at RiskThe VIX has officially signaled a bullish break of structure, and the implications for the S&P 500 and Nasdaq are significant. In this technical breakdown, we analyze why the "fear gauge" holding above the Volume Profile Point of Control (POC) could trigger a heavy sell-off in equities while potentially keeping Gold supported.
Most retail traders ignore volatility benchmarks until it's too late. I prefer to use the VIX as a leading indicator for market bias. I am currently monitoring a specific
V
VIX Hits CRITICAL Support: Is the S&P 500 About to Crash?The macro narrative heading into this week has been dominated by a sharp pivot toward a risk-off regime, as crude oil's surge past $100 and escalating tensions in the Middle East have reignited the "fear gauge" 🏦. While we’ve spent much of early 2026 in a complacent drift, market chatter suggests that the "oblivious threat" outlook is finally correcting. Retail sentiment across various forums is leaning heavily toward a "buy the dip" mentality in equities, which typically serves as the perfect f
V
VIX Signals Rising Market Risk — Swing Trade Focus!📈 VIX Volatility Index — Swing Trade Bullish Setup 🚨
Asset: VIX Volatility Index (Fear Gauge)
Market Type: Index
Trading Style: Swing Trade
🧠 Trade Plan — Bullish Bias
Strategy: Thief Layering Method (Multiple Limit Order Entries)
🔹 Entry Plan
Layered buy-limit approach to capture volatility expansion from value zones.
🟦 Buy Limit Layers:
• 14.50
• 15.00
• 15.50
👉 You may increase or adjust layers based on your own risk appetite and capital size.
📌 Why Layering Works on VIX?
Volatility ofte
I told you so....VIX is the golden goose! All this fake pump in the market was just not sustainable. It is very clear that there are holes and the money printing can't last forever. The S&P fake pumps, and artificial tariffs (which Americans pay 90%) are created out of thin air. The reality is that defaults are very high across the board for most debt classes, VIX is at a YEAR LOW (doesn't happen to often, signaling massive complacency), and now the song will end and all the retailers will be holding the bag! Learn how to trade the VIX!
VIX Breakout: Forex Traders, Buckle Up for Volatility!🚨 VIX Surge: What Currency Traders Need to Know Right Now 🌪️💱
📊 Chart Context & Technicals:
The recent breakout in the VIX signals a major shift in global risk sentiment! 📈 The index has leapt off its base, showing markets are bracing for uncertainty. For forex traders, this is a flashing signal: volatility in equities often spills over into FX, amplifying moves in major pairs and risk-sensitive crosses. ⚡️
🌍 Geopolitical & Macro Backdrop:
This VIX spike is fueled by President Trump’s aggressi
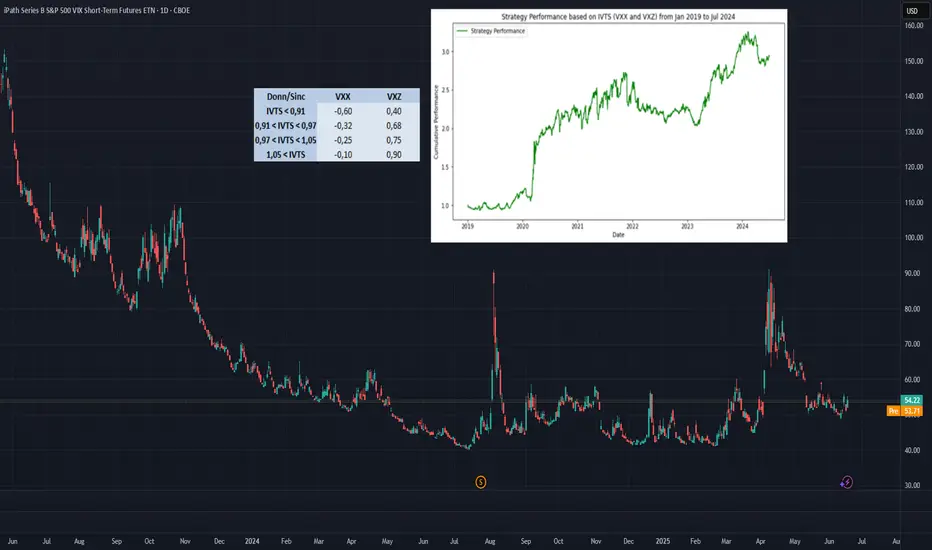
Trading the VIX – Part 2Trading the VIX – Part 2: VIX ETPs and Strategic Applications
In Part 1 of this series, we explored the structure of VIX Futures, focusing on the roll-down effect in a contango VIX futures curve—common in calm market conditions.
In Part 2, we turn our attention to VIX-related Exchange-Traded Products (ETPs)—specifically, the popular and liquid:
• VXX – unleveraged long VIX ETP
• UVXY – leveraged long VIX ETP
• SVXY – inverse VIX ETP
Each of these products is based on a specific VIX fut
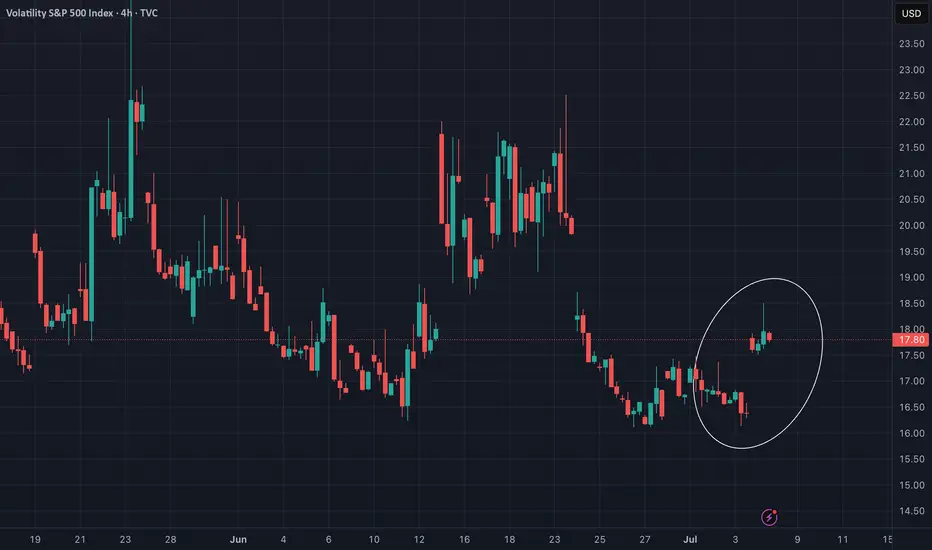
Market Open: VXX Pops...This morning, the VIX popped to $19.26, not seeing levels like this since the Jan. 27th, 2025 jump to $19.93, where the SPY saw an almost 3% drop, NASDAQ dropped 5%.
We saw concerns of heightened market uncertainty, with investors weighing robust consumer spending against mixed economic signals. There were murmurs that the subdued durable goods orders and emerging signs of slowing GDP growth might signal that the current momentum is hard to sustain. Additionally, dovish cues from the Fed—which
V
VIX is dying and the markets are flying!TVC:VIX NASDAQ:QQQ AMEX:SPY
Do you see now!👀
Yesterday I posted about the TVC:VIX making a bear flag pattern and showed you what's happened the last two times!
The VIX is dying and the markets are flying! The TVC:VIX has a lot more room to the downside as well.
You know what that means! 🚀
Countdown to Mega Volatility?#vix #volatilityindex has been declined 2 times after 5th August top. The last declination was at US elections day. Now, it' s clearly seen that TVC:VIX has broke out the trendline resistance for 4 months!. With retest or without retest if this #vixindex is not a fake out, then a great volatility is expected in nearly all markets in short / mid term. A pump in index will surely damage nearly all markets. Avoiding high risky positions is recommended.
Bitcoin vs. SPY: A Comparative AnalysisIn the ever-evolving world of finance, Bitcoin (BTC) continues to make headlines as a disruptive force in the global economy. As of August 10, 2024, a comparative analysis between Bitcoin (BTC/USD) and the SPDR S&P 500 ETF Trust (SPY) reveals fascinating insights into how the world's leading cryptocurrency stacks up against a traditional benchmark of the U.S. stock market.
The Weekly Chart: A Long-Term Perspective
The weekly chart for Bitcoin (BTC/USD) from Coinbase, as seen on TradingView,
$VIX 's strong chart indicates an incoming volatility#vix volatility index chart made double bottom and W bounced. The bullish movement will likely continue even more while the chart made bullish flag in lower time frame.
Also recent days #dxy dollar index chart made a bullish breakout and while VIX and TVC:DXY are both getting stronger, this will not likely be good for #btc #altcoins #stocks etc. I think something is cooking... Better not to be over greedy. Not financial advice.
VIX UPDATEAttention Wolfy Traders: Please be advised that our VIX index is currently decreasing. This indicates that there are brave traders in the market who are not afraid of risk. As a result, the price action in every chart can be fast and volatile. Therefore, it is important to keep this in mind and exercise caution when making trades."
PLAY PRO
Observing VIXNow a lot of people are posting long ideas that it will blow up.
I am framing this idea as neutral.
Since we have a contradiction.
Consider.
1. The Heikin Ashi weekly candle is consolidating by breaking through a bullish wedge. Yes, it is definitely a very reversal pattern.
2. Two small Kumo clouds (both red and green) are floating over candles. Their size tells us that we don't have much resistance at this level. The Tenkan and Kijun lines are below the clouds, but that's not that important i