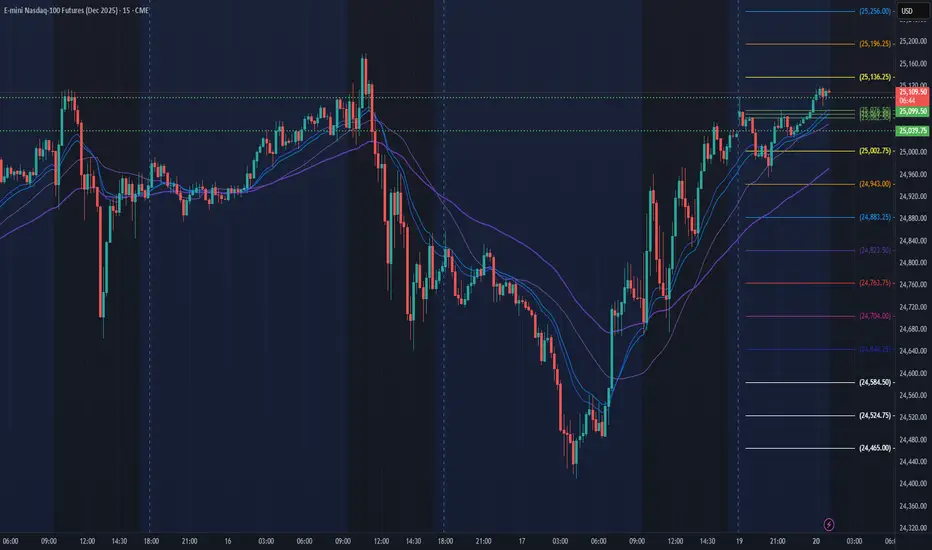
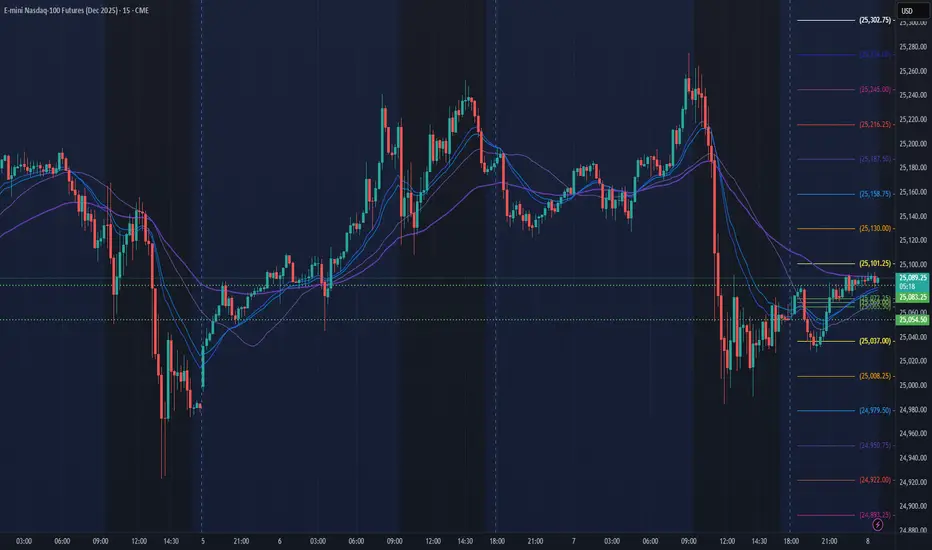
NQ Power Range Report with FIB Ext - 10/20/2025 SessionCME_MINI:NQZ2025
- PR High: 25099.25
- PR Low: 25039.75
- NZ Spread: 133.0
No key scheduled economic events
Session Open Stats (As of 12:45 AM)
- Session Open ATR: 391.21
- Volume: 43K
- Open Int: 283K
- Trend Grade: Long
- From BA ATH: -1.1% (Rounded)
Key Levels (Rounded - Think of these as ranges)
- Long: 26020
- Mid: 23571
- Short: 21939
Keep in mind this is not speculation or a prediction. Only a report of the Power Range with Fib extensions for target hunting. Do your DD! You determine your risk tolerance. You are fully capable of making your own decisions.
BA: Back Adjusted
BuZ/BeZ: Bull Zone / Bear Zone
NZ: Neutral Zone
Volatility
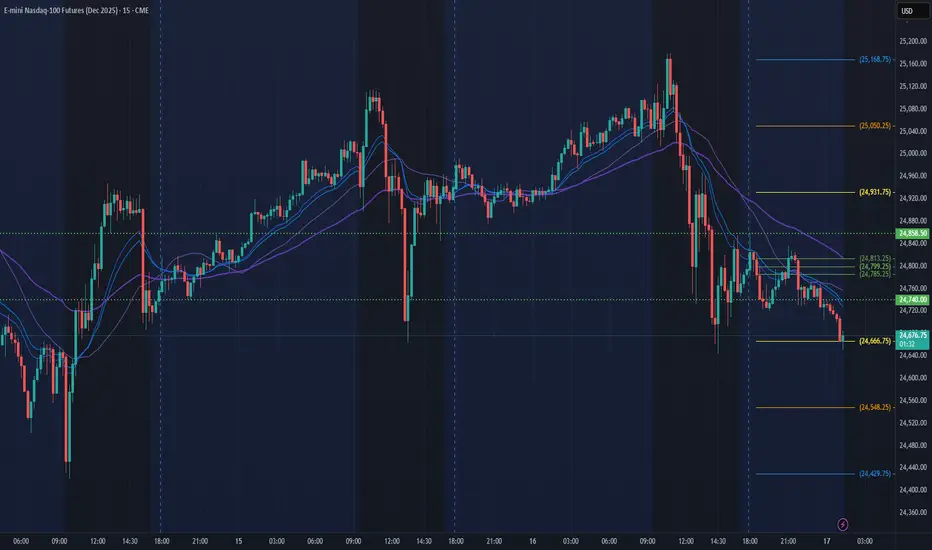
NQ Power Range Report with FIB Ext - 10/17/2025 SessionCME_MINI:NQZ2025
- PR High: 24858.50
- PR Low: 24740.25
- NZ Spread: 263.5
Key scheduled economic events:
08:30 | Nonfarm Payrolls
- Average Hourly Earnings
- Unemployment Rate
Session Open Stats (As of 12:45 AM)
- Session Open ATR: 391.21
- Volume: 43K
- Open Int: 283K
- Trend Grade: Long
- From BA ATH: -2.7% (Rounded)
Key Levels (Rounded - Think of these as ranges)
- Long: 26020
- Mid: 23571
- Short: 21939
Keep in mind this is not speculation or a prediction. Only a report of the Power Range with Fib extensions for target hunting. Do your DD! You determine your risk tolerance. You are fully capable of making your own decisions.
BA: Back Adjusted
BuZ/BeZ: Bull Zone / Bear Zone
NZ: Neutral Zone
GBPUSD – Experiencing a Painful Short Tem SqueezeIt has been a difficult past 7 days for GBPUSD traders. First, prices broke below 1.3320 last Thursday, a level that had held on previous sell offs since the start of September and it looked as though sentiment had turned down, backed up by concerns surrounding the sustainability of UK government debt, flatlining growth to start Q3 and uncertainty regarding the tough decisions the UK Chancellor may have to make regarding spending cuts and/or tax increases in her much anticipated Autumn budget (November 26th). This was all at a time when the US dollar (USD) faced a resurgence after stale underperforming short positions were cut back.
The GBPUSD sell off looked to be further cemented on Tuesday by UK employment data which showed private sector wage growth to be slowing faster than expected, leading markets to price in a greater probability of Bank of England (BoE) rate cuts in early 2026, a move which sent GBPUSD prices down to a 3-month low at 1.3248 on Tuesday. All good for the shorts so far!
At this stage all looked set for the drop to accelerate to even lower levels but then suddenly in stepped Federal Reserve Chairman Jerome Powell, who in a speech on Tuesday evening indicated increased policymaker concerns regarding a slowdown in the US labour market, which reinvigorated investor hopes that the US central bank could be ready to cut interest rates again 25bps (0.25%) at their next meeting on October 29th. This sent the dollar lower, which in turn saw GBPUSD move all the way back up to a potential short-term resistance at 1.3420 (more on this in technical update below) this morning as traders were forced to cut weak short positions, or face the possibility of an extended squeeze.
Looking forward, the environment into the weekend may remain challenging, with traders awaiting the outcome of important inflation data in the UK next Wednesday (CPI, 0700 BST Oct 22nd) and the US on Friday (CPI, 1330 BST Oct 24th), and this could mean the technical outlook may take on more significance.
Technical Update: Focus on Long Term Support Range
Since mid-April 2025, GBPUSD has traded within a broad, choppy sideways price range. Upside attempts have stalled at 1.3789, the July 1st failure high, while the downside has been contained by a support range marked by 1.3118, the 61.8% retracement of the April 7th to July 1st rally and 1.3140, the low from both May 12th and August 1st.
In this type of environment it can be helpful to identify and monitor potential important support and resistance levels that may influence where GBPUSD price activity could move next.
Possible Resistance Levels:
While a closing break above 1.3789, the July 1st high may be needed to suggest a breakout from the current broader range, breaks of shorter-term resistance levels if seen, could still trigger a phase of price strength. These interim levels may warrant attention in the sessions ahead.
Attempts to push higher in late September and early October were capped by the falling Bollinger mid-average, which stands at 1.3420, and is currently being tested at the time of writing (0700 BST). With the average still declining, this level may now act as an initial resistance again.
Following the price recovery so far this week, closing breaks above 1.3420, while not an outright positive, could lead to renewed attempts at price strength and see tests of potential resistance at 1.3527, the October extreme, even 1.3726, the September 17th failure high. That said, if as suspected, GBPUSD remains within a broad sideways range, it might well take a closing break above the 1.3789 high to suggest more sustained upside attempts.
Potential Support Levels:
With a rally emerging from Tuesday’s 1.3248 low, this level may now act as an initial support in the near term.
If closing breaks below 1.3248 were to emerge in upcoming sessions, this could renew pressure on the 1.3118/40 support band, the key zone that has repeatedly contained prior declines within the broader sideways range. Monitoring the closing defence of 1.3118/40 might prove to be important moving into next week.
Should 1.3118/40 give way on a closing basis, it may lead to increasing downside momentum, with some traders then viewing the 1.2708 April 7th low as the next potential main support level.
The material provided here has not been prepared accordance with legal requirements designed to promote the independence of investment research and as such is considered to be a marketing communication. Whilst it is not subject to any prohibition on dealing ahead of the dissemination of investment research, we will not seek to take any advantage before providing it to our clients.
Pepperstone doesn’t represent that the material provided here is accurate, current or complete, and therefore shouldn’t be relied upon as such. The information, whether from a third party or not, isn’t to be considered as a recommendation; or an offer to buy or sell; or the solicitation of an offer to buy or sell any security, financial product or instrument; or to participate in any particular trading strategy. It does not take into account readers’ financial situation or investment objectives. We advise any readers of this content to seek their own advice. Without the approval of Pepperstone, reproduction or redistribution of this information isn’t permitted.

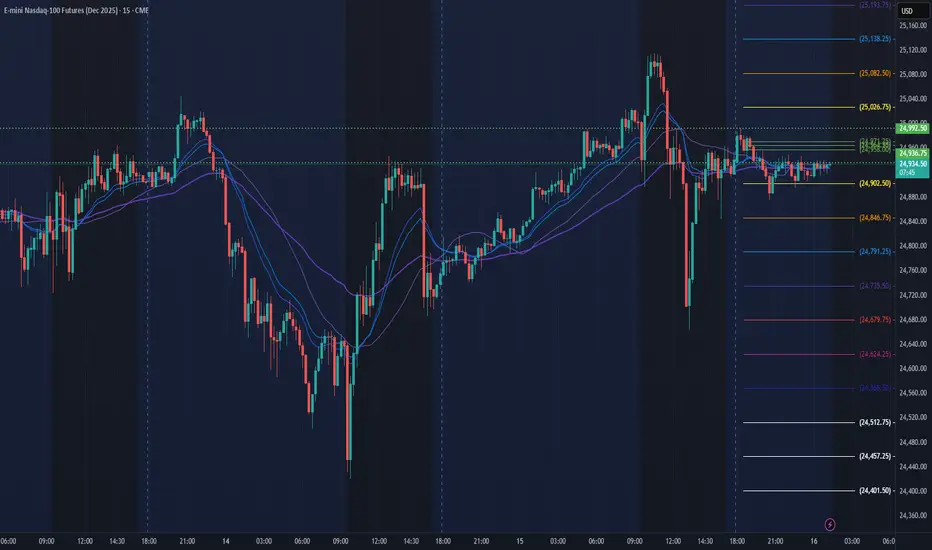
NQ Power Range Report with FIB Ext - 10/16/2025 SessionCME_MINI:NQZ2025
- PR High: 24992.25
- PR Low: 24936.50
- NZ Spread: 124.75
Key scheduled economic events:
08:30 | Initial Jobless Claims
- Retail Sales (Core|MoM)
- Philadelphia Fed Manufacturing Index
- PPI
AMP margins temp raised for pre-RTH expected economic volatility
Session Open Stats (As of 12:55 AM)
- Session Open ATR: 379.49
- Volume: 30K
- Open Int: 281K
- Trend Grade: Long
- From BA ATH: -1.8% (Rounded)
Key Levels (Rounded - Think of these as ranges)
- Long: 26020
- Mid: 23571
- Short: 21939
Keep in mind this is not speculation or a prediction. Only a report of the Power Range with Fib extensions for target hunting. Do your DD! You determine your risk tolerance. You are fully capable of making your own decisions.
BA: Back Adjusted
BuZ/BeZ: Bull Zone / Bear Zone
NZ: Neutral Zone
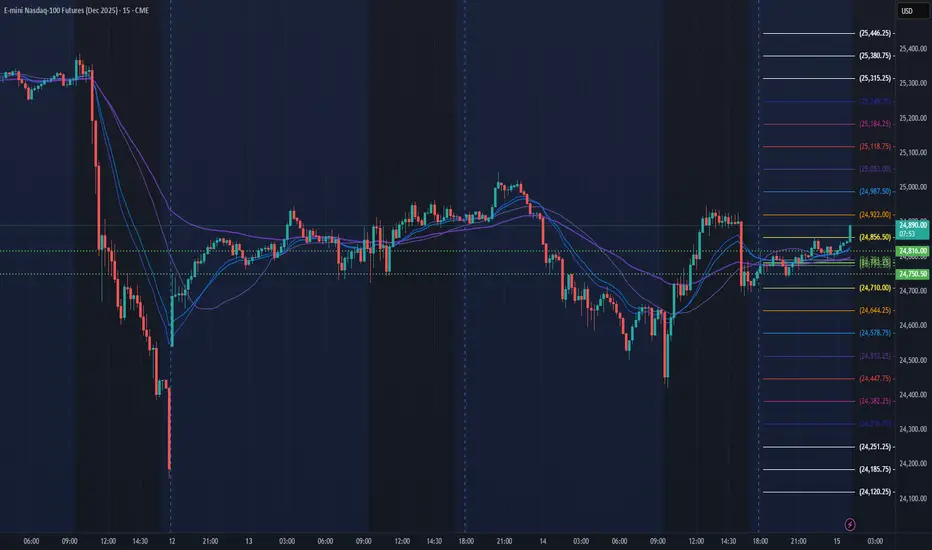
NQ Power Range Report with FIB Ext - 10/15/2025 SessionCME_MINI:NQZ2025
- PR High: 24816.25
- PR Low: 24750.50
- NZ Spread: 147.0
CPI rescheduled to Friday per AMP Futures update
Session Open Stats (As of 12:15 AM)
- Session Open ATR: 375.60
- Volume: 30K
- Open Int: 279K
- Trend Grade: Long
- From BA ATH: -2.4% (Rounded)
Key Levels (Rounded - Think of these as ranges)
- Long: 26020
- Mid: 23571
- Short: 21939
Keep in mind this is not speculation or a prediction. Only a report of the Power Range with Fib extensions for target hunting. Do your DD! You determine your risk tolerance. You are fully capable of making your own decisions.
BA: Back Adjusted
BuZ/BeZ: Bull Zone / Bear Zone
NZ: Neutral Zone
Silver – Record Highs and Increased Volatility to Contend WithSilver has literally jumped to the forefront of commodity market traders’ screens in October as it has soared to record highs, followed by an increased period of volatility, before then moving to even higher levels again this morning. The main reasons seem to be Silver’s attraction as an alternative to Gold as a safe haven/debasement asset in this current period of uncertainty.
Traders are concerned about increased trade tensions, a prolonged US government shutdown, weaker global growth, excessive levels of government debt, inflation, a war in Ukraine and what the Federal Reserve may do next regarding interest rates. It is quite an extensive list!
Add to this a historic physical shortage of Silver, soaring borrowing costs and reduced liquidity in a market that is much smaller than its big brother, Gold, and you have a recipe for a volatile asset that is not to be entered without strong risk management, a good understanding of the fundamentals and a serious consideration of important technical levels.
Silver started the month at 46.647, dipped to a low of 45.903 on October 2nd and then hasn’t looked back, posting a series of new multi-year and then record highs all the way to a peak this morning at 53.50. However, it hasn’t been plain sailing, with an average 5% trading range over the last three days alone. An important risk factor to consider.
Looking forward across this week, Silver prices could be influenced by the next headlines outlining where the direction of trade tensions between the US and China are moving, including updates on whether President’s Trump and Xi will meet later this month as had been originally planned. Their first meeting for 6 years.
Progress updates on the stalemate between Democrats and Republicans that has forced the US government into a 2 week shutdown may also be relevant, alongside any easing in the current supply issues in the physical Silver market.
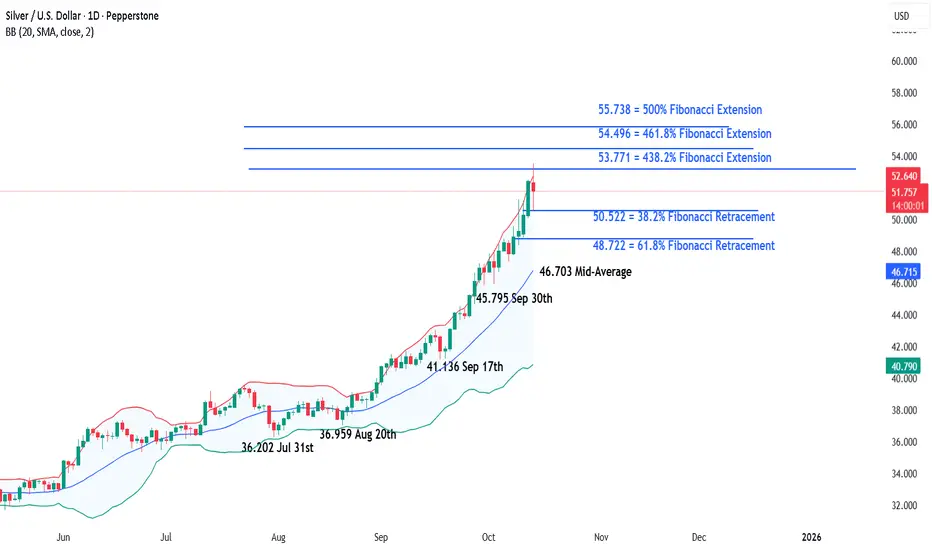
Technical Update: The Push Higher Continues:
It should always be remembered that traditional overbought signals are sometimes ignored while trending and sentiment measures remain strong. It’s a reminder that indicators like RSI or stochastics may flash caution, but price can continue to move higher if broader conditions support it.
Silver has defied overbought readings of late with a near-uninterrupted rally since the August lows. Despite repeated calls from some for a correction, price action has remained resilient, underscoring how strong trend and sentiment can override traditional ‘overbought’ conditions.
So, what are the tools that might be used to gauge the trending and sentiment condition of Silver’s recent moves?
From a sentiment standpoint, the chart above shows a bias toward larger, more frequent green positive candles, indicating consistent buying interest. Traders appear willing to pay higher prices despite the extended rally, which reflects positive sentiment. This pattern suggests confidence in the trend, with dips being viewed as opportunities rather than warnings.
From a trending perspective, Bollinger Bands have shown price remains above the rising mid-average, frequently touching the upper band, while the bands themselves are widening. This combination reflects upward momentum and positive price volatility, maintaining a constructive backdrop.
Silver’s current setup might suggest attempts at further price strength, but it’s no guarantee of continuation. Positive candles and price action above the rising mid-average, alongside widening Bollinger Bands may point to momentum behind the current move, but traders must also stay alert, watching candlestick signals and Bollinger band activity to assess the current trends sustainability.
This backdrop can of course shift quickly, so tracking key support and resistance levels is also vital to help spot possible emerging directional themes.
Possible Resistance Levels: .
The 53.771 level, marking the 438.2% Fibonacci extension, may now act as a key resistance point. So far, Tuesday’s push into new highs has stayed below this level on a closing basis, suggesting it might slow further upside and potentially ease the prevailing bullish trend and sentiment.
Monitoring how this 53.771 resistance level is defended on a closing basis may prove important this week. A sustained break above it could result in further attempts at upside toward 54.496, the 461.8% extension, even potentially 55.738, a level equal to the 500% extension.
Possible Support Levels:
Throughout the August to October advance, pullbacks have been shallow, typically lasting just one or two sessions, before buyers reasserted control. This pattern currently suggests that near-term weakness may continue to prove limited.
To suggest potential of a possible shift in trend, closing breaks below support levels would likely be required, marking a possible transition from short-term dips to the potential of a corrective phase in price.
The first support may be at 50.522, which is the 38.2% retracement. A close below this level could suggest a deeper correction risk, shifting trader focus toward 48.722, the 61.8% Fibonacci retracement and potentially even 46.703, which is equal to the rising Bollinger mid-average.
The material provided here has not been prepared accordance with legal requirements designed to promote the independence of investment research and as such is considered to be a marketing communication. Whilst it is not subject to any prohibition on dealing ahead of the dissemination of investment research, we will not seek to take any advantage before providing it to our clients.
Pepperstone doesn’t represent that the material provided here is accurate, current or complete, and therefore shouldn’t be relied upon as such. The information, whether from a third party or not, isn’t to be considered as a recommendation; or an offer to buy or sell; or the solicitation of an offer to buy or sell any security, financial product or instrument; or to participate in any particular trading strategy. It does not take into account readers’ financial situation or investment objectives. We advise any readers of this content to seek their own advice. Without the approval of Pepperstone, reproduction or redistribution of this information isn’t permitted.
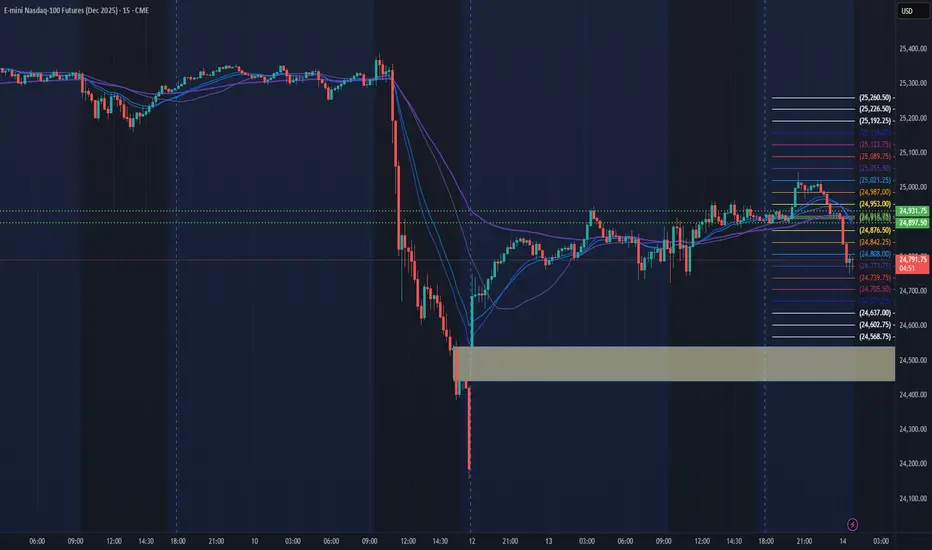
NQ Power Range Report with FIB Ext - 10/14/2025 SessionCME_MINI:NQZ2025
- PR High: 24931.50
- PR Low: 24897.00
- NZ Spread: 77.0
Key scheduled economic events:
12:20 | Fed Chair Powell Speaks
Session Open Stats (As of 12:15 AM)
- Session Open ATR: 370.72
- Volume: 45K
- Open Int: 277K
- Trend Grade: Long
- From BA ATH: -2.4% (Rounded)
Key Levels (Rounded - Think of these as ranges)
- Long: 26020
- Mid: 23571
- Short: 21939
Keep in mind this is not speculation or a prediction. Only a report of the Power Range with Fib extensions for target hunting. Do your DD! You determine your risk tolerance. You are fully capable of making your own decisions.
BA: Back Adjusted
BuZ/BeZ: Bull Zone / Bear Zone
NZ: Neutral Zone
Bitcoin Volatility Spikes to 65% on FridayAfter almost a year of unusually calm trading, Bitcoin’s implied volatility finally woke up.
On Friday, the DVOL Index surged from ~35% to a peak of 65%, marking the sharpest move since early 2023.
Volatility has now cooled down to 43%, but these spikes rarely happen in isolation.
Historically, sharp increases in volatility often precede the formation of a major low or a new market top, a transition point where trends tend to shift.

US 500 Index – Limited Correction Or Sentiment Reversal?With all the talk in the financial press last week of a potential AI bubble, soaring volatility in the precious metals market, and an on-going US government shutdown, perhaps it was understandable that traders were a little on edge going into Friday. So, when President Trump’s new threats of 100% tariffs on China were posted on social media late in the afternoon the reaction was a big downside correction, which saw the US 500 drop around 3.6% from its all-time highs of 6769 seen just a day earlier to a low of 6508.
Since then, comments from President Trump and Vice President Vance over the weekend regarding China have seemed to be more conciliatory in tone, signalling an openness to get back to the negotiating table and hammer out a deal in some form. This has seen all markets breath a small sigh of relief and led the US 500 to open higher, currently trading up 2.2% around 6650 (0800 BST). However, whether this positivity continues may depend on multiple factors, including the technical outlook (more on this below).
While trader sensitivity to the next round of comments from the US and Chinese administrations regarding the on-going trade tensions could remain high, they may also be keen to receive the latest Q3 earnings from the major US banks, with JP Morgan, Goldman Sachs and Citigroup reporting on Tuesday (before the open), then Bank of America and Morgan Stanley reporting on Wednesday (before the open). While the focus may be on assessing actual performance against expectations, it could also be important to hear the outlook for future revenue, the direction of US economic growth and the size of bad debt provisions.
Federal Reserve Chairman Jerome Powell also speaks on Tuesday at 1720 BST and with the US government shutdown delaying the release of the most recent inflation updates (CPI/PPI) which were due this week until later in October, any comments he makes regarding the inflation outlook or the potential for an October Fed rate cut could take on extra significance.
Technical Update: Limited Correction or Sentiment Reversal?
Headline-driven price sell-offs like the one experienced on Friday (Oct 10th) are unpredictable, underscoring the importance of disciplined risk management. If you're long of an asset during such volatility, having well-placed stop-losses is crucial to limit downside exposure, especially when liquidity starts to reduce, as it likely did ahead of today’s US holiday. These events serve as a reminder that protecting your trading capital is just as important as delivering profitable outcomes.
After such a sharp sell-off, the question is whether it marks a brief, exaggerated correction within a broader uptrend or signals a deeper negative sentiment shift that could lead to further price weakness.
The answer may well depend on how the price of the US 500 reacts in the upcoming sessions. Whether support levels hold, momentum stabilises, and buyers return or whether the price decline deepens and the next support levels give way.
The jury may still be out on this, but as the chart above shows, judging the potential key support and resistance levels could help gauge the next directional risks. A closing break of either side may offer signals to the next phase of price activity.
If the Sell-Off Reflects a Negative Sentiment Shift:
Friday’s sharp decline may have already breached some initial support levels, raising the risk of a more extended phase of price weakness.
The daily Bollinger mid-average (currently 6668) is typically viewed by traders as a support level in an uptrend and this level was broken on a closing basis within Friday’s decline. Despite this morning’s rally, 6668 could now act as a resistance, and if it remains intact, could keep upside activity in check for now.
While 6668 resistance holds on a closing basis, this morning’s recovery may be viewed by some as a reactionary bounce following Friday’s sharp decline, leaving possibilities of renewed selling pressure later in the week.
If this proves to be the case, closing breaks below potential support at 6550, a level which is equal to half the rebound from Friday’s low, might lead to renewed downside pressure. This may open tests of 6490, the 50% retracement of the August 1st to October 9th rally, with a closing break below this level, suggesting scope for moves toward 6224 which is the 61.8% retracement.
If the Sell-Off Proves to be a Limited Correction:
While Friday’s decline was sharper and larger than any since the June 2025 lows, traders may now be watching whether current price strength can close back above the 6668 Bollinger mid-average.
While not a guarantee of renewed price strength, past declines since June 23rd 2025, have seen US 500 prices recover to close back above this line, leading to resumed attempts at upside strength. A closing break back above 6668 may once again open attempts to push to higher levels.
If confirmed, a break above resistance at 6668 may lead to further upside back toward 6769, which is the October 9th all-time high. Should this level give way, further strength may extend toward 6866, which is the 38.2% Fibonacci extension of last week’s sharp decline.
The material provided here has not been prepared accordance with legal requirements designed to promote the independence of investment research and as such is considered to be a marketing communication. Whilst it is not subject to any prohibition on dealing ahead of the dissemination of investment research, we will not seek to take any advantage before providing it to our clients.
Pepperstone doesn’t represent that the material provided here is accurate, current or complete, and therefore shouldn’t be relied upon as such. The information, whether from a third party or not, isn’t to be considered as a recommendation; or an offer to buy or sell; or the solicitation of an offer to buy or sell any security, financial product or instrument; or to participate in any particular trading strategy. It does not take into account readers’ financial situation or investment objectives. We advise any readers of this content to seek their own advice. Without the approval of Pepperstone, reproduction or redistribution of this information isn’t permitted.

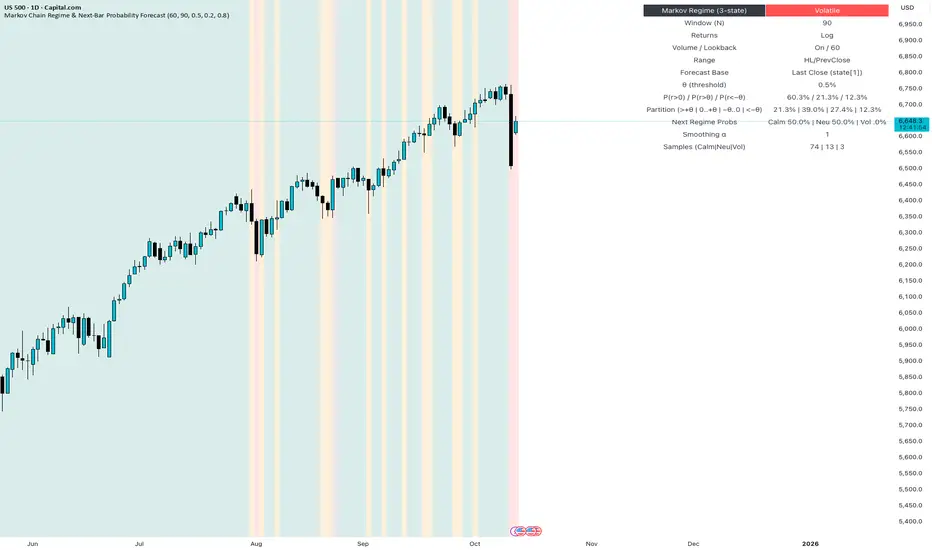
HOW-TO: Forecast Next-Bar Odds with Markov ProbCast🎯 Goal
In 5 minutes, you’ll add Markov ProbCast to a chart, calibrate the “big-move” threshold θ for your instrument/timeframe, and learn how to read the next-bar probabilities and regime signals
(🟩 Calm | 🟧 Neutral | 🟥 Volatile).
🧩 Add & basic setup
Open any chart and timeframe you trade.
Add Markov ProbCast — P(next-bar) Forecast Panel from the Public Library (search “Markov ProbCast”).
Inputs (recommended starting point):
• Returns: Log
• Include Volume (z-score): On (Lookback = 60)
• Include Range (HL/PrevClose): On
• Rolling window N (transitions): 90
• θ as percent: start at 0.5% (we’ll calibrate next)
• Freeze forecast at last close: On (stable readings)
• Display: leave plots/partition/samples On
📏 Calibrate θ (2-minute method)
Pick θ so the “>+θ” bucket truly flags meaningful bars for your market & timeframe. Try:
• If intraday majors / large caps: θ ≈ 0.2%–0.6% on 1–5m; 0.3%–0.8% on 15–60m.
• If high-vol crypto / small caps: θ ≈ 0.5%–1.5% on 1–5m; 0.8%–2.0% on 15–60m.
Then watch the Partition row for a day: if the “>+θ” bucket is almost never triggered, lower θ a bit; if it’s firing constantly, raise θ. Aim so “>+θ” captures move sizes you actually care about.
📖 Read the panel (what the numbers mean)
• P(next r > 0) : Directional tilt for the very next candle.
• P(next r > +θ) : Odds of a “big” upside move beyond your θ.
• P(next r < −θ) : Odds of a “big” downside move.
• Partition (>+θ | 0..+θ | −θ..0 | <−θ): Four buckets that ≈ sum to 100%.
• Next Regime Probs : Chance the market flips to 🟩 Calm / 🟧 Neutral / 🟥 Volatile next bar.
• Samples : How many historical next-bar examples fed each next-state estimate (confidence cue).
Note: Heavy calculations update on confirmed bars; with “Freeze” on, values won’t flicker intrabar.
📚 Two practical playbooks
Breakout prep
• Watch P(next r > +θ) trending up and staying elevated (e.g., > 25–35%).
• A rising Next Regime: Volatile probability supports expansion context.
• Combine with your trigger (structure break, session open, liquidity sweep).
Mean-reversion defense
• If already long and P(next r < −θ) lifts while Volatile odds rise, consider trimming size, widening stops, or waiting for a better setup.
• Mirror the logic for shorts when P(next r > +θ) lifts.
⚙️ Tuning & tips
• N=90 balances adaptivity and stability. For very fast regimes, try 60; for slower instruments, 120.
• Keep Freeze at close on for cleaner alerts/decisions.
• If Samples are small and values look jumpy, give it time (more bars) or increase N slightly.
🧠 Why this works (the math, briefly)
We learn a 3-state regime and its transition matrix A (A = P(Sₜ₊₁=j | Sₜ=i)), estimate next-bar event odds conditioned on the next state (e.g., q_gt(j)=P(rₜ₊₁>+θ | Sₜ₊₁=j)), then forecast by mixing:
P(event) = Σⱼ A · q(event | next=j).
Laplace/Beta smoothing, per-state sample gating, and unconditional fallbacks keep estimates robust.
❓FAQ
• Why do probabilities change across instruments/timeframes? Different volatility structure → different transitions and conditional odds.
• Why do I sometimes see “…” or NA? Not enough recent samples for a next-state; the tool falls back until data accumulate.
• Can I use it standalone? It’s a context/forecast panel—pair it with your entry/exit rules and risk management.
📣 Want more?
If you’d like an edition with alerts , σ-based θ, quantile regime cutoffs, and a compact ribbon—or a full strategy that uses these probabilities for entries, filters, and sizing—please Like this post and comment “Pro” or “Strategy”. Your feedback decides what we release next.
October 13 - October 17 2025I decided to go through and consolidate my charts this week to make for easier decision making. Friday’s sell off was a sign of weakness in a market that was already showing strain. While the drop on resumed trade war threats was swift, the rest of the market had a muted response. Heading into this week, we should see another big move and I will try to be open to trading either side depending on how this develops.
1. Macro
Gold is still in its uptrend and that is unlikely to change anytime soon. I don’t have it charted here, but Gold’s volatility index CBOE:GVZ spiked during Friday’s session, however buyers seemed to be absorbing the volatility since it still closed up over 1%. Gold has already made a new ATH today and I do not expect to see the trend change this week.
The dollar TVC:DXY seems to be near the top of its deviation from the flat EMA. I think we will see the dollar move lower which could boost Gold, Stocks, or both. Next, we saw TVC:US03MY remain relatively flat during Friday’s sell off while TVC:US10Y moved sharply lower during the session, making the TVC:US10Y -US03MY spread very tight once again. Since real yields are still edging up and the 3M bond stayed flat during the panic, that leads me to believe the bond market volatility was contained and may not be indicative of a true risk-off reaction.
One reason why US Treasuries will continue to catch a bid is that as forward inflation expectations continue to slide (bottom left chart), the real return is still attractive compared to bonds from other major countries. We’ll see if the renewed trade sparring will change the forward inflation exceptions trend since the data from TIPS is delayed, however for now I’ll continue to base my perception on what I’m currently seeing on the chart.
Lastly, Oil is continuing to see an average decline. Hopefully middle eastern peace efforts are successful, which could keep the price subdued. On the bottom chart I have combined the average of MCX:COPPER1! and Corn CBOT:ZC1! into a single line compared to TVC:DXY , which aims to show real demand (and/or inflation) pressure against the Dollar’s relative strength. Here we can see commodities took a hit on Friday but the trend is still very strong to the upside. Since forward inflation expectations are down and the dollar is flat, this may be pointing to the presence of real demand, which should be bullish for equities.
2. Risk
Even when looking at the past six months on a line chart, the pullback, Friday’s drop was significant. As I mentioned last week, there are important risk-health items to watch for here. I’m now just charting the High Yield OAS - Investment Grade OAS spread, which was already starting to move up before Friday’s sell off. This data is only reported once per day for the previous session, so the impact on corporate bond yields is not yet known. This will be very important to pay attention to, as it could signal true aversion to risk.
Next, the $ES1!/GOLD spread is declining and should continue until Gold enters a re-accumulation phase. Anyone’s guess when that will be so for now I think it’s safe to assume that Stocks will continue to underperform Gold, and if Friday’s drop was any indication of which side is in control, it serves as confirmation that stocks are sensitive to bad news. Buyers seem to be the ones getting absorbed.
The third chart on the top shows that although CME_MINI:NQ1! has been outperforming CBOT_MINI:YM1! since the market bottomed, the momentum seems to be stalling out. I’ll be looking at the sectors to find any further signs of sustained rotation.
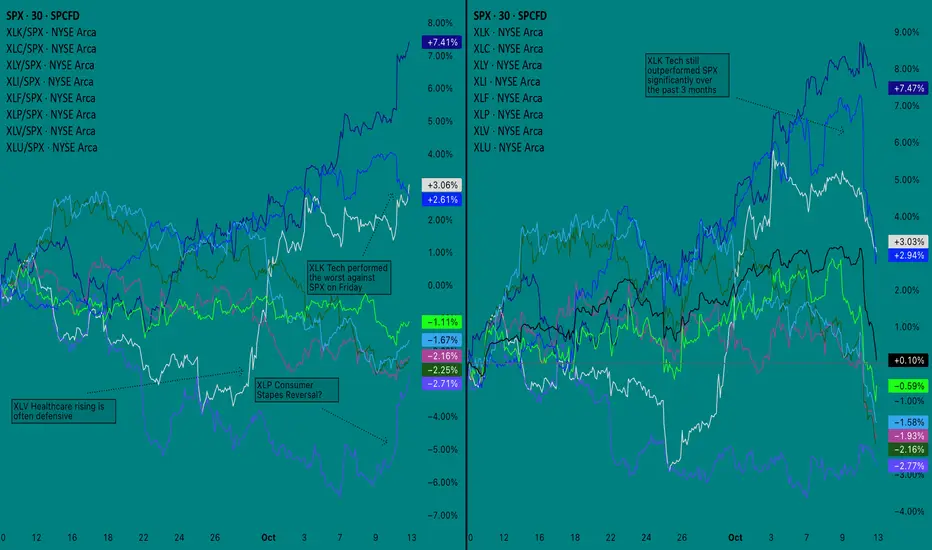
3. Sector Analysis
My notes are best explained in the screenshot but my comment is that most of the decline on Friday came from AMEX:XLK (Tech sector) selling off. Other sectors performed better against SPX, with AMEX:XLP (Consumer Staples) seemingly breaking out of a decline, however as you can see from the chart on the right, it has still been the worst performer against the other indices over the past three months.
One session is not enough to change the trend, however it will be important to watch for continued rotation out of tech and into other sectors. This could cause CME_MINI:NQ1! to decline against CBOT_MINI:YM1! as I suggested earlier, and would signal the market is positioning for a more sustained downturn - likely caused by disappointing growth.
4. Bias
This is the chart I have tried to condense the most. I have switched to just using Line Break as my main chart for ES, which I found performed better than Renko when combined with my other indicators. On the lefthand side, I am using Session CVD but got rid of my other indicators and made a CVD Momentum indicator, which tracks the momentum of CVD rising or falling over an anchor period (1 week). I’m still using a range chart calculation for this chart, currently set to 20R.
On the right, I am using what I’ll call my Volatility Dashboard, however it does not start producing a useful signal until premarket. Based on Volatility, it can be said with certainty that dealers went long on puts right before the sell-off began.
From a technical standpoint, the price was in a rising wedge and dumped after it made a higher high that did not reach the upper trend line. Rising channels are generally bullish, however the extent of Friday’s free fall could mean that even if the price quickly recovers, it may be forming a top similar to what we saw last December. This is why risk indicators like corporate bond spreads, sector performance, and changes to the macro structure will be important to monitor over the coming days.
—
Conclusion
For this week, all I can say with certainty is that I think there will be some good opportunities. Here is what I believe can be safely assessed from this analysis:
1. Stocks remain under pressure, however “smart money” will require more time to rotate out of tech, leading to repeated retests of the top of the range.
2. Tailwinds for stocks are potential real demand in agriculture and industrial material that is not impacting the market’s forward inflation expectation.
3. “Smart Money” will sell volatility (puts) into pullbacks if the price is set to be driven higher, or will do the opposite, buying volatility (puts) and selling calls on low volume rips
This is why I will be looking for more confirmation before taking a side, as the market’s goal now is to clear out liquidity. When it comes to the larger trend, I tend to think that stocks do not seem to be showing strength over the larger macro structure, however that does not necessarily dictate that the index will come down another 8%. Instead, I think at the very least we will stay in a flat range for the time being.
I do not think the market is ready to go on a bull run, nor do I think the environment is showing a risk-off bias that is strong enough to warrant stocks going straight down. If we meet resistance near the top of the range, I’ll look at volatility positioning and CVD for the signal to go short. Conversely, if we make a higher low I will go long on calls to the top of the range.
Good luck to all and thanks for reading!
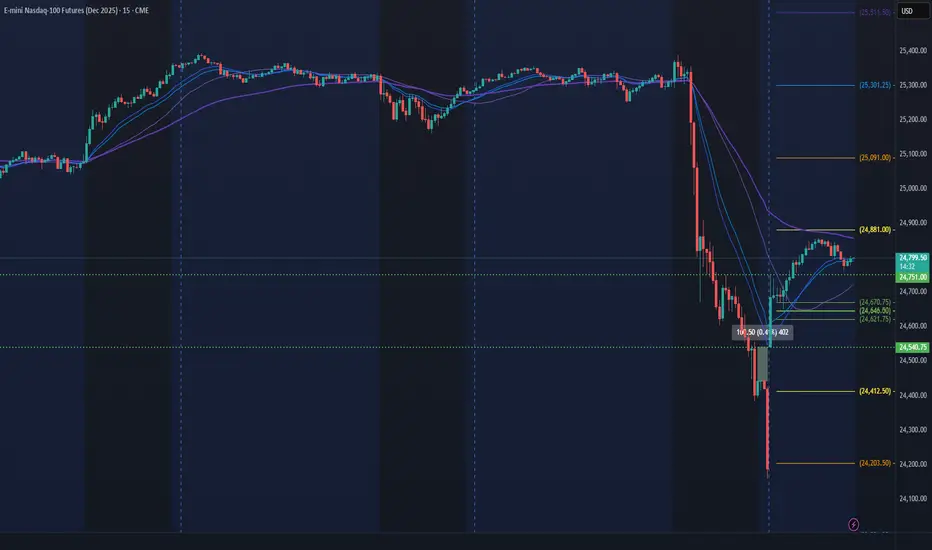
NQ Power Range Report with FIB Ext - 10/13/2025 SessionCME_MINI:NQZ2025
- PR High: 24752.25
- PR Low: 24541.75
- NZ Spread: 470.25
No key scheduled economic events
+0.4% weekend gap up retracing 50% of Friday's 892 point range
Session Open Stats (As of 12:15 AM)
- Session Open ATR: 370.30
- Volume: 75K
- Open Int: 284K
- Trend Grade: Long
- From BA ATH: -2.3% (Rounded)
Key Levels (Rounded - Think of these as ranges)
- Long: 26020
- Mid: 23571
- Short: 21939
Keep in mind this is not speculation or a prediction. Only a report of the Power Range with Fib extensions for target hunting. Do your DD! You determine your risk tolerance. You are fully capable of making your own decisions.
BA: Back Adjusted
BuZ/BeZ: Bull Zone / Bear Zone
NZ: Neutral Zone
BTCUSDT BULLISH -Was shocked when the market crashed; but its a good thing for me because the market completed a move that i thought that it would take a week or weeks.
-After the crash i looked for a neqw zone that i can enter as i saw that i missed the opportunity to enter when it touched the zone that i need.
-Im looking for a long position as ive seen a confirmation & im waiting for the push.
-Im looking for the market to go back to the entry zone & then push up.
-Lets see how this goes.

#BITCOIN ANALYSIS I have been warning you for the last 45 days #BITCOIN ANALYSIS
I have been warning you for the last 45 days that a big dump was coming and now it’s playing out exactly. Bitcoin has already dumped around $20K and is now trading near 112K, right at the major resistance zone that has triggered every big correction since 2018.
A small bounce to 115K–116K is possible, but after that I expect another leg down toward 100K, and potentially lower to 90K.
I’m still holding my 50% short position. If anything changes or I close my position, I’ll update you. Remember I mentioned earlier that if BTC went back to 125K–128K, I would add more shorts and that plan hasn’t changed.
Till Monday, I expect some volatility, but Monday’s price action will give a clearer direction.
🔸 Weekly:
BTC touched the long-term trendline again → clear rejection happened.
👉 Until we get a weekly close above 125K, the risk of a major pullback stays high.
BITSTAMP:BTCUSD
🔸 Daily:
Price is inside the 110K–125K supply zone. Structure is weak.
If price breaks and resists below 110K, then 100K is the next target.
📊 My Trade:
✅ First target 105K hit
Holding 50% shorts, expecting a bounce to 115K, then lower.
📌 Downside Targets: 105K ✅ → 100K → 95K → 90K

SOFI: Buyers in Control? Heading Toward $31?SOFI is showing strength as AVWAP and HVN hold as key support — a clear sign that buyers are in control. 📊
If momentum continues, we could see a push toward the $31 target zone in the coming weeks.
👉 What’s your take — breakout incoming or another retest of support first?
Based on :
- Fundamental analysis
- Avwap and HVN levels
- Quantitative analysis

NQ Power Range Report with FIB Ext - 10/10/2025 SessionCME_MINI:NQZ2025
- PR High: 25321.50
- PR Low: 25286.50
- NZ Spread: 78.5
Key scheduled economic events:
08:30 | Nonfarm Payrolls
- Average Hourly Earnings
- Unemployment Rate
Session Open Stats (As of 12:45 AM)
- Session Open ATR: 264.53
- Volume: 19K
- Open Int: 287K
- Trend Grade: Long
- From BA ATH: -0.2% (Rounded)
Key Levels (Rounded - Think of these as ranges)
- Long: 26020
- Mid: 23571
- Short: 21939
Keep in mind this is not speculation or a prediction. Only a report of the Power Range with Fib extensions for target hunting. Do your DD! You determine your risk tolerance. You are fully capable of making your own decisions.
BA: Back Adjusted
BuZ/BeZ: Bull Zone / Bear Zone
NZ: Neutral Zone
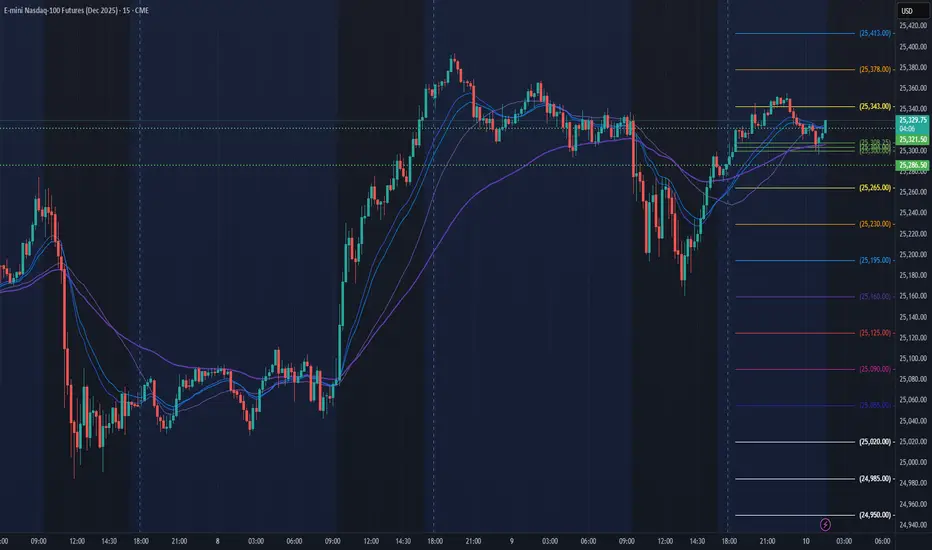
NQ Power Range Report with FIB Ext - 10/9/2025 SessionCME_MINI:NQZ2025
- PR High: 25369.50
- PR Low: 25340.50
- NZ Spread: 65.0
Key scheduled economic events:
08:30 | Initial Jobless Claims
- Fed Chair Powell Speaks
13:00 | 30-Year Bond Auction
Session Open Stats (As of 12:45 AM)
- Session Open ATR: 269.14
- Volume: 26K
- Open Int: 291K
- Trend Grade: Long
- From BA ATH: -0.2% (Rounded)
Key Levels (Rounded - Think of these as ranges)
- Long: 26020
- Mid: 23571
- Short: 21939
Keep in mind this is not speculation or a prediction. Only a report of the Power Range with Fib extensions for target hunting. Do your DD! You determine your risk tolerance. You are fully capable of making your own decisions.
BA: Back Adjusted
BuZ/BeZ: Bull Zone / Bear Zone
NZ: Neutral Zone
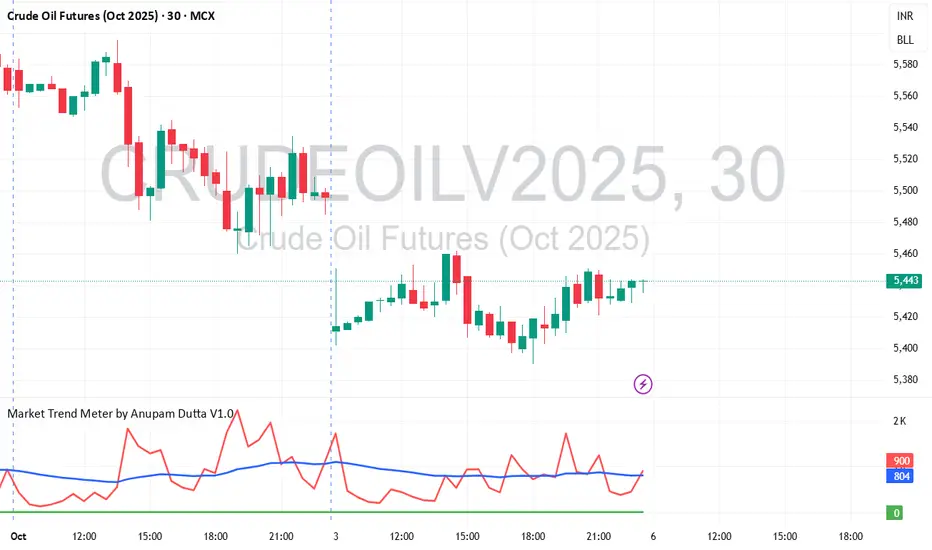
MCX Crude Oil Options (16th Oct Expiry)MCX Crude Oil Options (16th Oct Expiry)
Buy 5400 Call option only if price breaks above 188.60
Target: 208.60
Trade must activate tomorrow (6th Oct 2025), else the view is canceled.
Once activated, target remains valid till 15th Oct session.
📌 Disclaimer: This is a directional view, not a recommendation. Do your own analysis before taking any position.
#crudeoil
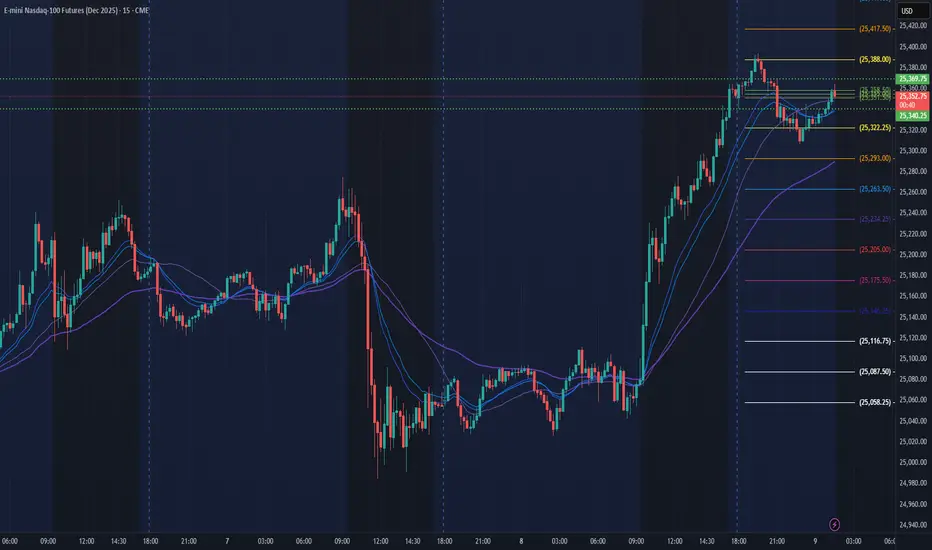
NQ Power Range Report with FIB Ext - 10/8/2025 SessionCME_MINI:NQZ2025
- PR High: 25083.25
- PR Low: 25054.50
- NZ Spread: 64.25
Key scheduled economic events:
13:00 | 10-Year Note Auction
15:00 | FOMC Meeting Minutes
Session Open Stats (As of 12:45 AM)
- Session Open ATR: 263.72
- Volume: 21K
- Open Int: 287K
- Trend Grade: Long
- From BA ATH: -0.9% (Rounded)
Key Levels (Rounded - Think of these as ranges)
- Long: 26020
- Mid: 23571
- Short: 21939
Keep in mind this is not speculation or a prediction. Only a report of the Power Range with Fib extensions for target hunting. Do your DD! You determine your risk tolerance. You are fully capable of making your own decisions.
BA: Back Adjusted
BuZ/BeZ: Bull Zone / Bear Zone
NZ: Neutral Zone
USDJPY — Bulls in Full Control: Is 152 Next?Bias: Bullish
Timeframe: 4H
1. Technical Overview
USDJPY continues its impressive upward momentum, breaking through several key resistance zones as the pair approaches the 151.00–152.00 psychological level — an area that historically triggered major reversals.
We’re currently witnessing a strong bullish structure supported by the 50 and 100 MA, both trending upward and providing dynamic support. The breakout above 150.00 marked a clear shift in market sentiment, confirming the dominance of buyers.
The next key resistance is located at 151.90–152.20, which was the peak of the last major rally before the Bank of Japan intervened earlier this year. A daily close above this level would open the door to 153.50–154.00, potentially signaling the start of a new medium-term uptrend.
___________________
2. Price Action Analysis
Support zone: 149.50–150.00 — previous resistance now acting as a pivot area.
Resistance zone: 151.90–152.20 — last major high and potential barrier before new highs.
Market structure: Clear sequence of Higher Highs and Higher Lows.
Momentum: Bullish volume expansion, confirming strong participation by institutional buyers.
Price is currently consolidating below the resistance area, forming a potential bullish flag pattern on the 4H chart. A breakout from this mini-structure would confirm continuation to the upside.
___________________
3. Fundamental Context
From a macro perspective, the divergence between Fed and BoJ policies continues to drive this pair upward.
The Federal Reserve maintains a restrictive stance as inflation data remains above target, keeping the USD supported.
The Bank of Japan, meanwhile, sticks to ultra-loose policy and continues yield-curve control, suppressing JPY strength.
Additionally, rising U.S. Treasury yields provide further tailwinds to USDJPY, while Japan’s inflation and wage growth data haven’t shown the strength needed to justify policy tightening.
Unless we see verbal intervention from BoJ officials or a sudden USD correction, the path of least resistance remains to the upside.
___________________
4. Trading Plan (For Reference Only)
Long entry: 150.80 – 151.00 (on retest or small pullback)
Target 1: 151.90
Target 2: 153.50
Stop loss: Below 150.00
Risk-reward ratio: 1:2.5
___________________
5. Summary
USDJPY remains fundamentally and technically bullish. The market shows no immediate signs of exhaustion, and all eyes are now on whether bulls can sustain momentum above the 152.00 threshold — a breakout that could accelerate the rally further.
As always, watch for BoJ rhetoric near these levels — it’s the only real wildcard that can disrupt the current trend.
___________________
Trade safe, plan your entries, and never fight the trend.
— Simon Weber | ICEBERG FOREX SIGNALS

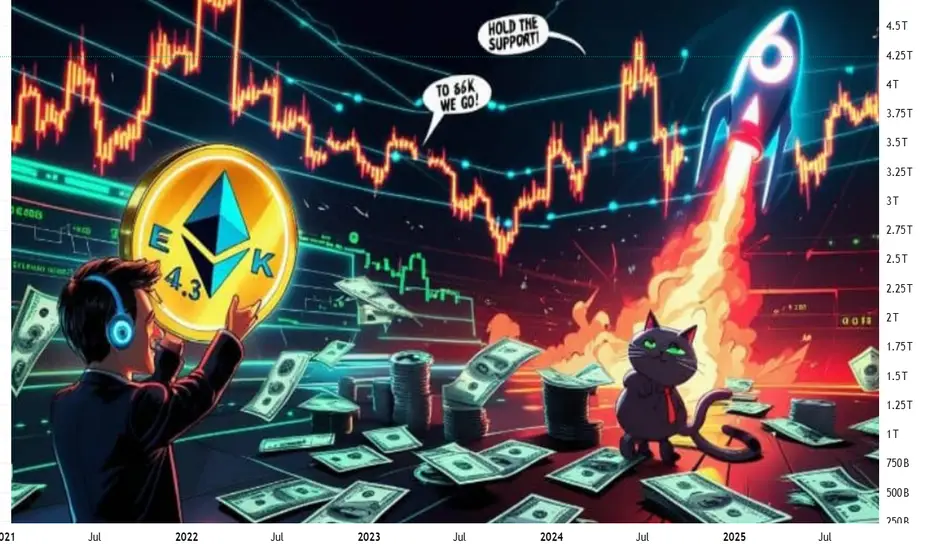
Ethereum Price Prediction: Samsung Staking and BitMine Treasury In October 2025, Ethereum (ETH) is poised for significant growth, driven by major catalysts like Samsung’s integration of ETH staking in Galaxy devices and BitMine Immersion’s massive treasury holdings. With ETH trading at $4,500 after a 23% rally, these developments signal strong demand, potentially pushing prices to $10,000 by year-end. Samsung’s partnership enables staking for over 200 million users, while BitMine’s 2.83 million ETH ($13.4 billion) underscores institutional confidence. This analysis explores these drivers, price predictions, and trading strategies for investors. Data as of October 7, 2025—position for ETH’s next surge.
Samsung Staking: Empowering 200M+ Users
Samsung’s integration with a major crypto platform allows Galaxy device owners in the US to stake ETH directly via a mobile wallet, offering zero trading fees and 5–7% APY. Targeting 200 million+ users, this feature simplifies staking, boosting retail adoption. Early data shows 75 million users gaining crypto access, with projected Q4 staking inflows of $500 million. This democratizes ETH participation, enhancing network security as the staking queue grows to 475,000 validators. The surge in retail staking could lift ETH prices by 10–15%, correlating 0.7 with Galaxy device sales.
BitMine Treasury: $13.4B ETH Holdings
BitMine Immersion Technologies holds 2.83 million ETH ($13.4 billion), the second-largest crypto treasury, with a recent $821 million purchase. Controlling 5% of ETH’s supply, BitMine’s strategy leverages immersion cooling for efficient mining and staking, signaling strong belief in Ethereum’s upgrades like Pectra. This reduces liquid supply, amplifying price sensitivity. Corporate treasuries, alongside $75.2 million net ETF inflows in September, support ETH’s price floor during corrections, with on-chain data showing a 15% increase in whale holdings.
Price Prediction for 2025: $4,685–$10,000
Analysts project ETH ranging from $4,685–$4,900 by mid-October, with bullish targets up to $10,000 on staking and treasury demand. Samsung’s 200M user base and BitMine’s holdings could drive a cup-and-handle breakout to $7,500. Futures open interest hit $61 billion, signaling momentum. Risks include regulatory delays or unstaking pressure (475,000 validators), potentially capping gains at $5,000. A 40% upside to $7,500 by Q4 is likely if adoption persists, with a 0.8 correlation to Nasdaq.
Trading Signals: RSI and MACD
Analysis uses RSI for momentum and MACD for trends, based on April 2025 uptrends:
ETH ($4,500): RSI at 58 (bullish above 55). Bullish MACD crossover (+0.15)—target $5,200 (15% upside). Fibonacci support at $4,200, resistance at $4,760. On-chain: Staking inflows +$500M.
LDO (staking proxy, $2.20): RSI at 60. Bullish MACD (+0.12)—target $2.50 (20% upside). Fibonacci support at $2.10, resistance at $2.40.
Overall: RSI 58–60 signals momentum—long at supports for 15–25% Q4 gains. Risks: Unstaking (5–7% dip); hedge with BTC.
How to Profit from ETH Demand
Capitalize on ETH’s catalysts:
Track Signals: Monitor RSI >60 and MACD crossovers for entries (e.g., ETH at $4,200), targeting 10–15% yields.
On-Chain Analysis: Follow staking inflows and treasury holdings via explorers for rally signals.
Portfolio Strategy: Allocate 20–30% to ETH, hedge with USDC at RSI >70 for 20% Q4 returns.
Education: Study staking mechanics and practice trades via demo platforms.
Conclusion: Ride ETH’s Surge
Samsung’s staking and BitMine’s $13.4B treasury fuel ETH’s rally, with $10,000 in sight for 2025. Track signals for breakout gains.
What’s your ETH price target? Comment below!
#EthereumPrice #Staking #CryptoTreasury #MarketTrends #CryptoInvesting
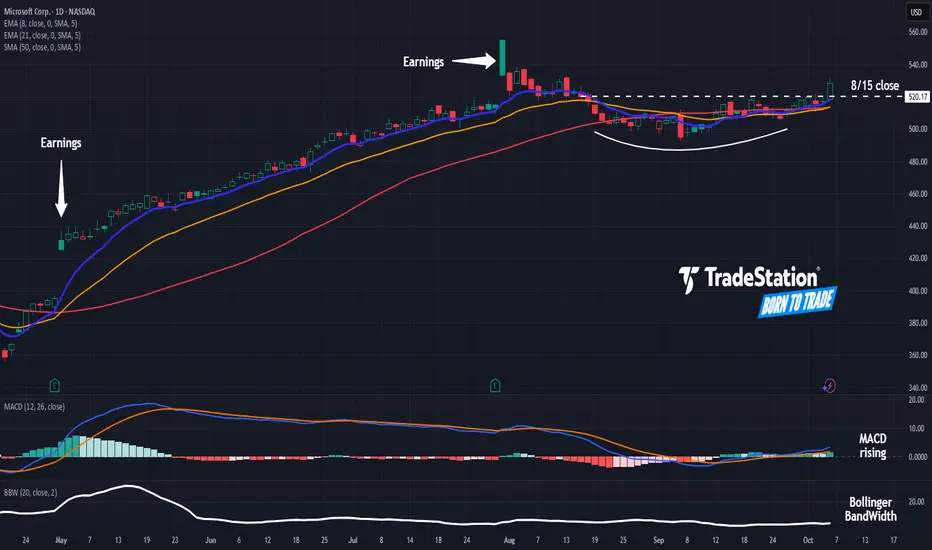
Microsoft May Be Moving AgainMicrosoft has been snoozing since the summer, but some traders may think the tech giant is ready to start moving again.
The first pattern on today’s chart is the pair of bullish gaps following quarterly results, which may reflect positive sentiment.
Second is the August 15 weekly close of $520.17. MSFT slipped under that line in the second half of August and spent all of September below it. Prices crossed the resistance yesterday. That could suggest a breakout has begun.
Third, Bollinger Band Width fell to its narrowest level since April 2024. Are prices set to expand following such compression?
Next, the stock has clawed back above its 50-day simple moving average. The 8-day exponential moving average (EMA) is also above the 21-day EMA and MACD is rising. Those signals may be consistent with bullish direction.
Finally, MSFT is an active underlier in the options market. (Its average daily volume of 296,000 contracts ranks 16th in the S&P 500, according to TradeStation data.) That could help traders take positions with calls and puts.
TradeStation has, for decades, advanced the trading industry, providing access to stocks, options and futures. If you're born to trade, we could be for you. See our Overview for more.
Past performance, whether actual or indicated by historical tests of strategies, is no guarantee of future performance or success. There is a possibility that you may sustain a loss equal to or greater than your entire investment regardless of which asset class you trade (equities, options or futures); therefore, you should not invest or risk money that you cannot afford to lose. Online trading is not suitable for all investors. View the document titled Characteristics and Risks of Standardized Options at www.TradeStation.com . Before trading any asset class, customers must read the relevant risk disclosure statements on www.TradeStation.com . System access and trade placement and execution may be delayed or fail due to market volatility and volume, quote delays, system and software errors, Internet traffic, outages and other factors.
Securities and futures trading is offered to self-directed customers by TradeStation Securities, Inc., a broker-dealer registered with the Securities and Exchange Commission and a futures commission merchant licensed with the Commodity Futures Trading Commission). TradeStation Securities is a member of the Financial Industry Regulatory Authority, the National Futures Association, and a number of exchanges.
Options trading is not suitable for all investors. Your TradeStation Securities’ account application to trade options will be considered and approved or disapproved based on all relevant factors, including your trading experience. See www.TradeStation.com . Visit www.TradeStation.com for full details on the costs and fees associated with options.
Margin trading involves risks, and it is important that you fully understand those risks before trading on margin. The Margin Disclosure Statement outlines many of those risks, including that you can lose more funds than you deposit in your margin account; your brokerage firm can force the sale of securities in your account; your brokerage firm can sell your securities without contacting you; and you are not entitled to an extension of time on a margin call. Review the Margin Disclosure Statement at www.TradeStation.com .
TradeStation Securities, Inc. and TradeStation Technologies, Inc. are each wholly owned subsidiaries of TradeStation Group, Inc., both operating, and providing products and services, under the TradeStation brand and trademark. When applying for, or purchasing, accounts, subscriptions, products and services, it is important that you know which company you will be dealing with. Visit www.TradeStation.com for further important information explaining what this means.
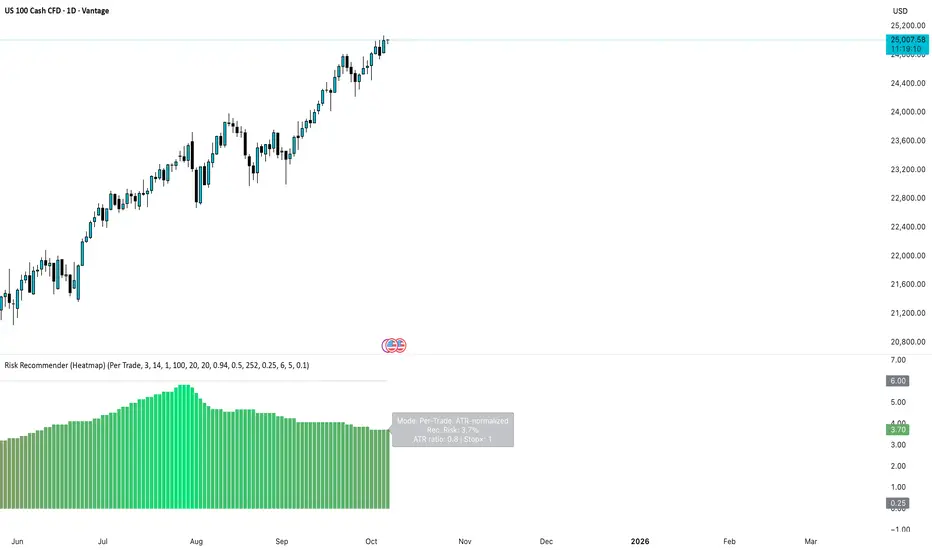
Stop Guessing Risk — Start Measuring It Like a QuantStop deciding risk based on emotion or setup. Do what quants do. Measure volatility and let it define your risk.
Most traders size positions emotionally:
• "This setup looks strong, I’ll double size."
• "I’m not sure, so I’ll go small."
→ Both are inconsistent and lead to unstable performance.
Professionals and systematic traders use a simple principle:
Risk is not a feeling, it’s a function of volatility.
⚙️ The concept
Markets breathe in volatility cycles. When volatility expands, risk should contract.
When volatility contracts, risk can expand.
Your position size should adapt automatically to those cycles.
This Idea demonstrates the logic behind the new 📊 Risk Recommender — (Heatmap) indicator, a tool that quantifies how much of your equity to risk at any time.
🧮 How it works
The indicator offers two complementary modes:
1️⃣ Per-Trade (ATR-based)
• Compares current volatility (ATR) to a long-term baseline.
• When market noise increases, it suggests smaller risk per trade.
• When conditions are quiet, it recommends scaling up—within your own floor and ceiling limits.
2️⃣ Annualized (Volatility Targeting)
• Computes realized and forecast volatility (EWMA-style).
• Adjusts your base risk so your overall exposure stays near a target annualized volatility (e.g., 20%).
• The same math used in institutional risk models and CTA frameworks.
🎨 Visual interpretation
The heatmap column acts as a “risk thermometer”:
• 🟥 Red = High volatility → scale down
• 🟩 Green = Low volatility → scale up
• Smoothed and bounded between your chosen floor and ceiling risk levels.
• The label shows current mode, recommended risk %, and volatility context.
💡 Why this matters
Risk should *never* depend on how confident you feel about a trade.
It should depend on how loud or quiet the market is.
Volatility is the market’s volume knob and this indicator helps you tune your exposure to the same frequency.
📈 Example use case
• NASDAQ volatility spikes → recommended risk drops from 3.0% → 1.2%
• SPX volatility compresses → risk rises gradually → 4.5%
You stay consistent while others overreact.
🚀 Automating it
My invite-only strategy applies this logic automatically to manage exposure in real time.
Combine it with the Risk Recommender indicator for full transparency and adaptive position sizing.
🎯 Summary
✅ Stop guessing risk size.
✅ Let volatility guide you.
✅ Keep risk constant, results consistent.
That’s how quants survive. That’s how traders evolve.
#RiskManagement #Volatility #ATR #PositionSizing #Quant #TradingStrategy #AlgorithmicTrading #SystematicTrading #Portfolio #EWMA #RiskControl