May finally be time to get short CMGCMG has had a helluva run, but I am of the opinion that it is reaching the top of it's 3rd Wave up, sitting right at the 1.618 fib extension of Wave 1. Also very near current channel resistance trend line, which adds to the short idea. Personally I look for the pullback to drag CMG back down to the low 600's, around 615-620 area most likely. Crazy as it may sound however, I really do think this is only the 3rd wave up, and expect to see a 5th Wave extension, in this case quite possibly taking CMG all the way up to what some would say is the astronomical price range of low 1300's. Rough sketch of candle path on chart. In any event, I am looking for CMG to run out of gas very near current price area, and will be initiating a short position very soon, most likely before the end of next week. Stochastic has also been coiling very smoothly near its top range, and I look for a breakout to the downside to very nearly coincide with stock price decline. Happy hunting, and GLTA!!
Wave3

EURAUD shortI will be waiting for a break and retest of my boxed zone and a 4H confirmation candle before entering short to around 1.5800.
II must wait for a break and retest as price is currently at 1.27 fib extension so price could still reverse from here. However confluence for EURAUD start with a strong bearish close on weekly showing momentum for the bears swell as price breaking through both EMAS. On daily both my 20ema and 50ema have crossed showing potential for more bearish movement. My target being the 1.618 fib extension where I will be looking for longs on corrective wave 4 up to around 1.600.
My trade should look something like this:
SELL EURAUD ~@ 1.5910
SL @ 1.5955 (-45)
TP @ 1.5780 (130)
R:R = 2.9
After this move I will be looking for longs but I will post this when the time comes, and if price plays out how I hope it does...


Holiday Shortened Week Will See Fireworks in S&P 500This brief projection is based on a full study of the current Intermediate Wave 1 I am tracking for the S&P 500 index. We will see upward movement to begin the week with a top in the afternoon on July 2, 2019. We will likely drop 5-10 points into the close on this day.
The light blue numbers with parentheses around them represent each wave's end point for the Minuette waves. These projections are likely to be the most accurate on this projection chart.
The orange roman numeral 4 with a circle around it represents the projected end point for Minute wave 4. This is relatively in place, but likely to change based on the actual movement experienced through Minute wave 3 (orange roman numeral with circle around it).
The ultimate top for Intermediate wave 1 is currently projected to occur in the afternoon on July 8, 2019 with a peak around 3048-3064. This would mean a new all time high is set to occur (likely multiple times between now and then). In trying to apply real world events to a reason for a top and then a decline would likely revolve around the Fed. They will most likely NOT cut interest rates as many expect. They may however leave the door open for cuts as necessary in the future. This could see the index pullback over a total of 8 trading days with a bottom around 2875.04.
I am forecasting Intermediate wave 3 to be incredibly strong and last for up to 2 months or around the time of the 2020 US government fiscal year begins. It would be earnings season which could be the reason for a rising market (even if it is not fundamentally warranted). The end of the 2019/beginning of 2020 fiscal year could likely lead to a partisan fight in DC over what the budget should look like especially in a pre-election year.
This is as far out as I plan to forecast for now, and will adjust as necessary. I am bullish on the market until the second quarter next year. I foresee a major recession beginning next year well before the 2020 election.

Euphoric July 4th from BITCOIN(WAVE 3- 2.62 Extension IN PLAY)* Stocks have been on fire the last week since the FED communicated their dovish-ness. Certainly that market confidence is spilling into bitcoin. The correlation between equities and bitcoin has been quite impressive since the bottoms (around 3k). More and more corporate portfolios include bitcoin.
For now this looks extremely bullish(Wave 3).What could change the sentiment?
A) Q2 Earnings Season (around the middle of July)
B)Bad News on Trade talks with China.
* Parabolic movements usually do not end up well. However, if it closes above 11k, it might be looking for a 2.62 extension and a potential target of 13.1k. It all depends on how long this sentiment goes on.
-Something to watch out on:
Sentiment indicator for crypto Fear & Greed- 84( Extreme Greed )
{Credit alternative.me/crypto/fear-and-greed-index/}
A sudden change of momentum can be expected at any moment.
2 Other potential indicators are the price action of Ether and the crypto market cap.
1. The next potential resistance for the market can can be in the range of 400-460 Billion(currently at 332 B's).
2. When it comes to Ether; The most likely extreme profit collection zone would be around 350-360. If there's a change in momentum in Ether after a drop- that confidence loss might spillover into Bitcoin.
We will see how it all turns out during the earnings season.
>>If you liked this idea give it a thumbs up! Every follow is much appreciated!>>
Full Disclosure : This is just an opinion, you decide what to do with your own money. For any further references- contact me.


Bullish Counta solid daily close above the trend-line would suggest a valid break out and would suggest wave (3) rally could be under way
note
alternative count in grey

GBPUSD/ 30min/ start of wave 3GBPUSD
30min time frame
price rejected from 61.8 fib retracement which can be the end of wave 2 and Start of wave 3 .
looking at ichimokou, tenkensen is above kijensen, both are directed upward.
chikou span has been crossed the chart.
forward cloud is ascending and price is above the cloud.
All means shifting the trend .
potential target is 1.3290 and stop loss 1.2980

EURJPY: Waiting for right time to entry for wave 3??Based on my analysis. EURJPY now completed the wave 2 and now waiting for wave 3 Still waiting for confirmation and I looking for any clues based on CS / pattern at this area before BUY.

NANO Working Out a Wave 3?Been hung up for a bit with some resistance from a trend line (green) after another nice little move.
Seems if it can break and hold above the green line, we could be seeing a nice wave 3, after a classic ABC wave 2,
and yesterdays lovely 20% wave 1.
Lets see how it plays out.

ETH Elliot Waves theory Ready for wave 3The target of the wave number 3, is 229 U$ 161.80% of fibonacci extension.
Broke the longterm downtrend line since the all time high
The volume is huge for th bulls.
Will follow BTC, if BTC dumps


Gitfo looking very bullish for start of wave 3Not financial/investment advice. Invest at your own risk.
GTO breakout on the daily. Looking very bullish on a my major indicators.
Do not pay attention to the time line. The targets can happen in rapid succession or played out.
Everything is fractal.
Could retrace slightly more down to 730 before pumping to 1280-1340.
From here, the trend could totally end.
Really depends on what bitcoin does. If bitcoin remains bullish, then we could see a 5th wave in GTO and many other alts play out.
If this is wave completes, my wave 5 target is marked in green but this is crypto and STRETCH targets of 1788 to 2038 are quite possible.

Nano - catch the coming momentum!After more than 300% percent gain during the first wave up, Nano has been one of the best performing coins. A correction just below 0.618 fib level in clear ABC pattern has been completed. The yellow resistance trendline has been broken increasing the likelihood for coming wave 3. First target is around 100% gain at the negative 0.236 level.

Just Started Minute Wave 3The drop today was expected. We have just started minute wave 3. We will take out the recent top and most likely see our next reversal between 2830-2870 over the next 2-4 trading days. Check out all in-depth analysis on my site. Still looking for market top by mid-November above 2950-3000. The wild ride is not over yet.

Alphabet Inc. - Time for a corrective decline in wave (4)Alphabet or Google is testing its long-term support-line. A clear break below this support-line will confirm that wave (3) has peaked and a corrective decline in wave (4) is developing towards at least 845 and likely even closer to 708.

#GBPUSD all i can tell is 50%-50% wait for more confirmation #GBPUSD base on weekly look,we dont have any clear mark about go long or short! now is time for news to move the pair

general wave counting for Eurusd perspective
EURUSD
in M time frame we can see many complete Elliot cycles, which now we are at the mid of wave no. 2.
after finishing this phase i expect a big bullish wave 3
IT MEANS EURO 0.32% 0.34% WILL BE MORE POWERFUL THAN USD IN NEAR FUTURE. AND USA ECONOMIC trade WAR WILL BE HAPPEN.
never miss wave 3
** in case you find my posts interesting and please like it, and suggest my page page and share it with your friend ****

SPXRalph Elliot speaking from beyond the grave.... Typically speaking, wave 4 retraces 23-38%. We are on an extended wave 5 of wave 3. Those 2 rectangles are measurements: 1.618 x wave 1, 2.618 x wave 1. Wave 3 typically terminates around 1.618 wave 1 (watch that 3000 area. It may not even reach it, but if it did and hit the top of the 2.618 box, that's a sell all day. I could go down to the last wave and explain it better but you guys, but you don't pay me enough... Just kidding, I'm lazy. Commodities are down. Look at Silver, Platinum, Natural Gas even. If stock market goes into wave 4 retrace, money will be moved to safer investments perhaps. In fact, I feel that I have pretty much all markets sewn up at this point.

A Larger Correction Might Be Underway for VALEThe Cycle Wave 5 top (and Supercycle Wave 1 top) was most probably on the week of the 14th of May 2018 (please reffer to related idea).
NYSE:VALE now seems to be on an Intermediate Wave C which is part of the Cycle Wave A down.
If this count is correct we should still expect Intermediate waves B and C.
Only after Cycle Wave C, the last part of Supercycle Wave 2, should we see the hallowed Supercycle Wave 3. \o/
Best idea for now is to step aside from the stock and wait for signs Supercycle Wave 3 is around the corner...

SPX set to make new record high above 2900 this monthThe S&P 500 is finally ready to break out and achieve record closes once again. I have identified the zone before the next pullback. The next near-term top should occur by August 23 above 2900. The green box is my starting zone for the top. The black bordered polygon will most likely contain the top. There is strong resistance in this polygon. A short drop should occur after this top before another burst well above 2925 by mid-September.
What are the real-world scenarios to likely drive this quick move up? My guess is a trade deal between the US and at least Mexico, possibly Mexico, Canada, EU, and/or China.
I still have the actual market top on pace for November 2018. This top should be above 3000, but might not make it to 3100. More to follow.

Hold On To That Bull Market, Buck Off AheadThis is our projection for the end of the bull run. Further analysis can be found on our sites. Upcoming events impacting drops are US government shutdown. It would occur on a Monday if it happens. Usually lasts 2-5 days. Expect this to be a down week (Intermediate Wave 4 on chart). US midterm elections. The shakeup possible to rattle stocks is democrat control in House and/or Senate. The election alone could be seen as rougher waters in Washington leading to contentious new laws or lack of law passage. As my projection sits now, this event occurs around the same time I see the market top and end of Supercycle wave 3, Cycle wave 5, Primary wave 5, and Intermediate wave 5.
Time will tell...

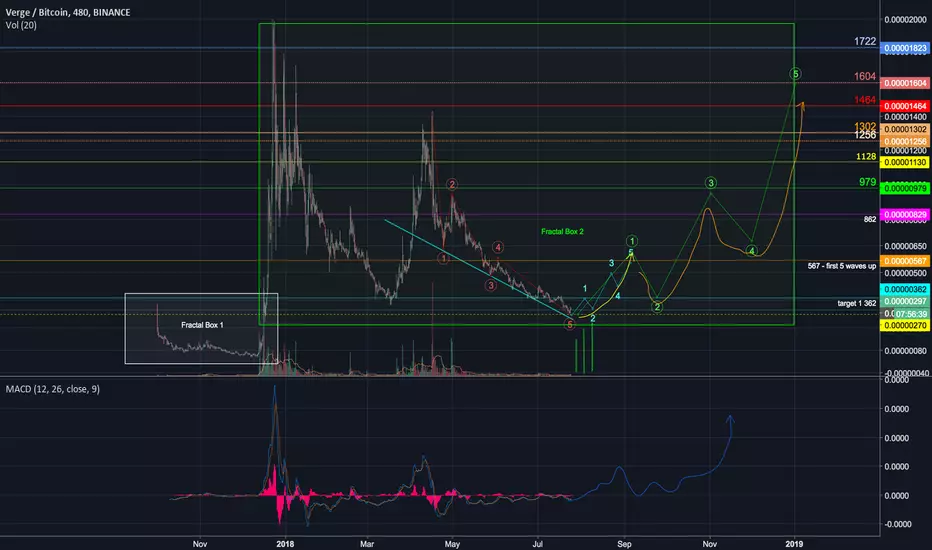
verge on the verge of a massive growth cycle.watch it boom, if not now. check in 2 months.
looks like it will begin a massive wave 3 up.
fractal box 1 labeled in white, is it time to complete its destiny? and go parabolic? if only history repeated itself....
Fractal box 2 labeled in blue.
none of this happens without volume. so where the volume at?
adopt verge. become family.