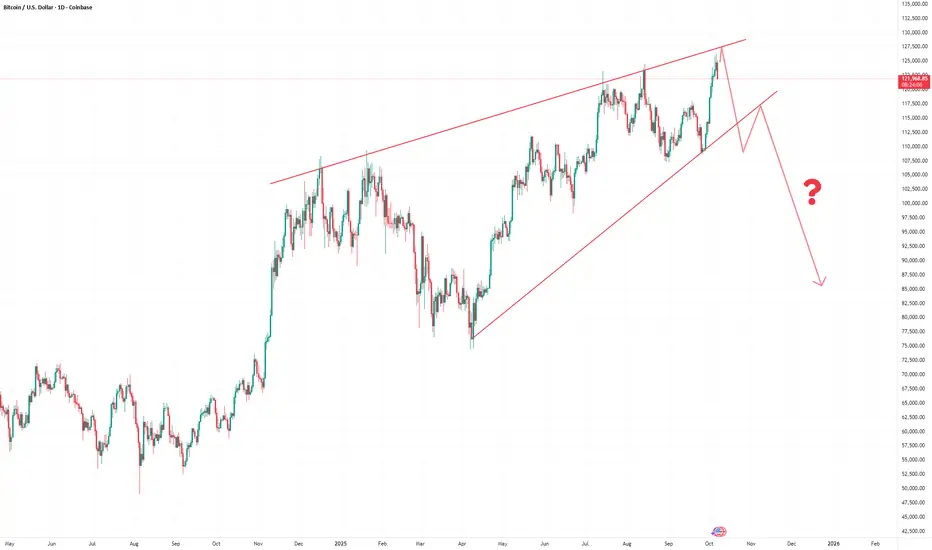
Despite ATH, Bitcoin is not looking solidCOINBASE:BTCUSD hit it's all time high above 126000 yesterday and yet, when you look at the structure of #BTCUSD, it doesn't inspire confidence. It looks like a huge rising wedge with bearish implications. And if this structure is going to play out then bitcoin is likely near it's top.
Wedge
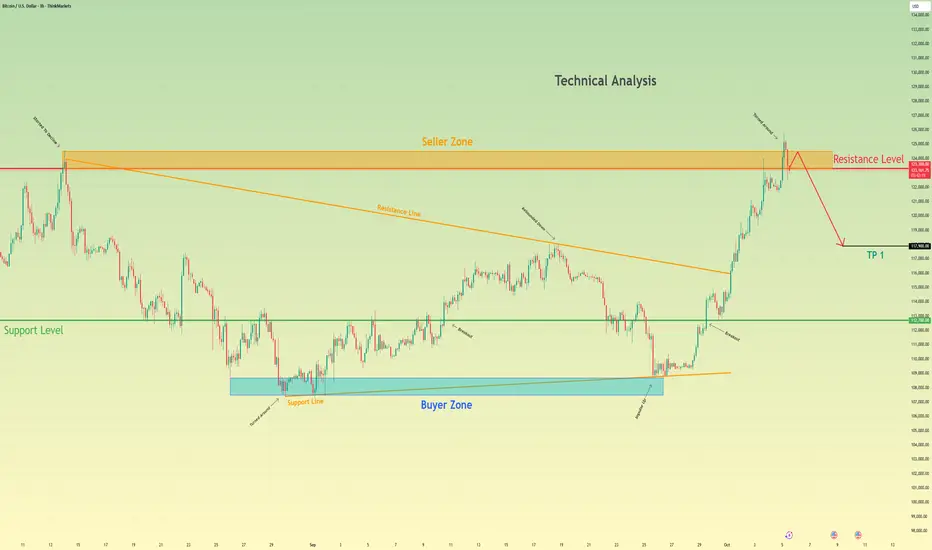
Bitcoin can Fail its Retest and Fall to 117900 pointsHello traders, I want share with you my opinion about Bitcoin. The market for Bitcoin has shown a significant sign of exhaustion and reversal after establishing a new all-time high at the 126000 level. Although this peak was preceded by a strong breakout from a prior downward wedge, the rally failed to sustain, leading to a sharp sell-off. This has shifted the market structure to a bearish bias, confirmed by a decisive breakdown below the key 123300 level. Currently, the price of BTC is in a minor corrective phase, rallying back towards this broken structure. This price action is setting up a classic retest of former support as new resistance. In my mind, this retest presents a high-probability opportunity for sellers. I expect that the price will make a small upward movement into the seller zone near 123300. I think a confirmed rejection from this area will validate the bearish reversal and trigger the next impulsive move downwards. Therefore, I have placed my TP at 117900, targeting a significant area of prior price action and liquidity. Please share this idea with your friends and click Boost 🚀
Disclaimer: As part of ThinkMarkets’ Influencer Program, I am sponsored to share and publish their charts in my analysis.
CROX BULLISH OCT 7 2025Crox is looking good here as price has a support from higher time frames. Price is also trying to narrow its range. I am long here . Do not blindly trade any thing
Always manage your risk & then trade

XAUUSD: At All Time High (ATH)XAUUSD have been surging high for this past months with high highs and higher lows, we are now anticipating it at 4000.gold have proven to be among the most valuable assets to purchase which can yield you profitably.
It is never late to take part in the run, it will be a way long run..
You have to believe in something
Like and follow up
Thanks for reading.

54% Spot Profit ARUSDT / Arweave coinEntry Point : 5.248
Partial-exit : 5.884
Take Profit: 6.65
Stop-Loss : 4.89
A partial exit in the range of 30% to 50% is under consideration and make it free.

USDJPY SELL PROJECTION USDJPY as at this time of this analysis is at a strong supply zone with multiple touches....if you scroll back , you'd see it with multiple touches. And by doing so we can say we should go for another sell
Meanwhile with my confluence on the rising wedge of the trendline, I feel and know if price touches the trendline again , it will go short

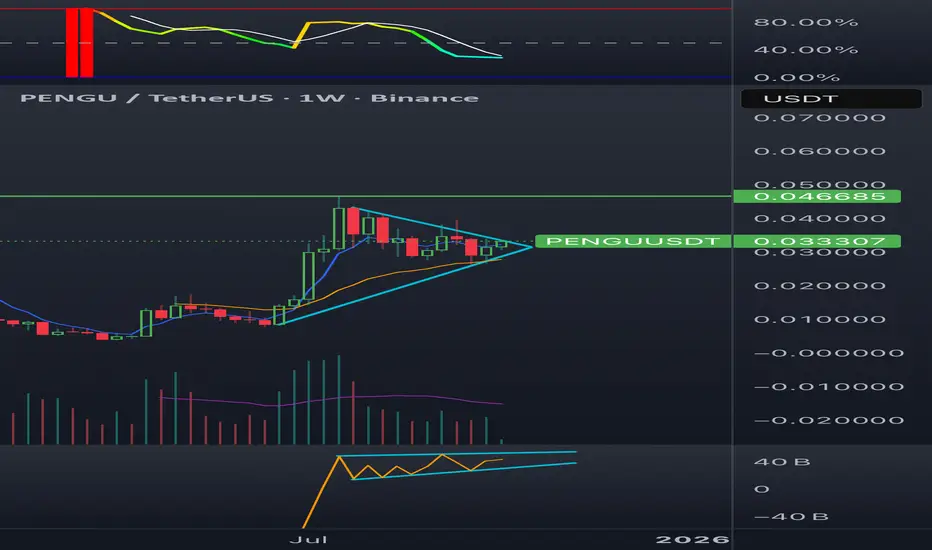
Pengu set to 10x plus I don’t like to share much crypto these days, especially altcoins. My spidey senses tell me pengu is the runner this season. They have a product and brand and revenues through NFT feed and plushies etc. I had tokens before this setup but doubled my position here. The risk to reward is there.
Momentum channnel up, volume up, contracting wedge into volatility reset.
LONG ON GBP/AUDGBP/AUD has created a nice falling wedge into a major demand zone.
Price has already swept sell side liquidity and has given bullish pressure.
I will be buy GA looking to catch 150-200 pips by the end of the week.

EURUSD Long Before ShortSeeing a long for a retreat of the breakout. With fundamentals we coming up for EUR we might see it continuing the up moment or it will dump

USDJPY; EXPECTING SHORT ?We experienced a gaps movement in usdjpy, as we all know it occurs as result of the release of a report that causes sharp price movements with little to no liquidity which usually happens during the weekend when market is closed. about 180-200 pips were covered.
In respect of this structure the gaps took place at the down side which is also known as (GAP DOWN) and gap down indicates a buy signal.
We observed how the pair moved up after the gaps
However a confirmed reversal at this point would activate short movement below the resistance area.
Happy trading week
Thanks for reading

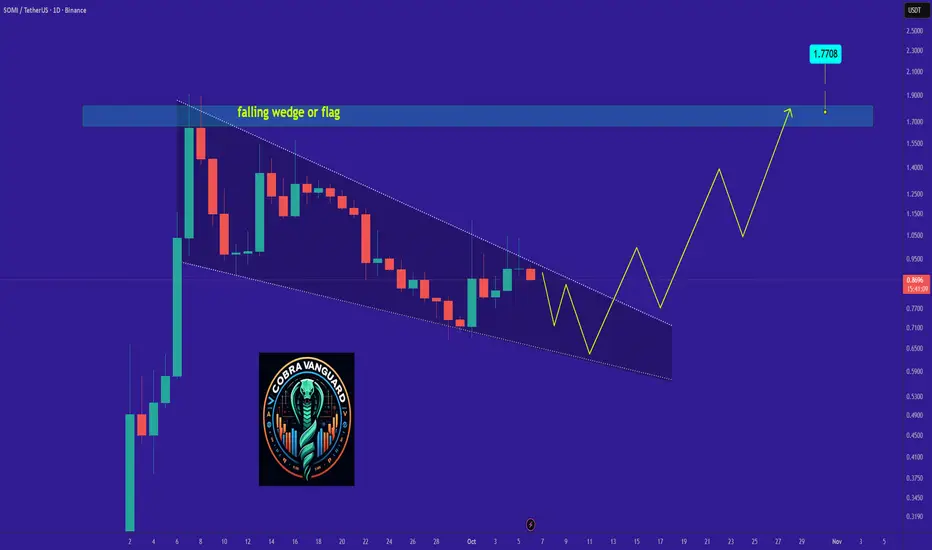
SOMI Ready for PUMP or what ?So if you pay attention to the SOMI chart you can see that the price has formed a Ascending wedge or flag which means it is expected to price move as equal as the measured price movement.( AB=CD )
NOTE: wait for break of the WEDGE .
Best regards CobraVanguard
BTC Breakout Update – Bullish Setup in Play#Bitcoin has been consolidating in a falling wedge pattern – a historically bullish formation. Recently, #BTC has broken out of the wedge, signaling potential momentum shift.
Key Points to Watch:
Wedge breakout already confirmed (bullish sign)
Structure shows LLs & LHs turning – possible trend reversal
Next confirmation needed: break above previous LHs & resistance zone
Only after this breakout can we confidently enter a long trade with proper risk management
Strategy:
I’ll be waiting for a clear breakout + retest of the resistance to position long. Until then, patience is key.
What’s your view – do you think #BTC will continue its breakout and start a strong uptrend, or is this a fake-out before another drop?
Drop your thoughts in the comments & don’t forget to hit like if you found this useful. Follow for more daily #BTC updates & trade ideas!
#BTC #Bitcoin #Crypto #CryptoTrading #BTCUSD #BitcoinAnalysis #BitcoinPrice #CryptoMarket #BTCUpdate #BitcoinTrading #CryptoAnalysis #CryptoSignals #BTCChart #CryptoCommunity #BitcoinBreakout #CryptoTrend #BTCPriceAction #BitcoinTechnicalAnalysis #CryptoIdeas

Bitcoin to $134kAccording to the broadening wedge (blue lines) from the bottom of that , we get a target to 134k for bitcoin

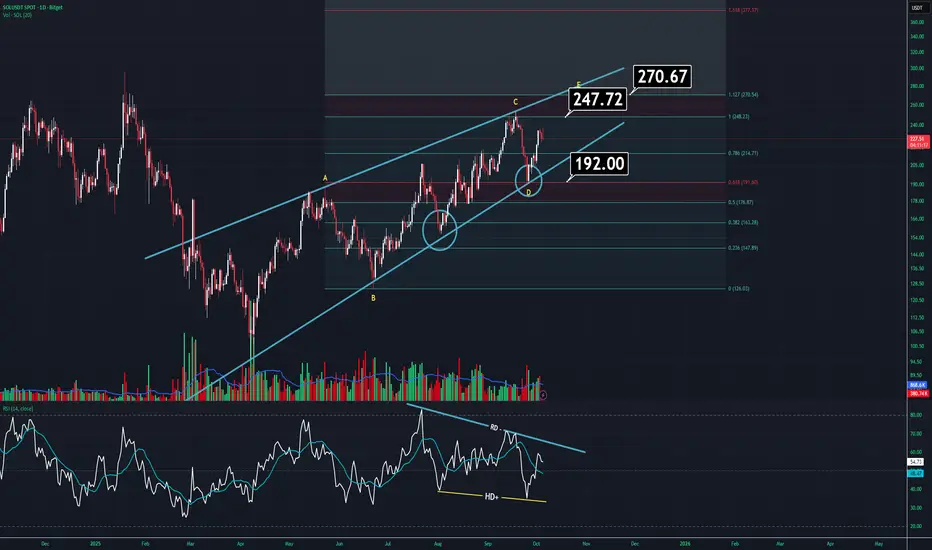
SOLANA UPDATE (1D)SOL is currently at a decision point, mainly due to both the ongoing recession and the delayed ETF approvals.
On the daily chart, it’s getting squeezed inside a large wedge pattern. Normally, it should make one more top before breaking down. However, just to be clear — if price drops below 192, there’s a strong possibility of a sharp sell-off. That’s where both the character shift and wedge breakdown would occur.
Some additional details:
Volume is flat and indecisive. It’s moving in line with the wedge, which isn’t a great sign. Typically, this kind of volume behavior is seen during wedge formations.
The RSI looks unusual — there are both negative and hidden bullish divergences. If you’re wondering which one matters more, it’s the hidden bullish divergence — it’s the stronger signal here.
If the recent high is broken, we could see SOL climbing towards the 270 region, after which we’ll know whether the wedge remains valid. However, in general, the outlook doesn’t look too strong at the moment.
XPL - BULLISH REVERSAL IN PLAY! AMEX:XPL - I was right 2 days ago! Bottom is surely in! 🚀
Clean reversal wedge, bull div & breakout✅
Waiting for bulls to jump in 🚀
0.950🎯
1.00🎯
1.030🎯
1.080🎯
1.100🎯
1.160🎯
Invalidation: H4 candle close under 0.8450$
Told you yesterday',s NO INVALIDATION = No need to panic.
Respecting validation / invalidation trigger is a game changer! :)
#DYOR - not a financial advice

ZEC - BEARISH STRUCTURE --> UNSAFE AREA FOR BULLS#ZEC- price analysis: Cautious with long, NO FOMO.
Prices is up 250%+ in few days, because of hype on "privacy tokens' if i'm right!
Neutral zone monthly.
Key levels weekly have been hit.
🚨Double top daily
🚨H4 bearish divergence
🚨H4 Rising wedge structure
In my opinion, prices is gonna correct deeper toward 125$ or 115$ support next.
Upper big levels:
157 - 165 - 170$
To sum up:
Really unstable area for long subject to a bearish correction.
Bullish momentum faded + bearish structure visibile H1 view.
Cautious under those resistance levels.
Invalidation: H4 candle close above 170$

LZ 1D: Legal move to the upside?On the daily chart, LegalZoom broke out of a falling wedge and perfectly retested the breakout area - almost textbook stuff. The buy zone around 9.25–9.89 aligns with the 0.5–0.618 Fibonacci retracement and previous volume cluster, giving the setup extra strength.
With both MA50 and MA200 below the price, momentum stays bullish. The first technical target lies near $15.33, with potential extension toward $20+ if broader sentiment remains supportive.
From a fundamental view, LegalZoom benefits from renewed demand for digital legal services and cost optimization. Not a bad combo - solid technicals plus improving business dynamics.
So yes, bulls have the gavel now - let’s just hope the verdict is in their favor

DOGE Breakdown Could Trigger a Major Dump Yello, Paradisers! Have you noticed what just happened with DOGE? The recent price action is sending a clear warning that downside risk is increasing — and fast. Several technical signals are aligning, and ignoring them here could be costly.
💎DOGEUSDT has broken down from its ascending channel structure — a clear shift in trend. More importantly, we’re seeing bearish divergence on both MACD and RSI, confirming that momentum is weakening despite recent price attempts to push higher. When these signals appear together, it often precedes a sharp reversal.
💎Adding to the bearish bias, the price has just formed a double top pattern — and not just anywhere, but exactly at a previous support level that has now turned into resistance. This type of confluence makes the setup even more reliable for a potential move to the downside.
💎From the current levels, the risk-to-reward ratio is already attractive for short positions. However, considering the broader bullish tone of the overall crypto market, it may be wise to size positions conservatively here. Traders who prefer more confirmation might wait for a clean retest of the resistance zone, where a bearish candlestick pattern would provide a higher-conviction entry point.
💎If, however, price breaks back above the resistance zone and closes firmly above the invalidation level, the bearish setup becomes invalid. In that case, it's best to step aside and wait for fresh signals or clearer market structure before acting again.
🎖But it never is, and never will be a free ride. Make sure you play it smart, Paradisers; the next 6–9 months will be juicy for some and painful for others. Discipline, patience, robust strategies, and trading tactics are the only ways you can make it long-term in this market.
MyCryptoParadise
iFeel the success🌴

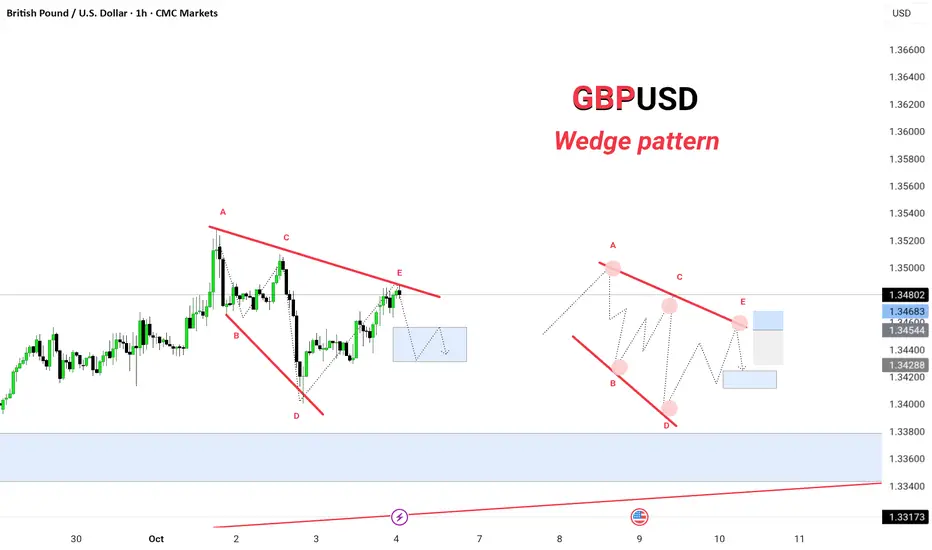
GBPUSD | 4HGBP/USD – Wedge Pattern Analysis | GreenfireForex
The GBP/USD (1H timeframe) is currently forming a contracting wedge pattern (A–B–C–D–E), indicating potential price compression before a decisive breakout.
🔹 Key Observations:
The pair is completing wave E, touching the upper wedge resistance.
Price is expected to face selling pressure near the resistance line, forming a short-term corrective move.
A breakout below the wedge could open a move toward the 1.34200–1.33500 demand zone.
However, if buyers defend support, we may see another push back toward 1.35000 before reversal.
📊 Structure Breakdown:
A–C–E → Lower highs (trendline resistance)
B–D → Higher lows (trendline support)
Possible continuation: ABCDE → Breakout
Blue zones mark potential liquidity areas and entry/exit zones.
⚡ Trading Outlook:
Watch for confirmation candles near the E point before positioning. A clean breakout with volume will confirm the next major move.
🧠 Pattern type: Falling wedge (potential bullish reversal)
🕓 Timeframe: 1H
💰 Instrument: GBP/USD

EUR/USD – Wedge Pattern AnalysisThe EUR/USD (1H timeframe) is currently completing a descending wedge structure (A–B–C–D–E), showing signs of exhaustion after forming a new higher high near 1.17599.
🔹 Market Structure Overview:
The price broke above the previous descending wedge but faced resistance near 1.17599, forming a potential reversal zone.
A corrective leg is expected toward 1.17213, aligning with short-term liquidity before the next impulsive move.
The projected ABCDE structure suggests a final touch at E, followed by a possible bullish breakout from the wedge.
📊 Technical Insights:
Pattern: Descending Wedge (bullish continuation setup)
Resistance zone: 1.17500 – 1.17600
Support zone: 1.17200 – 1.17050
Confirmation level: Break and close above 1.17600
⚡ Trading Plan:
Wait for a confirmed retest of 1.17200–1.17100 region before re-entering long positions.
Aggressive buyers can monitor lower timeframe momentum near point E for early confirmation.
🧠 Timeframe: 1H
💰 Pair: EUR/USD
🎯 Bias: Bullish continuation after wedge completion

MUBI/USDT Analysis by ICT price action Hello dear friends, according to ict concepts we can see very clear points for this coin, fvg area and gaps and for alt season starting this coin can move toward for touch this areas.
Wait for correction of gold and btc and moving of ETH. Then we can watch inject money to small coins like this.
Be patient and give good money from this market.

GBP/USD – Wedge Pattern Analysis | GreenfireForex
📊 Structure Breakdown:
A–C–E → Lower highs (trendline resistance)
B–D → Higher lows (trendline support)
Possible continuation: ABCDE → Breakout
Blue zones mark potential liquidity areas and entry/exit zones.
⚡ Trading Outlook:
Watch for confirmation candles near the E point before positioning. A clean breakout with volume will confirm the next major move.
🧠 Pattern type: Falling wedge (potential bullish reversal)
🕓 Timeframe: 1H
💰 Instrument: GBP/USD
EURUSD Short: Continuation Within the Downward WedgeHello, traders! The prior market structure for EURUSD was a bullish ascending channel, which failed and led to a breakdown. This reversal has established the current bearish market phase, which has taken the form of a downward wedge. This pattern has been guiding the price auction lower through a series of lower highs and lower lows, confirming that seller initiative is dominant.
Currently, the price action is consolidating within this wedge. Following a minor bounce, the market is showing signs of weakness and appears ready to continue the established downtrend, respecting the wedge's boundaries.
My scenario for the development of events is a direct continuation of the decline within this wedge. I expect the price to complete another leg down from the current levels. The take-profit is therefore set directly at the 1.1615 level, targeting the demand zone which aligns with the lower support line of the pattern. Manage your risk!
