AUDUSDRising Wedge with Bearish Divergence found AUDSUD chart which looks like bearish, expected entry point and stop loss mention with TP.
Wedge

NAS100 Possible Retest of Bearish Wedge and Bearish ContinuatioBearish Wedge has broken out. Look out for a possible upside retest to an H1 supply zone and more bearish momentum.
Overall Bias: Bearish.

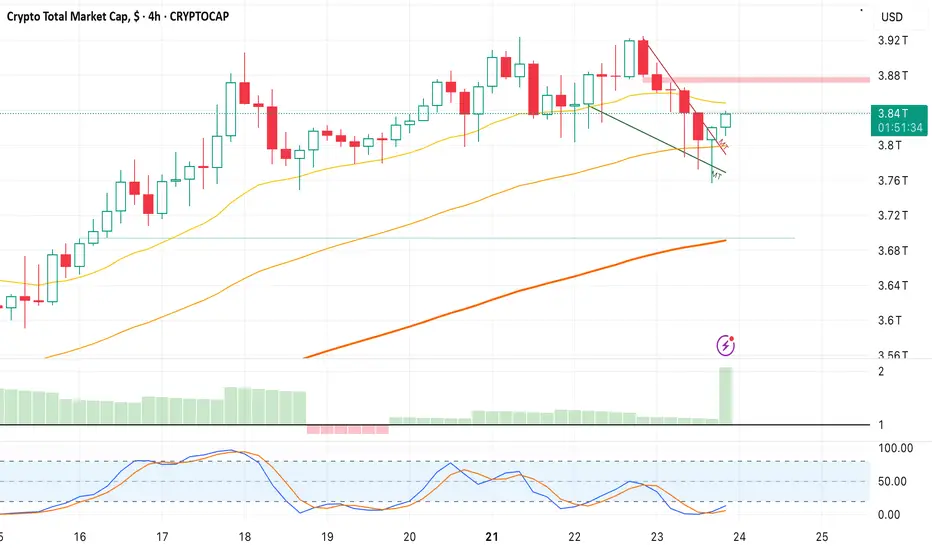
Bounce on Crypto Cap-Falling Wedge breakout at 3.836T, Target- 3.88 and 3.9.
-Looking for Bullish Crypto trading opportunities that align with this bias.
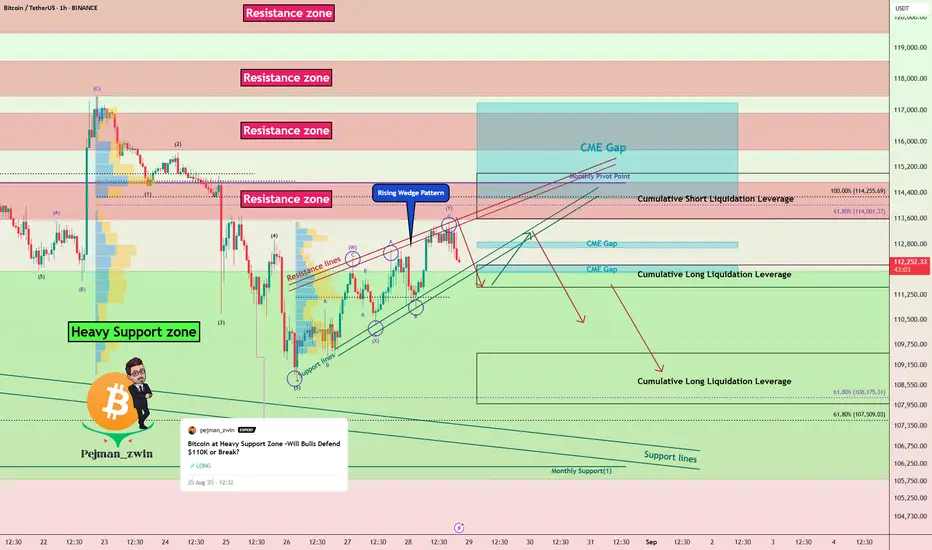
Bitcoin at Make-or-Break: Will BTC Fill the CME Gap?Bitcoin ( BINANCE:BTCUSDT ) increased to $113,500 as I expected in my previous idea .
Do you think Bitcoin can fill the upper CME Gap($117,235-$113,800) !?
Bitcoin is currently moving near the Resistance zone($114,720-$113,580) , Cumulative Short Liquidation Leverage($115,000-$113,588) , Resistance lines , and Monthly Pivot Point .
In terms of Elliott Wave theory , Bitcoin’s movement over the past 2 days has been in the form of corrective waves and has had low momentum . The corrective wave structure is a Double Three Correction(WXY) .
From a Classic Technical Analysis perspective, Bitcoin appears to be completing a Rising Wedge pattern .
I expect Bitcoin to move towards Cumulative Long Liquidation Leverage($109,500-$108,000) after volatile movements over the next two days .
CME Gap: $112,870-$112,700
CME Gap: $112,155-$111,940
Stop Loss(SL): $115,510(Worst)
Please respect each other's ideas and express them politely if you agree or disagree.
Bitcoin Analyze (BTCUSDT), 1-hour time frame.
Be sure to follow the updated ideas.
Do not forget to put a Stop loss for your positions (For every position you want to open).
Please follow your strategy and updates; this is just my Idea, and I will gladly see your ideas in this post.
Please do not forget the ✅' like '✅ button 🙏😊 & Share it with your friends; thanks, and Trade safe.
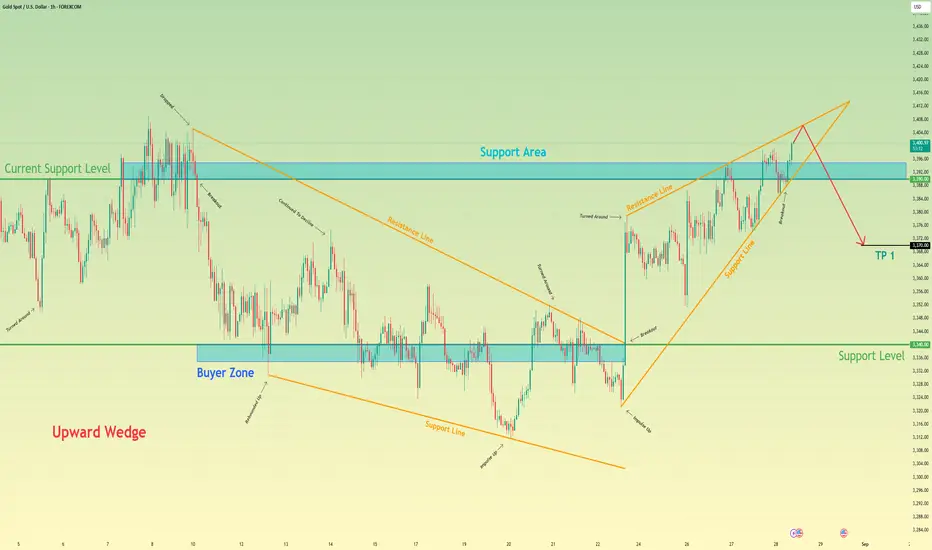
Gold will start to decline and then exit from wedgeHello traders, I want share with you my opinion about Gold. The market dynamic for XAUUSD has seen a significant evolution, transitioning from a corrective falling wedge into a new bullish phase after a powerful breakout from the lows. This upward trend has since matured and taken the shape of a large upward wedge, a pattern that has been guiding the price higher through a series of rebounds and corrections. This formation, while bullish in the short term, often signals potential trend exhaustion as it approaches its apex. Currently, the price action for XAU is at a critical juncture, pushing up against the upper resistance line of this wedge. The primary working hypothesis is a short scenario, which is predicated on the common bearish resolution of a rising wedge pattern. It is anticipated that the asset will be rejected from this resistance line, signalling that buying momentum is waning. A confirmed failure at this peak would likely trigger a sharp reversal, with enough selling pressure to cause a breakdown below the wedge's ascending support line and the current support level of 3390. This structural failure would validate the bearish thesis and initiate a new downward leg. Therefore, the TP is logically set at 3370 points, representing a prudent first objective for the price to achieve following the anticipated breakdown of the wedge structure. Please share this idea with your friends and click Boost 🚀
EURUSD: More Growth Ahead 🇪🇺🇺🇸
EURUSD closed in a very strong bullish mood,
perfectly respecting a bullish breaker block on a 4H time frame.
With a high probability, a bullish rally will continue next week.
Next goal - 1.172
❤️Please, support my work with like, thank you!❤️
I am part of Trade Nation's Influencer program and receive a monthly fee for using their TradingView charts in my analysis.

NZDJPY 1H LONGFound falling wedge with bullish divergence
Entry on break on last LH, Projection about 1:1

XAUUSD Technical OutlookWhat I see!
XAUUSD Technical Daily Outlook
Gold (XAUUSD) is forming a falling wedge after the sharp drop from the 3,430s high - - a structure that often signals a potential bullish reversal.
Price is consolidating inside the wedge, rejecting from the Daily FVG while holding the H4 demand zone at 3,320. A break above the wedge trend-line could spark an impulsive move toward the 3,375 BSL, with further upside into 3,439 if liquidity is cleared.
The wedge has already completed five legs, adding confluence for a possible breakout soon. Conversely, failure to hold 3,320 may invite deeper retracement before bulls re-enter.
This chart is presented for educational discussion of market structure and technical patterns only. It is not a trade signal or financial advice.
Learn before earning!

Gold-Bullish Reversal from Falling Wedge(Bull Flag Continuation)Price has bounced strongly from the support zone with two solid bullish 4H candles, confirming a potential reversal.
The structure shows a falling wedge after a strong bullish leg, often acting as a bull flag continuation pattern.
📌 Key Levels:
Support: 3310 – 3320
Resistance 1: 3350 – 3360 (first breakout test)
Resistance 2: 3375 (key resistance / PRZ)
Resistance 3: 3400 (measured move target)
Resistance 4: 3470 (channel top)
⚡ Scenarios:
Bullish: A breakout and close above 3350–3360, followed by 3375, opens the path toward 3400 and potentially 3470.
Bearish (invalid): A drop back below 3310 could extend the downside toward 3280.

Gold at Resistance ! Next move will decide trend.Daily Chart Update – Gold1!
Gold is currently forming a rising wedge pattern, with resistance near the sell zone of 103550–103700. The metal is also trading within a well-defined ascending parallel channel, where the channel resistance aligns with the first selling level around 10500.
On a percentage basis, after a 5–6% upward move, gold has reached the key levels of 104700–10500. If these resistance levels hold, we may witness a potential decline in prices. Accordingly, positions can be shifted, and selling opportunities may be considered in line with both the pattern formation and the overall market structure.
Conclusion: According to the pattern and overall structure, 103500 is the first selling zone, while further resistance lies at 104700–10500. Sustaining below these levels could open the way for lower prices.

Gold Faces Upward Pressure from Fundamentals: Levels to WatchGold is currently trading above the trend line from its historic high at the 3,410 level. However, let's summarize the developments for XAUSD since the beginning of the month. News since the beginning of August, particularly the Financial Times report on August 8 about Swiss gold bars being subject to tariffs, and the uncertainty caused by the delay in official confirmation, significantly widened the spread between spot gold and gold futures, with the average intraday spread around 35. After the official approval of the gold tariff, gold peaked at 3,409 on August 7 and then hit this month's low of 3,311 on August 20, forming a falling wedge pattern. Gold then attempted to break out of the wedge strongly and met its 200-hour moving average. And acted as resistance.
At the Jackson Hole Conference held in Wyoming, USA, Fed Chairman J. Powell drew attention to the downward pressure on the employment:"In the near term, risks to inflation are tilted to the upside, and risks to employment to the downside-a challenging situation," Powell said in his remarks. "Nonetheless, with policy in restrictive territory, the baseline outlook and the shifting balance of risks may warrant adjusting our policy stance."market and noted that they could change their monetary policy stance. Although Fed members and Powell reiterated their data-dependent stance. This speech was perceived as dovish by the market and interpreted as a signal for an interest rate cut in September. With this announcement, gold rose from 3,323 to 3,374 levels. Following this upward movement, gold continued within a rising wedge formation. However, on August 25, Fed member Lisa Cook was dismissed by US President Trump, and Cook's objection to this decision on legal grounds increased uncertainty in the market regarding interference with the Fed's independence of both means and purpose.
On August 28, gold reached around $3,420, its highest level this month. This breakout from the rising wedge may be misleading, but the pressure on the Fed and upcoming inflation and unemployment data may signal that upward pressure will continue. We clearly saw this month's PPI data breakdown, specifically in the Trade of Finished Goods section, that tariffs are accelerating inflation pass-through.In other words, tariffs have begun to have a serious impact on the trade balance, which means that future CPI (headline inflation) and PCE data could show a significant upward movement, increasing uncertainty and pushing gold prices higher.
In conclusion, the overall outlook for gold is upward. The 3,420 resistance level is currently critical, as it is both a Fibonacci retracement and a resistance level. If this level is broken, the upward movement could accelerate. Breaking the 3,420 resistance level would mean overcoming the trend coming from the 3,500 level, implying that there would be no other obstacle left to test the 3,450 level, the last resistance before the historical peak. However, if the technical analysis holds, the rising wedge formation carries downside risks. Breaking below the 3406 support level is critical in this regard; if broken, gold could exit the formation and begin a downward movement towards 3385.

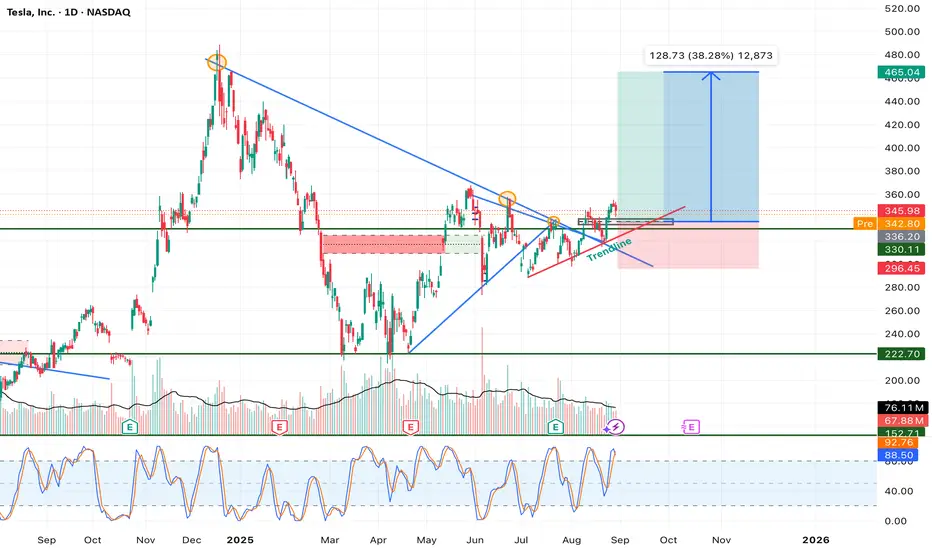
Tesla – Symmetrical Triangle Breakout With 38% Upside PotentialTesla (TSLA) has been consolidating for several months within a symmetrical triangle formation, bounded by a descending resistance trendline from the November 2024 high and an ascending support trendline from the April 2025 low. This consolidation has now resolved with a breakout above resistance, suggesting the start of a new bullish leg.
Technical Breakdown:
1. Symmetrical Triangle Formation:
• Price compressed into tighter ranges, with lower highs and higher lows converging.
• Breakout occurred above the descending trendline, confirming bullish bias.
2. Volume Confirmation:
• Breakout was accompanied by a noticeable uptick in buying volume, strengthening the validity of the move.
• Historical patterns show Tesla often rallies strongly after high-volume breakouts from consolidation zones.
3. Support & Resistance Zones:
• Immediate support: $336 (former resistance turned support, aligned with trendline retest).
• Stronger support: $296 (previous demand zone, key invalidation level).
• Resistance target: $465 (measured move from triangle breakout, aligning with prior swing levels).
4. Momentum Indicators:
• Stochastic RSI is rebounding from oversold territory, suggesting fresh buying momentum.
• MACD (not shown on chart but implied) likely supports bullish crossover given recent price action.
5. Risk-to-Reward Setup:
• Entry: $340–$345 zone after breakout retest.
• Stop Loss: Below $296 (breakdown invalidation).
• Target: $465 (38% upside potential from current levels).
• Risk/reward ratio favors long positions with significant asymmetry.
Trade Thesis:
The breakout from a well-defined symmetrical triangle suggests a continuation of Tesla’s mid-term bullish trend. The measured move projection points toward ~$465, representing a potential 38% rally from current prices. As long as price sustains above the $336–$340 support zone, bulls remain in control. A breakdown below $296 would invalidate this structure and open the door for a deeper retracement.
Conclusion:
Tesla has entered a critical bullish phase after months of consolidation. With volume confirmation, favorable risk-to-reward, and momentum recovery, the path of least resistance is higher. Upside targets sit near $465, with invalidation set at $296.
NASDAQ:TSLA
BITCOIN → Breakthrough of the downward trend resistance... 120K?BINANCE:BTCUSDT.P formed a false breakdown of key support at 110,000 - 112,000 and returned to the whales' zone of interest. The chart shows the prerequisites for a possible end to the countertrend correction...
A false breakdown of the daily support of 110K - 112K provokes a local bearish rally, within which the price breaks through the downward resistance of the correction and tests 113.300. The growth was supported by positive signals from institutional investors, technical stability and a decrease in selling pressure.
The fundamental background is positive, the market is trending. The chart shows prerequisites for the end of the correction. However, the further outlook depends on the 112.0 - 112.5K area. if the bulls hold the price above this zone, the flagship may return to the upward movement and head towards 117K - 120K.
Support levels: 112.5, 112.0, 110.9
Resistance levels: 113.6, 114.6, 117.0
After breaking through the resistance of the descending channel, the impulse stops and most likely a fight for the 112K zone may form. If the price returns to the channel and consolidates below 112K, then Bitcoin may return to the downward movement, however, while the price is trading above this line, the bulls have a chance...
Best regards, R. Linda!

XAUUSD: Price Rebound from Support line to $3440Hello everyone, here is my breakdown of the current Gold setup.
Market Analysis
From a broader perspective, we've seen a clear shift in control on the chart. The market successfully reversed a prior downtrend by breaking out of a Downward Channel. This breakout was significant and has established the current bullish market structure, which has been guiding the price higher.
This new bullish phase has formed a well-defined Upward Wedge. The price has been respecting its boundaries, making higher highs and higher lows. Currently, the price is undergoing a corrective pullback and is testing the ascending support line of this wedge, which aligns with the Support zone around the 3390 level.
My Scenario & Strategy
My scenario is built on the expectation that this upward wedge structure will remain intact. The current pullback to the support line presents a classic opportunity within an established uptrend.
I'm anticipating a clear bounce from the current support zone. This should initiate a rally back towards the wedge's resistance line. The key part of this scenario is that I expect the buying pressure to be strong enough to force a breakout above that resistance, signaling an acceleration of the trend. The primary target for this breakout scenario is 3440 points.
That's the setup I'm tracking. Thank you for your attention, and always manage your risk.

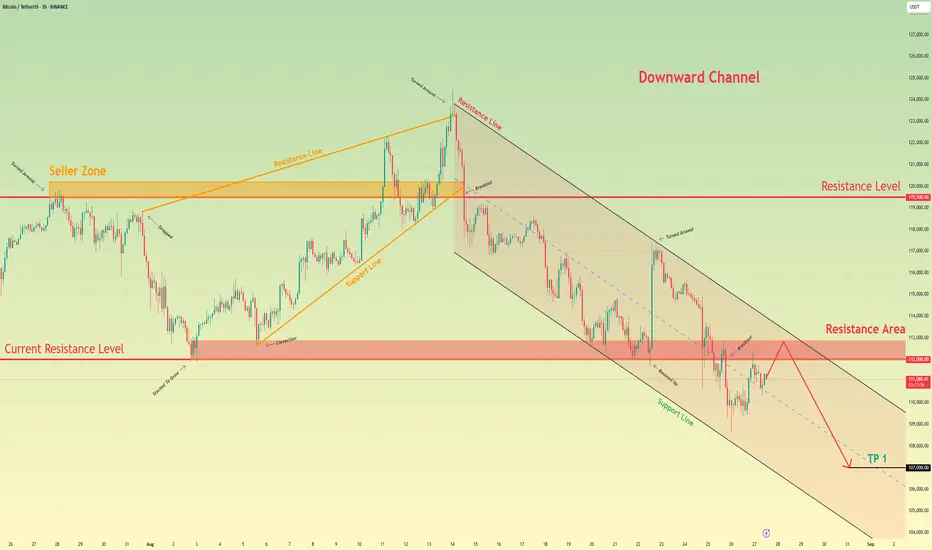
Bitcoin will rebound from resistance area and continue to fallHello traders, I want share with you my opinion about Bitcoin. A distinct shift in market control from buyers to sellers has defined the recent price action for Bitcoin. After the prior upward wedge failed at the major 119500 resistance level, a significant breakdown occurred, initiating the current bearish phase, which has been neatly contained within a downward channel. The price action within this structure has been orderly, consisting of downward impulses followed by corrective rebounds. The most critical recent development was the downward fall that broke below the key horizontal support level at 112000. Currently, the asset is in the midst of an upward rebound, rallying back to test this broken structure from below. The primary working hypothesis is a brief scenario, anticipating that this rally will fail upon entering the 112900 - 112000 resistance zone. A confirmed rejection from this former support area would validate the bearish trend continuation and signal that the next impulsive move down is imminent. Therefore, the TP for this scenario is logically set at 107000 points. Please share this idea with your friends and click Boost 🚀
XAUUSD (4H) – Testing Major Supply Zone | Rejection AreaFOREXCOM:XAUUSD
Structure | Trend | Key Reaction Zones
Gold has been in a bullish structure with higher lows 🟢, pushing price back into the 3430–3440 supply zone 🔴 where previous rejections occurred. A demand base sits around 3373–3360 🛡️, making this the key decision range.
Market Overview
After breaking out of a consolidation wedge and retesting successfully, gold rallied strongly into overhead supply. Momentum is bullish, but the supply block at 3430–3440 remains unbroken. A clear breakout will confirm continuation, while rejection here could trigger a corrective pullback into lower supports.
Key Scenarios
✅ Bullish Case 🚀 → 🎯 Target 1: 3445 → 🎯 Target 2: 3460 → 🎯 Target 3: 3480 liquidity zone
❌ Bearish Case 📉 → 🎯 Target 1: 3373 → 🎯 Target 2: 3321
Current Levels to Watch
Resistance 🔴: 3430 → 3440 → 3460
Support 🟢: 3373 → 3360 → 3321
⚠️ Disclaimer: For educational purposes only. Not financial advice.

GOLD → Retest 3400. Readiness for a breakthroughFX:XAUUSD is "consolidating" creeping up on resistance, which generally increases the chances of a breakout, but the initial resistance test may end in a pullback. However, there is news ahead that could trigger one of two scenarios...
At the moment, gold is testing $3,400, but is ready for a correction pending new data from the US. However, further decline may be limited for the following reasons: Weak dollar: The probability of a Fed rate cut in September is estimated at 90%. Trump-Fed conflict: Pressure on Fed Chair Lisa Cook undermines confidence in the dollar. Trade wars: New US tariffs (on India) and retaliatory measures (Mexico, Canada against China) increase demand for "safe havens"
What is important: Political uncertainty and soft rhetoric of the Fed continue to play in favor of gold. Any attempts to reduce will be supported by buyers. It is also worth paying attention to the GDP and Initial Jobless Claims, which will be published today at 12:30 GMT.
Resistance levels: 3405, 3420, 3433
Support levels: 3386, 3373, 3369
Technically, the situation is ambiguous and everything depends on the reaction to 3405 and further news. Weakening of the fundamental background may lead to consolidation or correction to 3373 - 3369. However, if traders feel support, then the retest of 3405 may end with a small consolidation around the level and subsequent breakout and growth to the specified targets (I am more inclined to this scenario based on the above situation)
Best regards, R. Linda!

ETHUSDT (30m) – Recovery Structure at Support | TESTING WEDGEBITSTAMP:ETHUSD
Structure | Trend | Key Reaction Zones
ETH remains in a recovery phase after a major rejection at 4950, now consolidating between a strong supply zone (4678–4800) and short-term support (4320–4400). A key breakout zone lies around 4538, with supply pressure above 4678.
Market Overview
ETH has been moving in a corrective structure following rejection from highs, showing short-term consolidation around the support/resistance flip zone. Buyers are attempting to defend the 4400–4320 demand area, while sellers are still active at 4678+. The next move depends on whether ETH breaks above resistance or loses support.
Key Scenarios
Bullish Case 🚀
Bounce from 4400–4320 support zone.
🎯 Target 1: 4538 (key breakout point)
🎯 Target 2: 4678–4800 (supply zone)
🎯 Target 3: 4950 (previous high)
Bearish Case 🔻
Failure to hold 4320 support could trigger deeper downside.
🎯 Target 1: 4206 (critical demand)
🎯 Target 2: 4064 (major support & continuation risk)
Current Levels to Watch
Resistance: 4538 → 4678 → 4800 → 4950
Support: 4400 → 4320 → 4206 → 4064
⚠️ Disclaimer: This analysis is for educational purposes only. Not financial advice.

SOLANA to make a new ATH?!My hypothesis is that Solana is on course to be one of the first alt coins to top out first as it makes its final wave 5 move in SOL|USD pair. Trump also announced that SOL is part of the US strategic reserve (2/3/25) and has a special place as an OG crypto, despite only being launched from 2020.
SOL is presenting a ' rising wedge ' pattern which is typically a bearish structure under TA principles. Given SOL has already gained +2500% from the 2022 ABC bottom, I think its cycle top is approaching.
From its bottom in NOV-22 (with the FTX crash having ~10% of the SOL supply), SOL bottomed out when it was 0.39% of the crypto market last cycle and topping out at ~3%. However, this cycle, SOL.D has gained higher crypto dominance sitting today at about ~2.98%, thanks to higher utility over the bear market (e.g. NFT usage increasing from ETH to SOL as seen with the likes of Trump coin). This cycle I expect SOL.D to top at around 6.5-7.3%.
SOL|ETH pair should top soon as its currently bottoming out (wave 4) against SOL|ETH pair and ready to make its final wave 5 move. SOL|BTC is also making its wave 5 as it gains higher dominance over BTC which is getting closer to its wave 5 top.
SOLANA USD Targets:
1. $365 Key price point to break
2. $600 Likely
3. $960 Moonshot (Raoul Paul delusional target of $1k)
4. $1500 Unlikely

NZDJPY → A false breakout of resistance will trigger a declineFX:NZDJPY entered a correction phase after a sharp decline. The main trend is downward, with a countertrend movement aimed at consolidating potential before further decline.
A countertrend correction is forming against the backdrop of the main downward trend. The current movement may be aimed at hunting for liquidity before continuing its movement. Focus on the resistance zone at 86.67
The currency pair is trading below key resistance within the global downtrend. As part of the correction, the price may test 86.67 - 87.10 before continuing the main trend.
Resistance levels: 86.67, 86.97, 97.11
Support levels: 85.97, 85.6
If a false breakout of the key zone of interest forms during the correction without the possibility of continuing growth, we will receive confirmation that the market is ready to move down. Consolidation below the level may trigger a downward impulse.
Best regards, R. Linda!

RUNE/BTC ThorChain Bullish Exit. Chance to triple your Bitcoin!BINANCE:RUNEBTC is forming a perfect trade setup with a clear defined stop loss and a few targets at +50%, +75% and 3x the current price.
I've been watching RUNE for a long time, and I have made two calls in the past year that were both correct in direction but never reached their targets.
The first call:
On the week of 12 April 2024 when this triangle was broken, I called a target of 3116 Sats. The target was never reached. We ultimately reached a low of 5100 Sats, but we did so in a gradual fashion respecting a descending trendline, which supported the price and acted as a lower line of a falling wedge structure that looks like this:
This was my second call with a target of 10,200 Sats. That target wasn't hit either.
The same lower line of that orange falling wedge now, in light blue, defines the bottom of a new falling wedge structure which is the main subject of this trade.
Price has broken above the falling wedge, then attempted a reversal off the top of it. Four times, the upper line supported price only to be broken the fifth time. A week later, price broke again above the line. I believe this is a perfect setup for a trade with a tight yet reasonable stop loss, and potentially a 3x bullish target.
Bear in mind, I'm calling 3x versus Bitcoin. I'm not talking about BINANCE:RUNEUSDT , which may well reach higher gains.
The stop loss is represented by the descending support line (dotted light blue) beneath the Falling Wedge's upper side.
The Targets are:
50% up to 8400 Sats.
75% up to 10,280 Sats.
200% (3x) up to 18,000 Sats.
Whether RUNE's price will reach these targets depends on the strength of the move. In the case where price gets rejected before or at reaching the first target at 8400 Sats, we can judge the momentum to be too weak, and expect a drop back to the falling wedge, this time, reaching the bearish target of my first call at 3116 Sats.
If the move is strong enough to reach the second target of 10,280 Sats, I expect a pull back and re-accumulation phase into what I labelled the Launching Platform on the chart. (Should've simply called it a Launchpad XD). This could be a bull pennant or an ascending triangle. That's what will push price to the third and log-scale target of 18k Sats.
Follow this chart here .

Bitcoin – Wedge at Wave 5, Exhaustion Signals RisingBitcoin’s multi-year rally from the 2022 lows has unfolded in a clean Elliott Wave impulse. The structure now appears to be entering its terminal phase, with wedge-like price action and weakening momentum suggesting exhaustion.
Wave Structure:
Wave 1 rose from the November 2022 bottom at 15,479 to 31,035.
Wave 2 corrected to 24,920.
Wave 3 extended sharply to 73,794.
Wave 4 pulled back to 49,577.
Wave 5 has pushed into new highs, reaching 124,517 so far.
Although 124,517 is a candidate top, the internal structure still leaves room for one final minor push higher before Wave 5 is truly complete.
Wedge Formation & Exhaustion:
The advance in Wave 5 is taking the form of a wedge-like structure with higher highs , a setup often associated with ending diagonals. Such patterns are typically found in the 5th of 5th wave position, signalling the final stretch of a trend.
At the same time, the RSI is diverging — price is making new highs while momentum prints lower highs. This bearish divergence reinforces the case that the rally is losing strength, even as it grinds upward.
Correction Outlook:
When the Wave 5 top is confirmed , correction targets can be mapped using Fibonacci retracements and prior support zones. Until that point, exact downside levels remain open. What matters is the process: once the rally exhausts, retracements are expected to be swift, and the initial reaction will help define the corrective path.
Risk Management:
The bearish view applies only after Wave 5 is complete. A sustained break and continuation above 124,517 would suggest Wave 5 is extending further before exhaustion sets in. Traders should respect the possibility of one more thrust higher before the corrective phase begins.
Summary:
Bitcoin’s 5th wave is nearing completion, likely in the form of an ending diagonal. Price has made higher highs, but RSI divergence points to fading momentum. Once the Wave 5 top is confirmed, correction levels can be projected using Fibonacci tools and prior support zones. Until then, the market remains in its final push, with exhaustion signals growing louder.
Disclaimer: This analysis is for educational purposes only and does not constitute investment advice. Please do your own research (DYOR) before making any trading decisions.

GBPAUD → The correction is nearing completion...FX:GBPAUD is set to end the correction formed within the global bullish trend. A false breakdown of the liquidity zone is forming...
GBPAUD on D1 is testing a strong support zone, which gives traders hope for a possible recovery. Locally, the chart shows signs of the correction ending...
After correcting to 1/2 of the range, GBPAUD is forming a false breakdown of the order block and breaking the bearish structure, confirming the end of the correction. Consolidation above 2.076 could trigger a recovery within the bullish trend.
Resistance levels: 2.086, 2.0978
Support levels: 2.076, 2.0715
Despite breaking through the resistance of the local correction, the market must confirm the bullish sentiment. Consolidation of the price above 2.076 will confirm this nuance, and consolidation above the key support may influence further growth.
Best regards, R. Linda!
