Another wedge?Price is landing on a string demand area and at the same time is forming a falling wedge. Looks very expulsive like the shown on the chart. Risk-reward is good. I opened a long position, SL triggers if a daily candles closes below the demand zone.
Wedge

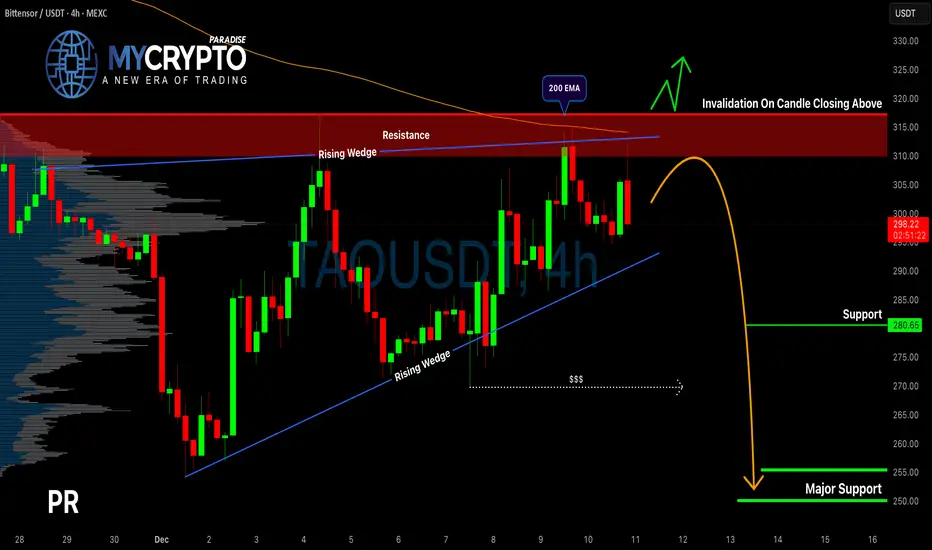
TAO Showing Weakness at Resistance — Is a Breakdown Imminent?Yello Paradisers! Are we about to witness a sharp rejection from resistance… or is this just the calm before the breakout storm?
💎TAOUSDT is currently reacting from a strong resistance zone and what makes things even more interesting is the rising wedge pattern that has formed in this area. This type of structure historically points to a higher probability of a bearish move, and right now, the conditions are lining up for potential downside.
💎But to secure a better risk-to-reward (RR) setup, a small pullback from the current level would be ideal. After that, we’ll look for a clear bearish candlestick formation to confirm entry. The main targets lie below, around the liquidity pools and key support zones, which also align with strong long-term levels.
💎Still, there’s one critical invalidation point:
If the price breaks and closes above the resistance zone, it would invalidate the entire bearish setup. In that case, the smart move is to wait patiently for a cleaner structure and more reliable signals before acting.
🎖This is what trading like a professional looks like, clear setups, no emotional bias, and total commitment to risk management. It's not about predicting every move perfectly, it's about positioning only when the odds are in your favor.
MyCryptoParadise
iFeel the success🌴
KSE100 – 1H Update🔹 The index is forming a Rising Wedge within an uptrend, and a clear bearish divergence is present on the RSI.
🔹 If a downside breakdown of the wedge on the 1H timeframe occurs, there is a strong chance of a correction.
🔻 Downside Targets:
🔹 168,800 (if a fake/wick-out occurs)
🔹 166,000 (uptrend channel support)
A correction of approximately 4,400 points toward 166k is technically justified.
⚠️ Invalidation: A strong close above 172k.

ALCHUSDT – 4H trade ideaPrice is currently forming a bullish falling wedge, with liquidity resting at the 4H FVG below.
Based on the Total Market Cap context, I’m expecting a potential AMD scenario:
Possible wick down into the 4H FVG
Followed by a bullish breakout from the falling wedge
Price is consolidating above the Monthly VWAP, which supports the bullish bias.
If we see confirmation after the sweep, continuation towards higher levels becomes likely.
➡️ Check the weekly analysis for higher timeframe context.

CASH, 1D (Falling wedge with bullish divergence)CASH, 1D
Falling wedge with bullish divergence
Arsalan Anwer
Stags

LINK - Same Base, Same Question: Is Another Impulse Loading?📊LINK has been respecting a very clean long-term structure.
Each major sell-off has found support around the rising blue trendline, followed by a strong impulsive move higher. This behavior has repeated multiple times, creating a clear rhythm:
correction → base → impulse.🔁
Right now, price is once again sitting on that same structural support, right above the horizontal support zone. The market has slowed down, volatility has compressed, and sellers are losing momentum, conditions that often precede expansion.
The big question now is simple 🤔
Will LINK deliver another impulse from the same base?
⚔️As long as price holds above the trendline and support, the focus remains on trend-following bullish continuation. A clean reaction here keeps the structure intact. A decisive break below would invalidate the setup and change the narrative.
Patience matters here. Let price confirm its intent.
⚠️ Disclaimer: This is not financial advice. Always do your own research and manage risk properly.
📚 Stick to your trading plan regarding entries, risk, and management.
Good luck! 🍀
All Strategies Are Good; If Managed Properly!
~Richard Nasr

USDCHF - Same Structure, Different Plays!!🏹USDCHF has been respecting its rising wedge structure beautifully.
📈We initially bought near the lower bound of the wedge, where buyers stepped in with clear support. 📉Later on, we sold near the upper bound, capitalizing on exhaustion at resistance. Classic structure-based trading.
⚔️Now price is rotating back toward the lower bound of the rising wedge, which aligns perfectly with a well-defined support zone. This intersection is where we’ll be looking for fresh trend-following long setups, as long as price shows acceptance and bullish reaction from this area.
🏹As long as the lower wedge support holds, the bias remains for another rotation higher within the structure. A clean break below would invalidate this bullish scenario and shift the narrative.
Same chart. Same structure. Different opportunities. 🤔
Are buyers ready to defend it again?
⚠️ Disclaimer: This is not financial advice. Always do your own research and manage risk properly.
📚 Stick to your trading plan regarding entries, risk, and management.
Good luck! 🍀
All Strategies Are Good; If Managed Properly!
~Richard Nasr

HOG TIED! Harley could be signalling the next recession.Maybe just a company specific short idea.
Or does Harley represent the broader American consumer confidence.
The sharp declines during the GFC and CV 19 certainly indicates a highly sensitive area of the economy --- Luxury motorcycles.
The core customer base is aging and younger riders are less drawn to big, expensive cruisers no doubt. Harley's attempts to pivot to smaller bikes and electrics have seen minimal sales.
In summary you have declining volatile revenue, margin pressure and large strategic uncertainty, so the market derates the stock even with one off decent Quarterly earnings.
That combo is producing a grinding downtrend or a broken chart.
Each rally on earnings beats get sold down as long money rotates out to other higher growth stories.
@TheCryptoSniper
#HuntVolatiltyFunnel

$RIVN $48+ Target in SightNASDAQ:RIVN breakout and backtest has us targeting $48+ at our next Fibonacci level. A trip from here to previous all time highs would be an 888% move to $180+. Just like NASDAQ:TSLA , NASDAQ:RIVN gets all the negative market price action that auto manufacturers face, but they gain the upside that tech stocks see.

Bitcoin breakdown risk intensifiesSitting in a rising wedge following an extended downtrend, traders should be on alert for a resumption of the broader bearish trend in bitcoin, putting a retest of the November lows, or even the year-to-date lows, on the cards.
The price is now resting against the November uptrend, with a breach of this level opening the door for another potential wave of selling. If we see a break of $87,800—the low set on 7 December, which sits beneath the uptrend—shorts could be considered with a stop above to protect against reversal.
The 1 December low just beneath $84,000 screens as an initial target, with a break beneath that level putting the 21 November nadir of $80,540 on the menu for bears. Should that target be achieved, traders could assess whether to cut, hold, or reverse the position depending on price action at the time.
With RSI (14) breaking its uptrend and moving further away from the neutral 50 level, it indicates downside pressure is building yet again, favouring bearish setups. While not yet confirmed by MACD, it too is curling over towards the signal line, moving closer to a crossover that would strengthen the bearish signal.
Good luck!
DS

MSCI macro wedge updateI have been following msci for a few months as I look to diversify away from tech with some of my gains from this year. MSCI is a great way to industry benefit from international market exposure, they have a very stable and safe business model.
Looking at the wedge you will note local low volatility in the blue, and contraction. The stock is pushing the top of the range on recent strength. I look for a push to 680 here next year with lots of support around 555.

Elite | EUR/USD – Structural Breakout + Demand RetestFX:EURUSD
Price has successfully transitioned from a multi-week range into bullish structure, confirmed by liquidity sweeps at the lows and a decisive break in the descending channel. The current retracement is retesting fresh demand — this zone will decide continuation power.
Structure Notes
• Strong downside liquidity sweep formed a base at 1.1500 zone
• Break of structure confirms bullish control
• Price now retesting 1.1580–1.1610 demand
• Holding this zone keeps upside continuation valid
Expectations
If bulls defend demand and structure holds, continuation targets become active:
🎯 Target 1: 1.1712
🎯 Target 2 (Main Liquidity Objective): 1.1878
Invalidation:
Break below 1.1580 weakens trend continuation and delays bullish projection.
⚠️ This analysis is for educational purposes and market observation only — not financial advice.

Could Altcoins bottom before BITCOINIn Q2 of 2026 vs a longer slower drawn out BTC bear that bottoms in Q3 or Q4 in line with the 4 year cycle which forecasts Oct/Nov of 2026.
It would surprise many participants in #Crypto
To see a still falling BTC price but #Ethereum, #SOLANA and select altcoins rallying on their /BTC pairs.
We shall be watching and monitoring.
What do you think?
This chart is of PULSEX a DEX on a Ethereum sidechain is pointing towards a pee off the roof inverted banana zone waterfall price action.
Which may correlate to an ETH decline sub $2k...?

GILD Technical Analysis – Daily TimeframeAfter a strong bullish impulse, GILD has entered a consolidation/corrective phase and is currently trading inside a rising wedge pattern.
Price is hovering near the lower boundary of the wedge and the 50-day SMA, making this area a key decision zone.
Bullish Scenario
If price holds support and breaks above the wedge resistance:
Targets
• Target 1: 130
• Target 2: 140
• Target 3: 150–155
Stop Loss
• Daily close below 118
Rationale:
An upside breakout from a rising wedge, supported by the 50 SMA, would confirm trend continuation and renewed bullish momentum.
Bearish Scenario
If price breaks down below the wedge and loses the 50 SMA:
Targets
• Target 1: 110
• Target 2: 100
• Target 3: 92–95
Stop Loss
• Reclaim and daily close above 123
Rationale:
Rising wedges often act as reversal patterns, and a downside break can trigger a deeper corrective move.
Very Short Summary
• Above 125 → Bullish continuation
• Below 118 → Deeper correction likely

BlackBerry still encrypts, just not phones anymoreBB closed the week at 4.28. The weekly chart shows a symmetric triangle forming after a fully completed falling wedge. The key point is that price has already reacted from the 0.618 Fibonacci level near 4.00, which aligns with the highest volume area on the Volume Profile and a clear demand zone. A golden cross between MA50 and MA200 on the weekly timeframe adds strong confirmation to the medium term bullish structure. As long as price holds above 4.00, the setup remains constructive with upside potential toward 6.00 and 8.35.
On fundamentals as of December 14, 2025, BlackBerry continues its shift into cybersecurity and software solutions. Fiscal year revenue is around 1.05 billion dollars, with steady growth in IoT and QNX driven by automotive and industrial contracts. Cash reserves exceed 250 million dollars, debt remains limited, and management is focused on margin expansion and strategic partnerships.
BlackBerry is no longer chasing hype, it is quietly building infrastructure.Sometimes the quiet names move first.

Selena | XAUUSD 1H - Trendline Support Retest + Liquidity Sweep FOREXCOM:XAUUSD
Gold remains inside a rising channel while forming repeated liquidity sweeps into the 4,200–4,210 demand region. The current consolidation shows compression toward the downside, indicating a likely sweep of the red zone before any bullish continuation.
A bullish continuation is valid only if price breaks and holds above 4,247–4,252, which unlocks upside targets at:
🎯 4,280
🎯 4,295
🎯 4,305 (major liquidity draw)
If the sweep fails and price closes below the trendline, bearish displacement may target the 4,160–4,175 liquidity block.
Bias remains bullish only above the channel midline.
⚠️ For educational purposes only. Not financial advice.

Ascending Channel | Golden Zone Retracement SetupAfter analyzing the chart on the 2-hour timeframe, price action has been moving within a well-defined ascending channel since Tuesday, 25 November 2025. The upper boundary of the channel has been consistently respected, confirming the strength and validity of this bullish structure.
Following a rejection from the upper boundary, price is currently trading around 1.17403. At this stage, the market appears to be developing a bearish corrective structure, resembling either an upper flag formation or a falling broadening wedge, which is still in progress and not yet completed.
Based on this structure and overall market behavior, we anticipate a potential retracement toward the Fibonacci Golden Zone, which aligns with our projected price target. This area may act as a key decision zone for the next directional move, especially if supported by price action confirmation and volume reaction.
Traders should monitor price behavior closely around the channel boundaries and Fibonacci levels for high-probability setups.
Happy Trading
SpicyPips

DYDX road map ! After the drop, the price can slightly bounce back up if buyers support it and we have a price correction. If the red trendline is broken, the price can move to the ranges we have specified.

USDCAD (daily)The price could rise from here to the top of the wedge, potentially reaching around $1.40

AAVE in Rising Wedge Near Major Descending TrendlineAAVE is forming a clear rising wedge structure after rebounding from the lower demand zone. Price is making higher highs and higher lows, but the range is tightening, showing loss of bullish momentum as it pushes into a major descending trendline.
This rising wedge is developing against higher timeframe resistance, which increases the probability of rejection. If price fails to break and hold above the descending trendline, the structure is likely to resolve to the downside. In that case, the next key demand area sits around one sixty to one sixty five.
For the bullish scenario, AAVE must break above the descending trendline with strong acceptance and volume. Such a move would invalidate the bearish wedge structure and open the path toward the two hundred to two hundred five resistance zone.
This setup is driven by rising wedge dynamics, trendline confluence, and structure compression. The reaction at resistance will define whether price continues higher or resumes the broader downtrend.
Confirmation is essential before taking directional trades.

PLN appreciating vs USD in 2026.PLN appreciating vs USD in 2026.
TV, LET ME SAVE THIS IDEA. I'LL FILL IT IN LATER, OKAY?
post covid/war breakout of descending wedge in 2022 was fake, now we're going back up.

MP shortDowntrend + Wedge (continuation pattern ), near resistance
Looks like Wave 12345 + Wave ABC
Stop 67,
Short entry 63
Target 45
Risk management is much more important than a good entry point.
I am not a PRO trader.
In my trading plan, the Max Risk of each short term trade should be less than 1% of an account.

Selena | XAUUSD – 4H | Bullish Continuation Setup 4400$ WaitingFOREXCOM:XAUUSD
Gold continues to build bullish structure after forming accumulation in the previous range zone. The market broke out, retested demand, and maintained higher-lows inside the ascending channel. Current pullback into the Entry Zone (4122–4140) aligns with channel support + demand, suggesting potential continuation toward the upper boundary and major resistance around 4380–4410.
Key Scenarios
✅ Bullish Case 🚀
Hold above demand zone + channel support:
🎯 Target 1: 4320
🎯 Target 2: 4380
🎯 Target 3: 4410 (final top channel line)
Trigger: bullish rejection or bullish engulfing from 4122–4140.
❌ Bearish Case 📉 (Invalidation)
Break and 4H close below 4052 (Invalid zone):
🎯 Downside Target: 3990 → 3920 strong support
Current Levels to Watch
Resistance 🔴: 4320 / 4380 / 4410
Support 🟢: 4140 / 4122 (Entry Zone)
Invalidation: 4052
⚠️ Disclaimer: This analysis is for educational purposes only. Not financial advice.
