A Very Possible Temporary Fall; NZDJPYGood Day All,
First and Foremost I would like to clarify, I consider this trade RISKY , Please do significant analysis first before executing!
Looking around, NJ caught my eye, seeing its recent rejection at price level 88, I predict it'll fall temporarily.
The reason I consider this trade as risky is because the long standing trend on the 1D seems bullish but I hope to see it fall by 3 -5 price points before correction and readjustment towards higher levels.
As you may have noticed this is a weekend/swing trade being one of the main causes of my own worry, not to mention JPY red-level news coming in soon.
So, if you do decide to open this trade, please do use significantly low lots due to the higher risk this trade poses.
As I said in all my past predictions, while I do not mind others benefiting from my predictions, I would hate to see others lose cause of my own.
Recommended Order: Market Sell or sell after price shows continuation beyond 84.776
Take Profit 1 : 83.9
Take Profit 2 : 82.9
R/R Ratio TP 2: 1.41
R/R Ratio TP 1: 0.85
Stop Loss : 87.225
Prediction Nullifying Requiems: Price out of bounds or beyond the 1 W mark.
P/S: Do Consider Adjusting The SL via ATR before letting it run.
Good Luck & Good Hunting.
Weekend

tightenting range appears to have broke bearqqe and sss are short amc. smart money is selling this. a series of higher lows and lower highs appears to be breaking to a lower low. overall this name has entered a slow bleed. its probably not worth $33. id liketo see this back under mid $8s.

AMZN | Bearish still potentially continueAmazon is one of growth stocks with more than 20% growing sales per year. This growth sales likely will continue in future potentially with larger reached customers by Amazon. I do not have any significant complaint about the fundamental of Amazon, except for the high valuation of stock. According to the lowest P/E in the last 7 years, US$ 109 seems reflected the P/E. Probably that is the reason, AMZN rebounded around 101.87 lately.
But, technically, I still see bears pressure strong on the AMZN. And AMZN still has a high chance to breakdown 101.87 and going lower. Right now, AMZN moving sideways and has a high chance to test again near resistance around 125-129. Only if bulls can break the resistance, and maintain price above it, then we can expect AMZN will stop the dropping. Otherwise, AMZN is continuing going lower and making P/E lower and more attractive to investors.

Mondays are Red🩸 Ends are Weak💤 Yet we Rise✔️Wishes for a nice weekend everyone.
Weekend are the end of the week and I am guessing you had figured that out already.
70% of the last 10 weeks Crypto had a boring 'weak' end on Saturdays and Sundays (the weekend).
At the same time, 6 out of 10 Mondays were in deep red colors with the market having it's worst days during the beginning of the week.
Yet again the Crypto Total Market Cap (excluding BTC and ETH( has risen around 30% since June 18 lows.
Why is that?
Well, maybe Retail investors like most of the people here are out of buying power and we depend on (mostly US) institutional money to kick in and buy something.
Maybe again it's the summer and weekends are meant to be spent on the beach.
A friend from Romania says it's the 'Market makers weekend' and that they 'Pump and Dump' to liquidate bored retailers while they are having Mojitos on the beach🍹🌞.
(I don't know about that but it's worth mentioning. Salut Marius!)
What do you think? Is there a pattern we can trust (buy mid week and sit out at the end?)
In any case Professor is hoping for a PUMP.
We want our Weekends back Crypto!
One Love,
the FXPROFESSOR
Ps. If we had bought the Monday dips we could had retired already 🍹

Bullish case for Bitcoin in the WeekendBitcoin is currently in a Bus to the top of the Hill. Let's see if this plays.


DXY contiuned bullish move?Looking for continuation to the upside.
Price has already retraced into structure, potential for a further move down to the 98.37 area the bounce from there.
If price in the DXY continues to move up, consideration for all dollar pair's to move towards the upside.

Being a weekend trading warriorYour results on Monday will be influenced by the work that you do on the weekend, specifically Sunday.
As an intraday trader I constantly think about my trading.
Here are a few points which every trader should focus on,
1 - Mapping our mental weaknesses
We all have mental challenges, some of us have a lot of FOMO,
while others oversize and over trade, you know what is holding
you back as a trader... FIND IT AND WORK ON IT!
2 - Reviewing trades (winners & losers)
Search for the plays where you can add size,
search for patterns that you can exploit next week,
review your best trades. What trades worked best for you?
more of these on Monday. What trades are not working for you? Eliminate them.
3 - Checking for key levels & patterns
The best in every industry practice and train... yet probably 90% of traders never
really do any kind of practice, they search for a strategy and then cannot wait to apply
it to the markets... real traders work on their trading hence they create REAL SKILLS!

Here is why I suggest you should use the SUPER TREND!I see the weekend is here. A new week is about to begin, and it's time to get organised, reflect on your progress so far, and learn something new to help you achieve your trading goals., and boost your profitability.
Let's be honest, I am someone who normally likes to follow the trends. A lot of the trend following indicators I've encountered along the way in my professional and career growth haven't made sense to me. Moving averages, Average Directional Index, Moving Average Convergence-Divergence, Parabolic SAR etc. I always had a lot concerns with the indicators being able to swiftly follow the price movement, as well as identify a clear reversal of the underlying trend. However, I came through to find this SUPER 'super trend' indicator some while ago, and by testing this and adding it to my intraday trading strategy, I finally see that I could rely on one single indicator to help me identify the trend quickly and more efficiently (never 100% of course it is still not a holy grail!) but the results were good enough for me to write down this post to you guys.
What is the Super trend indicator?
'Super trend,' as the name implies, is a trend-following indicator, similar to moving averages and MACD. It is plotted on prices, and the position of the prices reflects the current trend. When we build the Super trend indicator, the default settings are 10 for the ATR and 3 for the multiplier. The average true range (ATR) is important in 'Super trend' since it is used to determine the indicator's value and it indicates the degree of price volatility, which is one reason why this indicator beats Moving averages, which disregards price volatility.
Super trend Indicator Formula
The super trend indicator computation is illustrated below–
Up = (high + low / 2 + multiplier x ATR)
Down = (high + low) / 2 – multiplier x ATR
Average True Range = / 14
The number 14 represents a period in this context. As a result, the ATR is computed by multiplying the previous ATR by 13. Add the most recent TR and divide it by the time.
As a result, ATR is an essential component of the supertrend technical analysis indicator.
How to Use Super trend Indicator to Identify Buy and Sell Signals?
Super Trend, as a trending indicator, performs well in trending markets (both uptrends and downtrends). When the indicator flips over the closing price, it is easy to identify a buy-sell indication. When the Super Trend closes below the price and the colour turns to green, a buy signal is issued. A sell signal is generated when the Super Trend closes above the price and the colour of the Super Trend changes to red.
There is no such thing as a 100 percent accurate technical indicator, and Super Trend is no exception. It also produces erroneous signals in sideways markets, however it produces fewer false signals than other indicators. As a result, you may use Super Trend in conjunction with other indicators to provide more accurate trade signals.
Follow my daily analysis posts on my account to check out how to combine it with other momentum indicators as well as use it for multi-time frame analysis!

LONG after Weekend BreakWeekly Timeframe
Greed and Fear Index is now at #25. Weekly timeframe remains bearish saucer with the awesome oscillator. We can expect a sell off Friday. As a normal routine of the market.
1D Timeframe
We have touch the 0.618 FIB retracement area and bounce a little. AO is bullish we can expect movement to the upside with our Ichimoku cloud finding support in $40,253.
4H Timeframe
We are currently testing the demand zone of the market structure which in turn would continue our drop to the downside as the smart money will buy back this retest to continue the dump to the downside. all being controlled by a bot or algorithm. Rejection area $40,912. AO seems bearish at the moment as it is already in the correction area.
We will discuss more on the possibility on our Live. Stay tune and check with us!
Want more insights before US market open? Hit Like, Share, and Subscribe for more daily trading tutorial & cryptocurrency news
Trade Scholar, the best cryptocurrency educational community online!
Find the content above difficult to understand?
Feeling lost about how to trade?
Want to learn how to do your Own Price Prediction?
We endeavour to share you our investment knowledge & experience in order to help you starting your path to financial freedom. Follow, Subscribe & Join our Community to trade together!
Disclaimer: Above Technical Analysis is pure educational information, not Investment Advice. The information provided on this post does not constitute investment advice, financial advice, trading advice, or any other sort of advice and you should not treat any of the website's content as such. Do conduct your own due diligence and consult your financial advisor before making any investment decisions.

Market Update. SPY/S&P Week 2/7 Week TraderMan PennyPorkChop looks out for opportunity to survey and examine the latest value activity in the market in a way that makes it helpful to you.
Utilizing Technical Analysis, I play out an insiders view of the activity in the financial exchanges today and gives you my Day Trading of 6 years of Trading Volatile current market , examining market patterns , and interpreting of where the market is going.
TraderMan PennyPorkChop Focus incorporates - Specialized Analysis - Exchange and market Education - Pattern and Pattern Analysis - Market Psychology - and Trading Mental Health.
👉 If you enjoy this video, Please like and share it.
👉 Don't forget to subscribe to this channel and press the bell 🔔 for more updates.
SPY Stock Analysis - S&P 500 SPDR ETF Stock Price Prediction for Tomorrow Monday
February 7th We go over the SPY stock - S&P 500 SPDR ETF stock, and give our stock price prediction on the SPY stock, our SPY stock price analysis, and stock price forecast on SPY for tomorrow Fri February 7th.
SPY STOCK: THIS IS A SPY STOCK PRICE PREDICTION, SPY STOCK PRICE ANALYSIS, AND A SPY STOCK PRICE FORECAST VIDEO.
. My Ideal Views are looking for new ways to think about Trading.
. No BS Technical Analysis that works, period.
. Day Trading and Swing Trading.
. New Traders Welcome.
.Swing Traders Welcome.
. You get Daily SPY STOCK pre and Post Market and the Price Spy ETF price predictions Weekend editions.
. TESLA stock along with TESLA share Price including Tesla After Hours.
DISCLAIMER: No financial advice, the information on this channel is provided for education and informational purposes only, without any express or implied warranty of any kind, including warranties of accuracy, completeness, or fitness for any particular purpose. The information contained in or provided from or through this channel is not intended to be and does not constitute financial advice, investment advice, trading advice or any other advice. The information on this channel and provided from or through this channel is general in nature and is not specific to you the User or anyone else. You should not make any decision, financial, investment, trading or otherwise, based on any of the information presented on this channel without undertaking independent due diligence and consultation with a professional broker or financial advisory.
____________

BTC/USD: A Christmas Weekend Study FUNDAMENTAL BACK-DROP
*Imho, if there was ever a time to expect fireworks, it's right now.
*Weekend trading session for the next ~2 days. Institutions and majority of players are offline for Christmas day and/or weekend. Perfect environment for fuckery.
*US holidays, and Christmas in particular, are proven to be powerful market events. (Often see pivots in price/sentiment through these windows).
*"Buy when it snows, sell when it goes." - it's that time of year!
**Recent CME event (listing ETH micro futures ) on Dec. 6
**Positive reaction from most recent FOMC meeting on Dec. 15
**Recent full moon phase change on Dec. 20
LOWER-TIME-FRAME TECHNICAL ANALYSIS
*Structurally, price is trading within a megaphone pattern (making higher highs and lower lows). This implies high volatility in both directions until the megaphone is resolved.
*Certainly trading against some key highs right now (top end of the range). In good shorting/selling location right now for people who think this rally into Christmas is bulslhit.
HIGHER-TIME-FRAME TECHNICAL CONTEXT
*Price is coming awfully close to triggering a major double bottom , drawn off the 1D chart. (The counter-trend rally high following Dec. 4 liquidation cascade).
*$51,995 is the level to watch. I'm officially "uber-bull" if we start closing above this level.
*Bullish momentum divergence confirmed ( MACD ) and continuing to build on the 1D chart.
--
LIKE THE ANALYSIS?
Send me a DM . I'd like to build a community of half decent traders and technicians.

BTC Weekend movementShort term movement, broke the value area of the day to the downside, nearest untouched POC is around 56600 which is between the .382 and .236 retracement fibs for a healthy pullback. Looking at 57300 to put up some support before further downside to 56. Be safe this weekend!


BTC H&S forming?BTC Touched support at daily close, but is trying to get back into the channel.
Testing the Resistance but having a hard time breaking this zone, with the volume being low this weekend we might see a breakout under the support zone towards the 0.786(52.5k) Fib zone.
It looks like we are forming a H&S Pattern here, which could confirm my bearish thoughts.
If BTC doesn't prove itself at the end of the weekly close we could be seeing this pattern play out, placing us between the 52.5k and 50k area.
For now this weekend is looking weak, and trading alts on high leverage could prove very risky.
I also wont advise tunnel visioning into shorting the market right now.
If you feel like trading keep the leverage LOW and the Stop-loses tight.
Be careful everyone, And so will we with our signals.

SOLUSDT VETUSDT ETHUSDT BTCUSDT Pump & UpdateHey, Been a few days, i started a T-Shirt designing brand of all things. Obnoxiously Humorous T-Shirt and been doing that the last week or more while its been boring waiting for markets. Can find it by the same name on Facebook group & page.
Now, when the market pumps like this you might get more out of it over the weekend. But its a strong pump and a good point to take little profits off the table on those trades I recorded about last week or so ago on VETUSDT, DOTUSDT.
Take profits. Taking a profit is never a bad thing. A win is a win and you live to fight another day. If you die you can't fight at all. Any win is a good win.
SOL bounced amazing exactly as predicted. The evidence is in my prior vid.
Check ya next time. Be patient things will pick up into Christmas and after. Very surprised if it goes the other way.

Weekly Market Wrap (29th August 2021)This is Weekly Market Wrap. It is not market analysis. Its purpose is to serve as quick overview of the close price for particular securities ending week 27th August 2021.
Forex (27th August 2021):
EURUSD – Close price = 1.17958 USD
EURGBP – Close price = 0.85658 GBP
EURCAD – Close price = 1.48739 CAD
EURAUD – Close price = 1.61269 AUD
USDGBP – Close price = 0.72667 GBP
USDCAD – Close price = 1.26101 CAD
USDAUD – Close price = 1.3670 AUD
Commodities (27th August 2021)
Gold ( XAUUSD ) – Close price = 1817.425 USD
Silver ( XAGUSD ) – Close price = 24.027 USD
WTI oil ( USOIL ) – Close price = 68.65 USD
Brent oil ( UKOIL ) – Close price = 72.56 USD
Indices (27th August 2021)
Nasdaq (NDX) – Close price = 15432.95 USD
SP500 (SPX) – Close price = 4509.38 USD
DJIA (DJ:DJI) – Close price = 35455.81 USD
Russel 2000 (US2000) = 2270.57 USD
DAX ( GER30 ) – Close price = 15851.751 EUR
Hang Seng ( HSI ) - Close price = 25407.90 HKD
Disclaimer: This content is not a financial advice.

The weekend is when the deep work happensWhat do you use your weekends for?
The Forex markets are closed, but your mind shouldn't be. This time is best used reviewing and learning about the week before.
Take this trade for example, it had it all-5min Buy range, Change of character, BOS, 1min buy range, pull back to the equilibrium, pull back to range impulsive move. This happened later Friday night my time, however by reviewing it I get to see how good this trade would have been for those awake.
As always trade safe, I'll see you on Market open!
EnvisionEJ

SPY Weekend UpdateSymbol: AMEX:SPY
Indicators
Laguerre RSI
ALMA x2
Thoughts...
SPY is at all time highs so we should expect some hesitancy. I wouldn't be surprised to see a test of the grey support line.
Things to Note...
The lagRSI on the 45 minute time frame is starting to get shaky which could signal a big move... We will have to see if we cross above the upper line to see a bit of selling pressure.

BTC bearish or bullish? Looking at BTC I can see some sort of accumulation during the last days.
Having a accumulation before the weekend may represent the beginning of a distribution phase.
I am not bearish on BTC. It looks healthy and if there is a small drop during the weekend that may be the beginning of a good uptrend that may bring us up to 42K if the is enough volume.
There is no reason to panic if the weekend brings some bearishness in the chart, it is normal and we can expect some good profit during next week if things do not change too much.
Have a good weekend and take care.

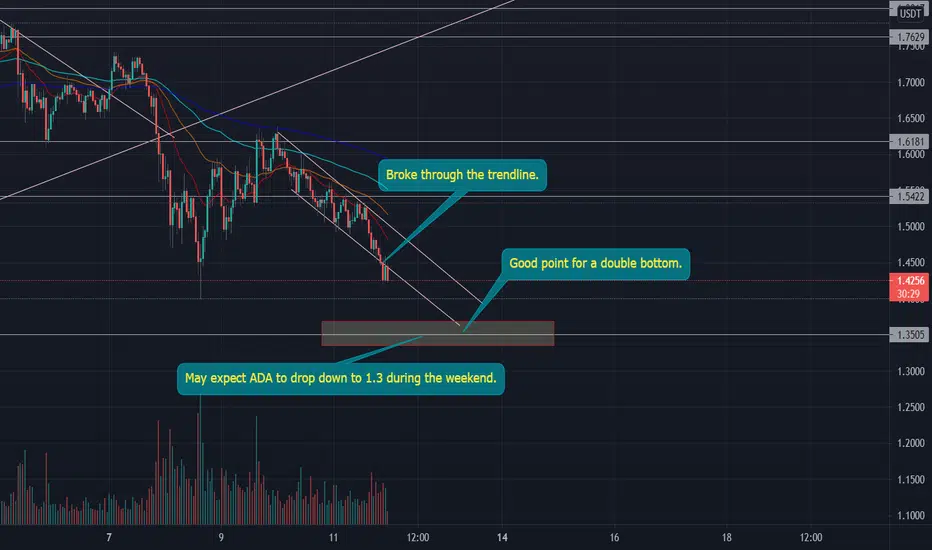
ADA double bottom during the weekend? ADA looks a bit bearish now. It broke through the trend line and this may bring it down to 1.35/1.3 during the weekend.
If it stops at 1.3 we may expect a double bottom formation that might show us a future uptrend.
Make sure to place your stop loss and buy if it goes any lower. I am not expecting it to drop below 1.3. If it does it may be for a short amount of time.
Have a nice weekend and take care !
SOL what to expect during the weekend? SOL is going down after a strong push up during the week.
We may expect it to drop to 32 dollars if the trend line is not going to be a strong support as expected.
Make sure to place your stop loss or to buy if it drops even lower during the weekend.
A good buying point is down to 32 dollars if it find support down there.
Have a nice weekend guys !

