X-indicator
XAUUSD Aggressive Scalp Swing LongOANDA:XAUUSD XAU/USD – Aggressive Scalp/Swing Long (15m timeframe) – Updated Signal Entry Zone: 4,280 – 4,285 (buy limit or market if already bouncing)
Stop Loss: 4,274 (tight, just below today’s low – risk max 9–11$)
Take Profit Targets: TP1: 4,295 – 4,297 (quick scalp – 50–60% position)
TP2: 4,308 – 4,313 (main target – previous highs + upper red zone)
TP3: 4,325 – 4,330 (runner if we get strong follow-through)
Risk/Reward: 1:2 up to 1:5 depending on how many targets you let run Confluence & Reasoning (right now): Price just printed a strong bullish engulfing + pinbar reversal exactly at 4,280 demand
Holding the blue ascending trendline for the 4th time
Higher-timeframe daily trend still very bullish (Gold > 4,200 = structural bull)
Volume spike on the reversal candle
Risk events mostly priced in, safe-haven flows supporting
Execution tips: If you’re not in yet → buy the break & close above 4,288 for confirmation
Already in from 4,280–4,285 → move SL to breakeven now
Partial at 4,295–4,297, let the rest run with trailing stop
#Gold #XAUUSD #GoldTrading #XAUAnalysis #Commodities #DayTrading #SwingTrading #NotFinancialAdvice This is NOT financial advice. Trading involves high risk. Always use proper position sizing and manage your own risk.

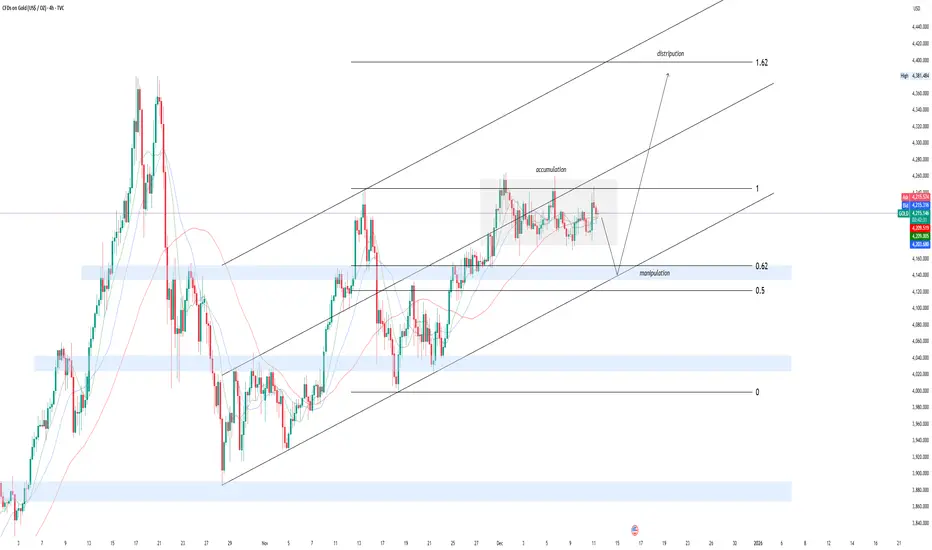
Gold Analysis: Fed Cut Ignites Rally Toward $4,300 TargetFXOPEN:XAUUSD GOLD ANALYSIS Bulls Target $4,300 as Fed Cut Sparks Fresh Momentum (Dec 12, 2025)
Welcome back to Trade with DECRYPTERS
🌍 MARKET OVERVIEW
Gold climbed to $4,224 on December 11, hitting a one month high after the Fed’s 25bps cut weakened the dollar and boosted safe-haven demand. Lower real yields and expectations of further easing in 2026 kept bullish momentum strong, supported by heavy central-bank buying led by China.
Geopolitical tensions, including the U.S. seizure of a Venezuelan tanker, added extra upside fuel. Silver also broke records above $64/oz, reflecting broad strength across precious metals. Analysts now eye $4,300–$4,400 into year-end, with volatility likely around upcoming NFP data.
📊 KEY FUNDAMENTALS
• Current Price: $4,268/oz (slightly lower intraday, -0.3%)
• Valuation Context: ~137% above 20-year avg.; ATH at $4,381 (Oct 2025)
• Global Reserves: ~36,000 tonnes; U.S. holds 8,133 tonnes (23% of total)
• Supply (Q3 2025): 1,313 tonnes — mine output 825t (+1.5% YoY) + recycled 344t (+6% YoY)
• Demand (Q3 2025): 1,313 tonnes (+3% YoY) driven by central-bank buying (220t Q3; 634t YTD) & strong investment flows
• YTD Performance: +61%, outperforming S&P 500 by 2.4×
• Outlook: Structural bullishness intact; 12-month forecasts near $4,465/oz
🌐 GEOPOLITICS
1️⃣ Russia Ukraine War
• Persistent conflict, sanctions, and NATO tensions keep volatility elevated
• Safe-haven demand remains strong
2️⃣ U.S. China Trade Tensions
• Trump’s 100% tariffs reignite the trade war, weakening USD
• BRICS pushback & China’s gold accumulation accelerate de-dollarization
3️⃣ Middle East Instability
• Gaza escalation & Iran-backed proxy attacks heighten global risk
• Temporary dips but repeated surges above $4,000
4️⃣ De Dollarization & BRICS Strategy
• Central banks accelerate gold buying to hedge USD weaponization
• 95% of global central bankers plan further gold purchases in 2026
5️⃣ Global Debt & Systemic Risks
• $324T global debt and U.S. $2T deficits fuel inflation fears
• Gold gains long-term support as trust in fiat declines
🔄 RISK-ON / RISK-OFF ANALYSIS
Gold’s +61% YTD surge reflects classic RORO flows, supported by stable yields & a weaker dollar. With the 10-year at 4.16%, opportunity costs stay low. Only a rise toward 4.5% could pressure prices back toward $4,000.
The DXY at 98.38 enhances gold affordability, where each 1% drop historically adds 0.5–1% to gold, amplified by 500+ tonnes of central bank buying.
Despite a low VIX (15.41) and strong equities (+30% YTD), gold continues to rally an unusual divergence driven by tariffs, inflation risk, and persistent geopolitical tensions. A VIX spike above 20 typically accelerates gold, while deep risk-on conditions may cause a 10 to 12% pullback.
📰 KEY INSIGHTS FROM CREDIBLE SOURCES
• Goldman Sachs reaffirmed a $4,900 target citing massive central-bank demand
• Gold & silver jumped ~1% on Fed dovishness & liquidity expansion (TGA -$78B)
• Fed plans to buy short end Treasuries → weaker USD → stronger gold
• Trump’s “run it hot” growth narrative boosts expectations of lower real yields
✅ CONCLUSION
Gold remains strongly bullish as macro conditions, Fed easing, and central bank accumulation create a solid structural floor above $4,150. Pullbacks are temporary, while geopolitical tensions and tariff-driven USD weakness support moves toward $4,300 - $4,400.
Subdued real yields keep opportunity costs low, and even in risk-on markets, gold's resilience highlights deep institutional demand. Momentum favors upside continuation into year-end unless yields spike aggressively.
🙌 SUPPORT THE ANALYSIS
If this breakdown added value to your trading:
👍 Drop a like
💬 Comment your levels
📈 Share your charts with the community
Let’s grow together.
Best Regards,
M. MOIZ KHATTAK | Founder - TRADE WITH DECRYPTERS

SPY 15 Min Analysis for Dec 12Market Structure Overview (15m)
SPY continues to trade within a rising intraday structure, supported by a clean ascending trendline that has guided price since the early morning session. After rejecting near 691–692, SPY began a controlled pullback and is now sitting in the mid-688 area, roughly at short-term equilibrium.
The current consolidation is forming higher lows, which keeps the intraday trend bullish as long as price holds above the lower boundary near 682–683.
The upper region between 689–692 has repeatedly acted as rejection, forming a short-term supply zone. This zone is important because buyers consistently lose momentum there.
How Options Positioning Aligns With Price (GEX Interpretation)
When we compare the 15-min chart to SPY’s options-based positioning, the key levels line up tightly:
1. Strong resistance at 691–692
On the options side, this region corresponds with the highest positive positioning.
• When calls dominate at a level, market makers hedge by selling shares, creating resistance.
• This explains why every attempt into the 691–692 zone gets rejected—price is hitting a region where hedging flows naturally push it downward.
2. Support aligning with 683
There is a notable put-heavy zone in the 682–683 region.
• When puts accumulate at a level, hedging often requires buying shares, which creates support.
• SPY bounced exactly from this level earlier, confirming that the flow-based support matched the chart’s demand zone.
3. Mid-range magnet near 687–688
This region shows a mix of lighter call and put positioning—often creating a “balance” area where price gravitates between bigger hedging zones.
• That explains why SPY is currently stabilizing there into the close.
The harmony between trendline structure and options flow positioning increases confidence in these zones acting as reaction points for tomorrow.
Key Levels for Dec 12
Upside levels:
• 689.00 – First reaction zone
• 691.15–692.00 – Major resistance where sellers have repeatedly overwhelmed buyers
Downside levels:
• 687.50–686.50 – Immediate intraday support
• 683.00 – Strong demand and hedging support
• 682.20 – Final downside pivot
Trading Scenarios
Bullish Case
SPY needs to hold above 687–686 and reclaim 689 with strength.
A strong breakout over 691–692 opens the door for continuation, but this level remains the most important resistance due to both structure and options-based hedging.
Bearish Case
A breakdown below 686 signals weakening demand.
A bigger move opens only if SPY cracks 683, aligning with both chart support and a major options hedging level.
Below that, momentum accelerates.
Overall picture:
SPY’s intraday structure is bullish but fading in momentum.
The most important thing is how tightly the 15-min chart and the options positioning agree:
• 692 = structural + hedging resistance
• 683 = structural + hedging support
• 687–688 = fair value magnet range
When chart structure and options positioning form the same zones, the reactions tend to be cleaner and more predictive—something traders often use to anticipate the next session’s flow.
Disclaimer
This analysis is for educational purposes only and does not constitute financial advice. Always manage your own risk before trading.

TSLA Dec 12. Compression at a Key Breakout PointTSLA has been consolidating inside a tight compression structure on the 15-minute timeframe, sitting between a rising support line from the midday recovery and a descending trendline from the earlier rejection. Price is now coiling right at the apex of these two lines, which typically sets up a decisive move once the market opens.
The 447.5–448 zone is the immediate intraday pivot. TSLA paused there at the close, and every small push above it was quickly absorbed. As long as price remains beneath the descending trendline, momentum remains neutral-to-bearish within the consolidation.
Above price, the next major supply sits at 450–452. This level caused a sharp rejection earlier in the session and continues to be the key ceiling that sellers defend. A clean break above 448 followed by a hold above 450 would shift momentum in favor of buyers and allow TSLA to challenge the higher levels inside its previous range.
On the downside, the rising trendline around 445–445.5 is the first support. If TSLA loses this line, the next support zone is 443.5–444. Below that, the breakdown opens space toward the lower demand zone around 437–435 where the buyers last stepped in aggressively.
The options landscape (GEX) matches these same transition levels.
The strongest positive gamma concentration sits between 455–457.5, which aligns with the upper resistance zone. This explains why TSLA repeatedly struggled to extend into 452–455 earlier — price was hitting both chart resistance and hedging resistance at the same time.
Before TSLA can reach those levels again, it must reclaim 448–450. If it does, hedging pressure begins to open up, allowing for a smoother path toward 452 and then 455.
On the downside, negative gamma pockets begin around 437–435. These levels align perfectly with the lower structure targets. If TSLA breaks below 445 and slips into these negative gamma zones, volatility tends to expand instead of being dampened. That is the environment where TSLA can slide quickly into 437–435.
This alignment between price structure and GEX creates a clear plan for Dec 12:
• Holding above 447.5 increases the chance of a breakout attempt toward 450
• Reclaiming 450 is the key signal that buyers have regained control, opening targets at 452–455
• Losing 445 shifts control to sellers and targets 444 → 437–435
• Breaking 435 releases deeper negative gamma and increases the chance of sharper downside movement
TSLA is sitting at the very end of a compression pattern. The next clear move through either 450 or 445 should define the direction for tomorrow’s session.
This analysis is for educational purposes only and not financial advice.

GOOGL Dec 12 Sliding Downward Channel. Key Support Now in PlayGOOGL has been moving inside a clean descending channel on the 15-minute timeframe after the sharp rejection earlier in the session. Each bounce continues to form lower highs, and price remains pinned under the channel’s upper boundary. That trendline has now rejected price multiple times, signaling that sellers are still in control until GOOGL can break above it with strength.
The mid-zone around 313–315 is acting as the key intraday decision area. Buyers attempted to stabilize here, but each rally into 315 met resistance, and the latest candles show hesitation beneath the trendline. Unless GOOGL can reclaim 315 and close above the channel’s upper line, the structure remains bearish.
Below price, the channel’s lower boundary aligns with the 308–309 support zone. This area held earlier and became the base of the channel. If GOOGL breaks under 310, the channel suggests room for continuation toward 308–307, where buyers previously stepped in aggressively.
Now looking at the options landscape, the GEX levels line up tightly with these structural turning points.
The 315 level, where GOOGL stalled repeatedly, corresponds with a significant positive gamma band. When price moves into these upper positive-gamma regions, dealer hedging typically dampens momentum. This explains why every push back into 315 fades—it’s not just chart resistance, it’s an area where hedging flows naturally limit extension.
Above that, the next major positive gamma levels sit around 322–324. These levels represent the top-end call concentration. To reach that area, GOOGL would need to break the descending channel, reclaim 315, and hold it. If that happens, the hedging pressure that previously contained price begins to release, and volatility can expand upward, opening a path toward 320+.
On the downside, negative gamma levels align with the lower channel targets. The cluster around 310–308 shows where downside movement can accelerate. If GOOGL loses 310, the options positioning shifts into a zone where dealer hedging amplifies volatility instead of controlling it. That is exactly the environment where channel breakdowns can follow through cleanly.
The correlation between the descending channel and the GEX positioning creates a clear roadmap:
• Holding below the channel’s upper trendline keeps the bearish structure intact
• A move above 315 signals strength and opens the path to 318 and potentially 322 if momentum builds
• Losing 310 confirms continuation within the downward channel toward 308–307
• Below 307, negative gamma increases the chance of sharper moves
GOOGL is moving cleanly within its channel, and the options landscape supports both the rejection zones above and the acceleration zones below. Dec 12 is likely defined by how price interacts with 315 on top and 310 underneath.
This analysis is for educational purposes only and not financial advice.

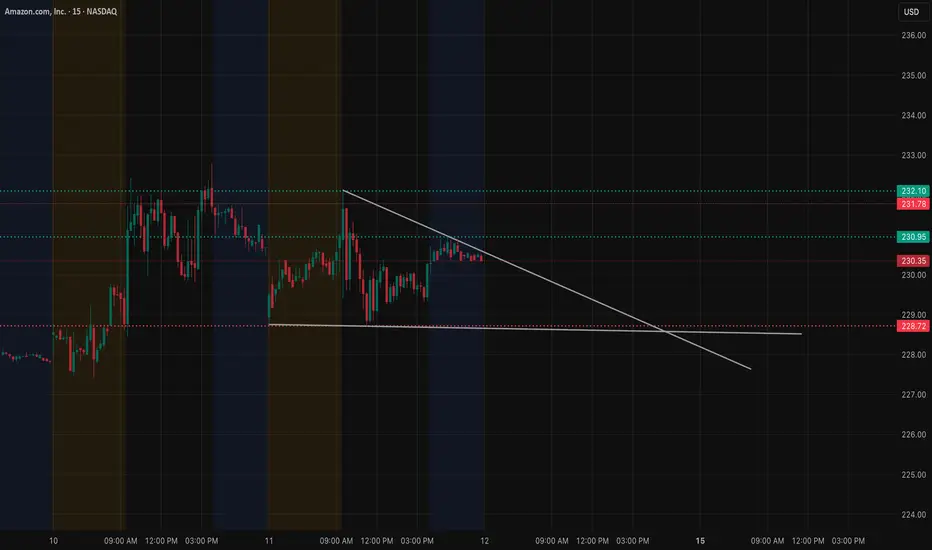
AMZN Dec 12 Compressing Under a Key Trendline. Will it break?AMZN has been trading in a contracting structure on the 15-minute timeframe, respecting a downward trendline that has repeatedly rejected price. Each attempt to push through the 230.50–231 zone has been met with selling, keeping AMZN stuck under this tightening resistance. The price action has formed a clean triangle compression: lower highs from the trendline and a flat demand shelf around 228.50–229.
The reaction around 228.50 is especially important. This level has acted as a base multiple times across the last two sessions, and buyers consistently stepped in to defend it. If AMZN loses this level, the structure breaks and volatility opens up quickly.
Inside this compression, the candles continue to shrink—classic behavior before a breakout or breakdown. AMZN doesn’t have much room left. The market will likely choose direction early.
Now looking at the options landscape from GEX chart below, the GEX levels line up with the structural pressure points almost perfectly.
The strongest positive gamma resistance sits between 232–234. This aligns with the upper green zone shown on the chart. When price approaches these high positive-gamma regions, dealer hedging tends to limit extension, which explains why AMZN stalls every time it tries to climb into 231–232. It’s where momentum repeatedly fades.
If AMZN does break above the trendline and establishes support above 231, the hedging pressure that capped price begins to unwind. That creates room for AMZN to make a controlled move toward 232.5 first, and if volatility expands, 234 becomes achievable.
Below price, negative gamma begins to appear just under 228. The first key pocket centers around 227.5–226. This area aligns exactly with the flat support zone from the 15-minute chart. If AMZN loses 228.50 and slips into this negative gamma pocket, dealer hedging accelerates volatility instead of containing it. That opens the door for a deeper move toward 225, which also appears as a defined support zone on both price structure and GEX levels.
When price structure and GEX positioning both point to the same inflection zones, the setup becomes much clearer.
For Dec 12, AMZN’s path depends on how it resolves this triangle:
• Clearing the trendline and holding above 231 shifts momentum toward 232.5 and potentially 234
• Rejection at the trendline keeps AMZN inside the compression, likely leading to more chop
• Losing 228.50 turns structure bearish and aligns with negative gamma flow toward 227.5–226
• Losing 226 exposes the deeper target near 225
AMZN has been coiling for two sessions. The next breakout or breakdown should be directional.
This analysis is for educational purposes only and not financial advice.
BTC (Daily)- Bear Flag pattern is forming.
- Take note of the support zone below if price breaks down from the Flag.

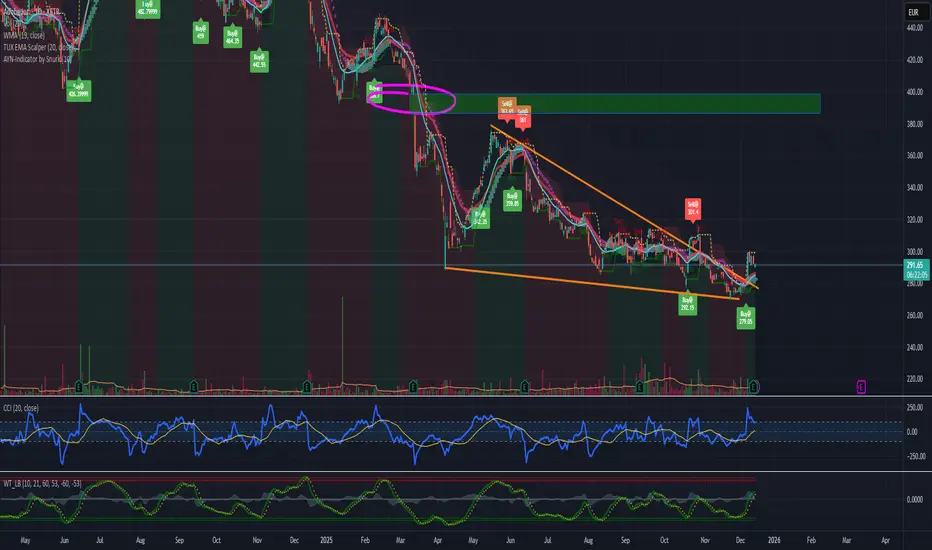
ADB reaching its bottom?Hi,
Just a note for myself.
Clear bottom structure, long term disembarking.
Profitable company, industry leader.
Estimated revenue and profits -> growing.
EPS growing.
Additionally have clear buy signals and falling triangle breakout.
My expectation is to see 450 in 2026.
BUY!
AG
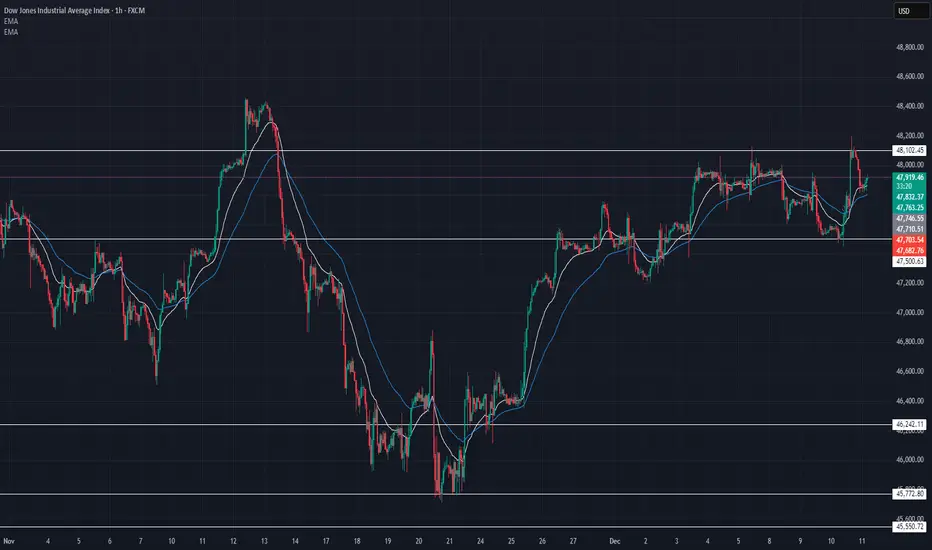
US30 Technical Breakdown – 12/11/2025📍 US30 Technical Breakdown – 12/11/2025
US30 rejected sharply from the 48,100–48,200 resistance zone, creating a clean wick rejection before pulling back into the mid-range. Despite the selloff, the broader structure remains bullish as long as price holds above 47,700, but momentum has clearly cooled with EMAs flattening out 🔍📉.
📊 Market Behavior:
🔹 Strong rejection from 48,150 — sellers defending heavy supply
🔹 EMAs tightening → momentum slowing after the push
🔹 Price stuck in a wide consolidation between 47,700–48,150
🔹 Bulls still defending higher-timeframe structure
📌 Key Levels:
🔹 Resistance:
48,150 → major supply / rejection zone
48,000 → intraday reaction level
47,930 → current retest zone
🔹 Support:
47,700 → immediate support (key for trend continuation)
47,500 → deeper intraday demand
46,960 → strong structural support if market breaks down
🧠 Bias:
Neutral-to-bullish above 47,700 📈
📈 Break & close above 48,150 → opens path to 48,300 → 48,500
📉 Lose 47,700 → downside opens toward 47,500 → 47,000
💡 Trade Ideas:
🔹 Bullish Setup:
Entry: 48,020 (break + retest above resistance)
TP1: 48,180
TP2: 48,320
SL: 47,820
🔹 Bearish Setup:
Entry: 47,680 (loss of support)
TP1: 47,500
TP2: 47,300
SL: 47,850
🎯 Summary:
US30 rejected the 48,100 resistance zone and is now rotating back toward support. Bulls remain in control on the higher timeframe, but short-term momentum has slowed. Watch 47,700 closely — hold = continuation, break = correction 🔥📊
we shall see a good amount of increase in POPCAT price !It seems the price is forming a head and shoulders pattern, which, if correct, suggests a good price increase in the coming days. However, we should wait for the pattern to fully complete.
Best regards CobraVanguard.💚

PLTR Dec 12. Testing Supply While Holding Higher LowsPLTR has been climbing steadily off the morning low and is now sitting inside a rising structure on the 15-minute timeframe. Price continues to make higher lows, but it is also repeatedly stalling at the same supply zone near 188–189. This level has acted as a ceiling for two sessions, and today’s late trading once again paused right beneath it.
The rising trendline from the morning recovery shows solid buyer interest — each dip into that trendline was defended, keeping PLTR on an upward trajectory. As long as price stays above 185.5–186, the immediate structure remains constructive.
Above price, the 189–190 zone is the key breakout area. It has rejected PLTR multiple times, and the most recent candles show hesitation as soon as price approaches it. A clean break above 189.5 would shift control toward buyers and give PLTR room to test the upper boundary of the channel near 190.5–191.
Below price, the next meaningful support sits at 182.5–183. This level served as the reaction zone earlier, and it aligns with the mid-channel structure. A break below 185 would likely send PLTR back into 183–182.5 to find buyers.
Now looking at the options landscape, the GEX levels strengthen these same areas of interest.
The 189–190 zone corresponds with a significant positive gamma cluster — the highest positive NET GEX region for PLTR right now. When price pushes into these upper positive-gamma areas, dealer hedging tends to resist expansion, which explains the repeated slowdowns near 189–190. Price does not immediately reject, but it stalls, hesitates, and comes back down, which matches exactly what the chart shows.
If PLTR breaks and holds above 190, it clears the gamma resistance band and opens the pathway to the next call concentration around 192–193. In that environment, hedging pressure shifts and allows price to travel more freely.
On the downside, negative gamma pockets appear around 182–180. These levels align with the lower demand zone and the mid-channel support. If PLTR loses 185 and falls into these gamma pockets, volatility expands and price can accelerate more quickly toward 182.5–180.
This alignment between price structure and GEX creates a clean roadmap for Dec 12:
• Holding above 186 keeps the rising structure intact
• Breaking above 189.5 clears the supply zone and targets 190.5–192
• Failing at 189 and dropping under 186 sends PLTR toward 183
• Losing 183 opens the deeper gamma-driven target near 180
PLTR is coiling under a well-defined ceiling with strong support beneath it. The next move through either 189 or 186 should set the tone for tomorrow.
This analysis is for educational purposes only and not financial advice.

XRP Technical Outlook: Channel Break Could Signal New Highs !!The price is currently moving within a bullish channel and may reach the upper boundary of this channel. If the channel is broken to the upside, we can expect a new all-time high (ATH) for Ripple.

The Trading Range is about to be testedTomorrow we should see all time highs, but I'm thinking it will not stick and so the trading range play may be in effect. Vix also about to test it's previous channel under 14. Gold, possibly a false breakout, seems to be following the general market. Oil may have bottomed, but nothing definitive. Nat Gas is very oversold, but should eventually go lower.

SOLUSDT — Strong Supply Rejection & Bearish Target in FocusSOLUSDT has reacted sharply from the strong supply zone, confirming active sellers after a fake breakout and clean rejection from resistance. Price is now holding below the seller zone, forming a bearish structure after high volatility movement. If the market breaks the support zone around 131–132, a continued drop toward the demand zone becomes highly likely.


MOIL LTD – Weekly AnalysisTrend: Medium-term downtrend but approaching a major reversal zone.
Structure: Price still below falling trendline; momentum weak.
🟢 Strong Demand Zone: 260–285
Major support area.
Multiple historical reversals from this zone.
High probability of a bounce if price retests this region.
🔴 Resistance Levels
380–405: First major resistance. Expect selling here.
520–560: Long-term strong supply zone.
📈 Expected Move
Price likely to retest 260–285 zone.
If demand holds, a bullish reversal towards 380–405 is expected.
Sustained weekly close above 405 can open targets toward 480+.
⚠️ Invalid Scenario
Weekly close below 260 = bearish breakdown and deeper correction risk.
📌 Summary
Stock nearing a high-probability reversal area.
Watch 260–285 for accumulation + bounce setup.
First upside target: 380–405.
⚠️ Disclaimer
This is only for educational purposes, not financial advice. Use stop-loss and manage risk.

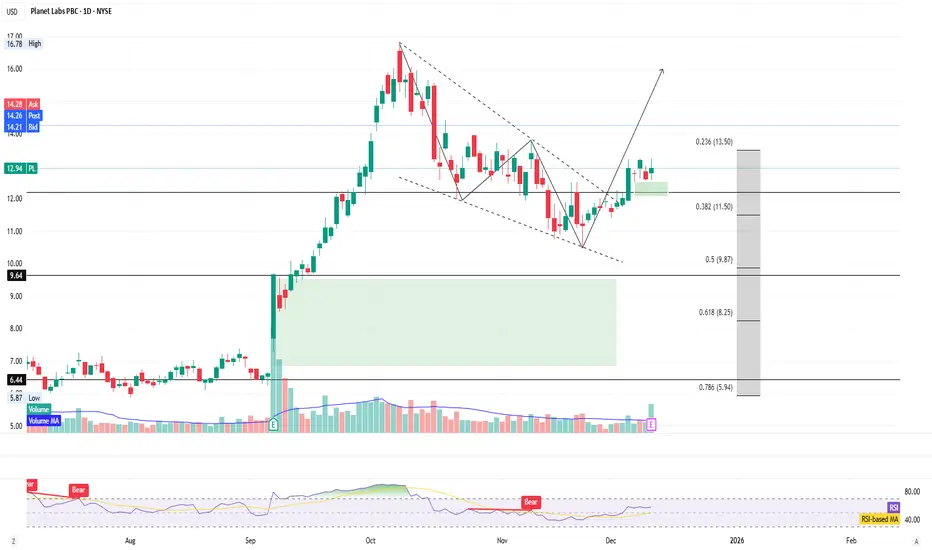
bullish setupNYSE:PL has a bullish setup, broken out from the wedge. we can see new all time high soon. some resistance around $14 but momentum looks good to take that easily.
RTY UpdateRTY and YM (Dow) are overbought on RSI and MFI, so probably more whipsaw tomorrow, lol.
I looked at it because I was thinking about going long on a retail stock. Looks like I'm too late on that one.
FDAX also hit overbought...

AUDUSD: resistance rejection🛠 Technical Analysis: On the 4-hour timeframe, AUDUSD has flashed a "Global bullish signal" via a Golden Cross (SMA 50 crossing above SMA 100, SMA 200). The price is currently consolidating above the breakout zone, with a short-term rally projected towards the strong resistance level at 0.6700. The trade setup anticipates a "sell-the-news" reaction or technical rejection at this ceiling, targeting a bearish rotation back towards the support cluster around 0.6615.
———————————————
❗️ Trade Parameters (SELL)
———————————————
➡️ Entry Point: Sell Limit at Resistance (approx. 0.6700 – 0.6710)
🎯 Take Profit: 0.6615 (Support)
🔴 Stop Loss: Above the resistance structure (approx. 0.6735)
⚠️ Disclaimer: This is a potential trade idea based on current analysis; market conditions and price direction are subject to change based on news factors and volatility.

XAUUSD sell level to look for!XAUUSD Bear still in contol, at least for shorter term. The daily rejection on Fed's rate cut news has not been strong enough to start a new uptrend, instead, there is lowertimeframe bearish pressure which indicating possible drop to the daily support level.
Here in this 30minutes timeframe there is bearish impulse later with sideway consolidation, price is rejecting 4218.60 level, means, there is second wave of drop is possible as the market left imbalance in the downside direction.
Therefore a sell trade is high probable with SL above the key level of 4218.60

Sell Signal for XAU/USD (GOLD)old/USD)Pair: XAUUSD
Direction: Sell (Short)
Entry: Around current levels (~4,213 - 4,215) or on rejection from the overhead resistance near 4,240
Stop Loss: Above 4,252 (recent high/resistance zone)
Take Profit 1: 4,180
Take Profit 2: 4,135 (near recent support)
Reason: Price is approaching/rejecting strong overhead resistance after a sharp rally. Bearish divergence potential on lower timeframes, with recent red candles showing selling pressure. Risk of pullback in an overextended move.
This is for educational purposes only and NOT financial advice. Trading involves high risk, always do your own research and use proper risk management. #XAUUSD #Gold #SellSignal #Forex #Trading #NotFinancialAdvice

4H chart, BTCUSDT. the 4H chart, BTCUSDT is consolidating in a tight range, holding above a rising trendline, while repeatedly rejecting from the same 93,500–94,500 resistance block.
The price is trading near rising support from the Ichimoku Cloud and lows of 82,000–83,000. Local horizontal support is now around 89,000–89,100, and if the trendline fails, deeper support is at 84,584 and 80,550.
As long as candles close above the trendline and 89,000, the setup favors another attempt to break the red resistance band; a clean 4H close above 94.5k would create room for a move towards 96,000–100,000.
A decisive break below the diagonal plus 89k level reveals a move first to 84.5k and then to 80.5k, where the larger, higher-timeframe demand zone and previous bounce began.
DYOR | NFA
