Dia is waiting for 210%#1 First target is 10% in trendline hourly
"In case of a breakout, we are going to 2nd target"
#2 Second target is 40% in trendline daily
"In case of a breakout, we are going to 3rd target"
#3 third target is 210% in trendline weekly
In your responsibility.
Crypto market

Bitcoin is approaching a significant support areaHey Traders, in today's trading session we are monitoring Bitcoin for a buying opportunity around 64,600 zone, Bitcoin is trading in an uptrend and currently is in a correction phase in which it is approaching the trend at 64,600 support and resistance area.
Trade safe, Joe.

Giant Head and Shoulders IMX at a critical point here. If this head and shoulders pattern plays out we can fall another 33% to that $0.80-$1 level. I’d be looking to buy spot and holding out for an alt season. Plenty of support in that region, if it does get there.

Solana in This Bearish Week! ( Mon 17 Jun- 3rd Weed of Month)The results of my reviews of monthly and weekly candles are as follows:
- The monthly candle is descending.
- The weekly candle is also bearish.
- Targets respectively: the price is 137.83 and 127.31.
On the first day of the week, I will be more of a watcher, like an eagle.

BTC: Reverse Head and ShouldersBitcoin may be making a mega reverse h&s pattern on the day timeframe. If we bounce from this level in the next few days, you can expect the market reversal to kick in here and BTC to be at a new ATH soon.

Solana in This Bearish Week! ( Mon 17 Jun- 3rd Weed of Month)The results of my reviews of monthly and weekly candles are as follows:
- The monthly candle is descending.
- The weekly candle is also bearish.
- Targets respectively: the price is 137.83 and 127.31.
On the first day of the week, I will be more of a watcher, like an eagle.

Bitcoin - Keeping It Simple!Hello TradingView Family / Fellow Traders,
📦 After rejecting the $70,000 - $72,000 resistance zone, BTC has been hovering within a narrow range during a correction phase.
📈 For this impulse phase from $20,000 to persist and push towards the next resistance at $80,000, a break above the $72,000 mark is needed.
📉 In parallel, if the $60,000 support is broken downward, we expect an over-extended bearish correction towards the $50,000 - $52,000 support zone.
Which scenario is more likely to happen first, and why?
📚 Always follow your trading plan regarding entry, risk management, and trade management.
Good luck!
All Strategies Are Good; If Managed Properly!
~Richard Nasr

BTCMost of the position I see is very clear
This model is complete, so we say strict, let us go to 71-75
As a first goal, the rest of the goals extend to 85-105
Landing key 65556 We follow and wait for Bay

BTC trend lineI tried to create trend line for BTC, 3rd time touch will be confirmation for trend line

Zilliqa price targets for swing tradeCan be the good entry for long BINANCE:ZILUSDT
Possible Targets and explanation idea
➡️Global chart we are in 27 block accumulation zone
➡️I would like to see sweep this liquidity pool and test M fvg 2020
➡️with Oil 2.0 updates I think its can be a good trade to next M fvg
➡️Mp indicator shows money inflow on W timeframe - bullish
➡️
➡️
Hope you enjoyed the content I created, You can support with your likes and comments this idea so more people can watch!
✅Disclaimer: Please be aware of the risks involved in trading. This idea was made for educational purposes only not for financial Investment Purposes.
---
• Look at my ideas about interesting altcoins in the related section down below ↓
• For more ideas please hit "Like" and "Follow"!

Last chance for Bitcoin! Up or Down?bitcoin is still playing this triangle, for about 5 months now, if it is broken down the first TP is at 60k, and a probable retest of the support at 52k, but if we go up, and the triangle will be broken up, my first TP it will be at 85k, with a possible increase up to 100k (total production cost) in your opinion is it going up or down?

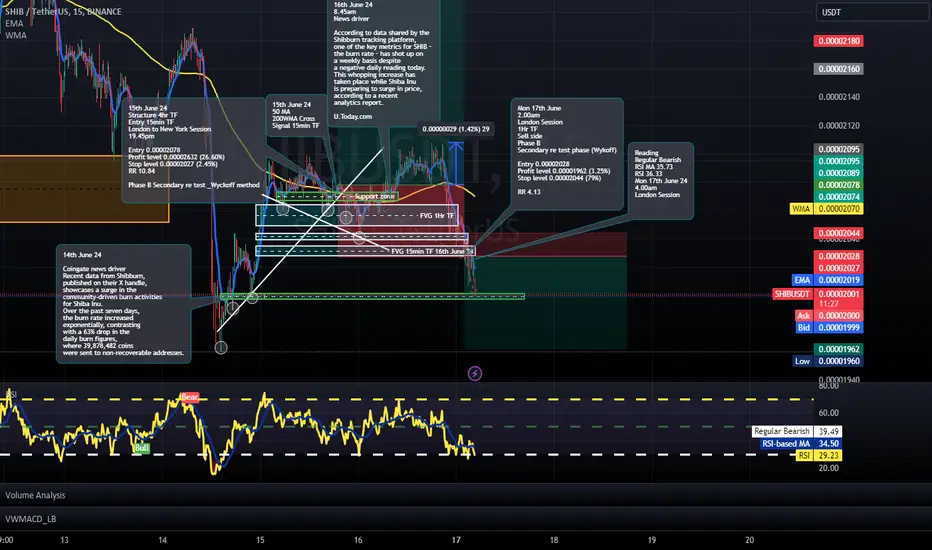
Short trade Mon 17th June
2.00am
London Session
1Hr TF
Sell side
Phase B
Secondary re test phase (Wykoff)
Entry 0.00002028
Profit level 0.00001962 (3.25%)
Stop level 0.00002044 (79%)
RR 4.13
"Expert Tips for Selling Ethereum (ETH): Maximize Your Profits!"Topics Covered:
Understanding Market Trends
Timing Your Ethereum Sales
Risk Management Techniques
Maximizing Profits with Smart Trading Strategies

Ethereum (ETH): 2 Fakeout Moves = Potential Breakdown MovementEthereum has been struggling to breakout from the local resistance zone, where the price has formed a nice two-fakeout zone, which can also be seen as a double-top pattern.
Now that we are looking for further movement below that resistance zone, we will be keeping an eye on the neckline zone, which we will touch once we see a full breakdown from that resistance zone!
Swallow Team

Bitcoin Analysis and Strategy TodayHello traders,
If you are a swing investor, pay attention to the 65,000 area as long as the price holds, buyers will push the price up significantly, while on a breakout we will see the downtrend continue.
Personally, I am optimistic that after adjusting to the designated area, the price will recover to resistance. A breakout and consolidation above resistance would confirm BTCUSD's return to $70,000.
And you? Do you expect a wave of rising prices again?

Bitcoin analysis strategies and ideasHello traders
Discus about traders BITCOIN market is sideway between support level and resistance,
Target point 69,000.00
Support Level 66,000.00
so traders i beleive on market BITCOIN Market has upward expect price breakout after its going buy zone its target 69,000.00
even a market reached our target 69,000.00 top of market,
traders if you like this idea so what are you thinking about it so must share your opnion here write in the comments your opnion thanks ,
my Goal is 69,000.00 Traders focus on target dont worry,

Algorand (ALGO): Head&Shoulders Pattern About To Break NecklineAlgorand is looking sweet with a ncie H&S pattern where we are now at the final stage of breakdown (price is testing the neckline zone).
We are looking here for a full-scale breakdown, which would result in a movement to the lower target zone!
Swallow Team


Crucial Week for BTC: Economic Data and Rate ImpactsAs Bitcoin enters a crucial week, macroeconomic events and Federal Reserve interest rate decisions play a significant role in determining Bitcoin's price trajectory. With a strong support level maintained at $66,000, there is an opportunity to buy if prices continue above this level.
The Federal Reserve's conservative forecasts reduce the likelihood of a rapid interest rate cut, necessitating caution but providing a buying opportunity at strong support. Bitcoin's behavior in the near term is likely to be influenced by its ability to maintain the $66,000 level. A continuous break below this level could lead to further sell-offs, while maintaining it could attract buying interest, especially if macroeconomic factors remain favorable.
Given the current levels and potential volatility, it is best to closely monitor price movements, especially how they behave around the $66,000 support and the $72,548 resistance. If you are looking for entry points, consider buying near the $66,000 support level if other signals align (such as a bullish RSI divergence or increased buying volume).
The RSI is around 42, which is below the neutral 50 but above the oversold threshold of 30. This indicates that the market is not in a significantly oversold state, and there is potential for an upward move if investor sentiment improves.
Setting a stop loss slightly below $66,000 could help minimize risks in case of a breakdown. Profit-taking near the resistance levels ($69,446 and $72,548) can be considered, or holding part of the position if the price breaks above these levels with strong trading volume.
Recent Consumer Price Index (CPI) and Producer Price Index (PPI) data support high-risk assets like Bitcoin, showing a continued inflationary trend which may delay the Federal Reserve from making drastic interest rate decisions.
Given the volatility of digital currencies, make sure to hedge your portfolio and diversify your investments to reduce risks. This week could be crucial for the future of Bitcoin's price and the digital markets in general.

Pigs get slaughteredWake up Grab a brush and put a little makeup Hide your scars to fade away the shakeup Why'd you leave the keys upon the table?

Quick Swing Trade on FTMThe picture says it all. Punted a long at current prices, expecting a push later this day or next few hours.
Stay safe!


