AUDCHFFUNDAMENTAL ;SIDE WAY
SENTIMENTAL ;50/50
seasonality :from 20 June onward uptrend
TECHNICAL break out of bearish trend line with bullish divergence printed HH and retraced
can be a buy consideration
Forex market

EURAUD Will Explode! BUY!
My dear subscribers,
This is my opinion on the EURAUD next move:
The instrument tests an important psychological level 1.6243
Bias - Bullish
Technical Indicators: Supper Trend gives a precise Bullish signal, while Pivot Point HL predicts price changes and potential reversals in the market.
Target - 1.6298
My Stop Loss - 1.6210
About Used Indicators:
On the subsequent day, trading above the pivot point is thought to indicate ongoing bullish sentiment, while trading below the pivot point indicates bearish sentiment.
———————————
WISH YOU ALL LUCK

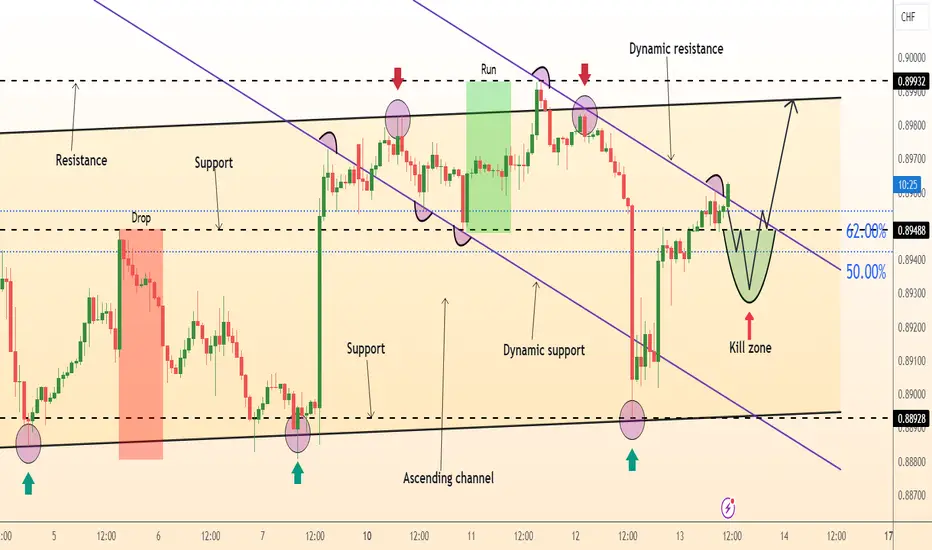
DeGRAM | USDCHF between retracement levelsUSDCHF is trading in an ascending channel between the trend lines.
The price is above the support level, which is the midpoint between the 62% and 50% retracement levels of the last bearish impulse.
The current support level has been a pivot point twice recently.
We expect the growth to continue after the support is retested.
-------------------
Share your opinion in the comments and support the idea with like. Thanks for your support!

NZDJPY: Bearish Continuation & Short Signal
NZDJPY
- Classic bearish pattern
- Our team expects retracement
SUGGESTED TRADE:
Swing Trade
Sell NZDJPY
Entry - 97.104
Stop - 97.512
Take - 96.391
Our Risk - 1%
Start protection of your profits from lower levels
❤️ Please, support our work with like & comment! ❤️

Short GBPCHF
This trade is taken because, they business GBPCHF as potential of take
Advantage of the CHF sector push downward ..
I'm taking the trade on the Day timeframe because ..
The price action strength is not strong enough to push it down further ..

NZDJPYFUNDAMENTA; NZD LONG 56 SHORT 44
JPY LONG 12 SHORT 12
SENTIMENTAL ;BEARISH SELL SIDE
TECHNICAL ; have given break out on retracement will be having good support from volume spark and consolidation zone ,is following bullish flag pattern at 4 HR chart
no bearish divergence
trade levels as described in analysis
trade at your risk

GBP/USD: Assessing Momentum and Pullback OpportunitiesGBP/USD gained significant bullish momentum on Wednesday, reaching its highest level since early March, climbing above 1.2850. The pair managed to sustain most of its gains throughout the day, closing in positive territory for the third consecutive session. However, in the late American session, some of these gains were pared back. Early Thursday, GBP/USD is struggling to preserve its bullish momentum and is trading below 1.2800, around 1.2785 as I write this article.
This recent upward movement is attributed to a combination of factors. Firstly, the broader market sentiment has been relatively positive, providing support to the GBP/USD pair. Secondly, the British Pound has benefited from the recent economic data, which has been relatively strong, suggesting that the UK economy is recovering at a steady pace. On the other hand, the US Dollar has been under pressure due to expectations that the Federal Reserve might adopt a more cautious approach to future interest rate hikes, especially after recent comments from Fed officials and economic data pointing towards a potential slowdown in the US economy.
From a technical perspective, the Pound is in a clear uptrend against the USD. The price is positioned above the major moving averages, indicating strong bullish sentiment. Additionally, the Stochastic indicator has moved out of the oversold condition, signaling that there might be more room for the pair to rise. The recent price action has created a bullish structure, with higher highs and higher lows being formed on the chart.
We are currently looking for a potential pullback to the Fibonacci retracement area, which could provide a new buying opportunity for traders. This pullback could help consolidate recent gains and provide a base for the next bullish impulse. The key levels to watch on the downside include the 1.2750 and 1.2700 support areas, which could act as a strong barrier against further declines. On the upside, if the pair can break above the recent high of 1.2850, it could open the door for further gains towards 1.2900 and beyond.
In summary, while GBP/USD has shown strong bullish momentum recently, it is currently facing some resistance around the 1.2800 level. However, from a technical standpoint, the uptrend remains intact, and a pullback to the Fibonacci area could offer a good buying opportunity for traders looking to capitalize on the ongoing bullish trend. The overall market sentiment, economic data, and central bank policies will continue to play a crucial role in determining the future direction of the pair.

BUY position in 30 minutes time AUDUSDAUDUSD buy position in 30 minutes time frame is specified with two TP numbers

EUR-USD EUR-USD point goatEUR-USD point goatEUR-USD point goatEUR-USD point goatEUR-USD point goatEUR-USD point goatEUR-USD point goatEUR-USD point goatEUR-USD point goatEUR-USD point goatEUR-USD point goatEUR-USD point goatEUR-USD point goatEUR-USD point goatEUR-USD point goatEUR-USD point goatEUR-USD point goatEUR-USD point goatEUR-USD point goatEUR-USD point goatEUR-USD point goatEUR-USD point goatEUR-USD point goatEUR-USD point goatEUR-USD point goatEUR-USD point goatEUR-USD point goatEUR-USD point goatEUR-USD point goatEUR-USD point goatEUR-USD point goatEUR-USD point goatEUR-USD point goatEUR-USD point goatEUR-USD point goatEUR-USD point goatEUR-USD point goatEUR-USD point goat

EURUSD - UniverseMetta - Analysis#EURUSD - UniverseMetta - Analysis
The price is near the upper border of the downward channel in which the price has been since the beginning of the year, which makes it possible to look for entry points from the borders. An impulse 1st wave has been formed with a correction of 60% (38 Fibo level), from which a rebound most often occurs and the formation of a 3-wave structure; you can look for entry points with a short stop, if the ABC correction does not continue on the lower timeframe. Globally, we can expect a fall to the lower border, to the levels 1.05200 - 1.03995
Locally to levels 1.07210 - 1.06060
Target 1.07210 - 1.06060

GBPJPY: Bullish Accumulation & BreakoutFollowing a prolonged period of bullish trading within an ascending triangle pattern, the GBPJPY saw a rebound yesterday and broke through its resistance level.
This development suggests the possibility of further bullish momentum, with the next potential target set at 202.00.

NZDCHF Short Term Buy IdeaH4 - Bullish trend pattern
Currently it looks like a pullback is happening
Until the strong support zone holds my short term view remains bullish here.

EURUSD SELL We are currently in an area that is very hard to pin down for the EURUSD.
In fact, on the one hand, taking cash at 1.07230 gives me a bullish view on the EURUSD.
We are back in the HTF OTE zone and we have recovered a very large pocket of liquidity.
But on the other hand, LTFs are short and we have also just returned to the short OTE zone.
So what is the EURUSD going to do over the next few days?
I have a rather bearish view, but I prefer to remain a spectator for the time being so as not to expose myself. We'll see how the price reacts over the next few days.
Feel free to subscribe and boost this post if you liked my analysis, and to tell me what you think in the comments.
Happy trading and have a good weekend :)

EURUSD On The Rise! BUY!
My dear subscribers,
This is my opinion on the EURUSD next move:
The instrument tests an important psychological level 1.0728
Bias - Bullish
Technical Indicators: Supper Trend gives a precise Bullish signal, while Pivot Point HL predicts price changes and potential reversals in the market.
Target - 1.0789
About Used Indicators:
On the subsequent day, trading above the pivot point is thought to indicate ongoing bullish sentiment, while trading below the pivot point indicates bearish sentiment.
———————————
WISH YOU ALL LUCK

AUDCHF Massive Long! BUY!
My dear friends,
AUDCHF looks like it will make a good move, and here are the details:
The market is trading on 0.5922 pivot level.
Bias - Bullish
Technical Indicators: Supper Trend generates a clear long signal while Pivot Point HL is currently determining the overall Bullish trend of the market.
Goal - 0.5931
About Used Indicators:
Pivot points are a great way to identify areas of support and resistance, but they work best when combined with other kinds of technical analysis
———————————
WISH YOU ALL LUCK

USDJPY Sellers In Panic! BUY!
My dear subscribers,
USDJPY looks like it will make a good move, and here are the details:
The market is trading on 156.05 pivot level.
Bias - Bullish
My Stop Loss - 155.69
Technical Indicators: Both Super Trend & Pivot HL indicate a highly probable Bullish continuation.
Target - 156.61
About Used Indicators:
The average true range (ATR) plays an important role in 'Supertrend' as the indicator uses ATR to calculate its value. The ATR indicator signals the degree of price volatility.
———————————
WISH YOU ALL LUCK

EURGBP Bullish (1H Div, Double Bottom)EURGBP showing bullish momentum based on 1H divergence and double bottom reversal pattern. Entry is taken at CMP with SL at the previous LL and TP at 1:1 and 1:2. What do you think, will it work?

AUD/USD Outlook ICT Consept📈💰 Welcome to Your Channel!
Welcome to your very own channel! Here, we embark on a collaborative journey to analyze and scrutinize financial markets, aiming to achieve substantial profits together. Let's dive into the forex market, focusing on one of its key assets: AUD/USD .
🚀📈 Recent Price Action
As shown in the provided chart, we experienced a strong bullish movement yesterday following the release of the CPI news. This movement disregarded the Fair Value Gap ( FVG ), creating an Inversion Fair Value Gap ( IFVG ).
From this point, we can anticipate a further rise to potentially reach the previous month's high ( PMH ).
📊📉 Potential for Lower Prices
For a potential decrease in prices, we might see a reaction to the marked 4-hour and 1-hour order blocks ( OB ). However, the primary focus should be on the sell-side liquidity ( SSL ) and Fair Value Gaps ( FVG ).
⭕️ Upcoming Economic News ⭕️
To identify the market trend, we need to await today's PPI (Producer Price Index) news at 08:30 NY Local Time .
This could trigger an aggressive movement, providing valuable insights into the market's reaction.
📊⚠️ Disclaimer
The information provided here is for educational purposes only and should not be taken as financial advice. Always conduct your own research and consult a licensed financial advisor before making any investment decisions.

Bank of Japan Interest RatesBank of Japan is expected to Keep Interest Rates Steady
The Bank of Japan is expected to keep interest rates steady this week and consider whether to offer clearer guidance on how it plans to reduce its huge balance sheet, in a slow but steady retreat from its massive monetary stimulus.
At the end of its two-day meeting on Friday, the BOJ is expected to keep its short-term policy rate target in a range of 0-0.1%.
The BOJ ended eight years of negative interest rates and other remnants of its radical stimulus program in March, on the view that prospects for inflation to durably stay around its 2% inflation target were heightening.
In its latest projections, made in April, the central bank expects core consumer inflation to hit 2.8% in 2024, before slowing to 1.9% in fiscal 2025 and 2026.
BOJ Governor Kazuo Ueda has said the central bank will hike rates further if it feels more convinced that underlying inflation will stay around 2% as it had projected in April.
Nakamura, a sole dissenter to the BOJ’s decision to exit negative interest rates in March, also warned of recent weak signs in consumption and slowing global growth. “Real wages need to turn positive and households’ disposable income to rise more, for a cycle of rising income and expenditure to strengthen,” he said, adding it was appropriate to maintain current monetary policy for the time being.
Ueda reaffirms intention to slow its bond-buying process
The BOJ has said it will proceed gradually in tapering bond buying with a focus on avoiding any abrupt spike in yields.
A Reuters poll showed nearly two-thirds of economists expect the BOJ to start tapering its monthly bond buying, now set around 6 trillion yen ($38 billion), on Friday.
The BOJ's decision to end negative rates in March has failed to reverse the currency's downtrend, driven largely by the market's focus on the huge U.S.-Japan interest rate divergence.
While speaking to parliament on Thursday, Bank of Japan (BoJ) Governor Kazuo Ueda stated that inflation expectations are gradually rising but have yet to reach 2%. Ueda said, "We are still scrutinizing market developments since the March decision. As we proceed in exiting our massive monetary stimulus, it's appropriate to reduce bond purchases."
While the comments suggest the BOJ is laying the groundwork for further interest rate hikes, Ueda cautioned that after such a long period without major changes in rates in Japan, it was difficult to assess the impact on the economy and what a neutral interest rate might be.
The content published above has been prepared by CFI for informational purposes only and should not be considered as investment advice. Any view expressed does not constitute a personal recommendation or solicitation to buy or sell. The information provided does not have regard to the specific investment objectives, financial situation, and needs of any specific person who may receive it, and is not held out as independent investment research and may have been acted upon by persons connected with CFI. Market data is derived from independent sources believed to be reliable, however, CFI makes no guarantee of its accuracy or completeness, and accepts no responsibility for any consequence of its use by recipients.

Sell at 0.66760Audusd has fallen from resistance at 0.67043 on the 5 min tf. Downward continuation is expected after a pullback to 0.66760. Target will be 0.66170

AUDCAD: Will Start Falling! Here is Why:
The charts are full of distraction, disturbance and are a graveyard of fear and greed which shall not cloud our judgement on the current state of affairs in the AUDCAD pair price action which suggests a high likelihood of a coming move down.
❤️ Please, support our work with like & comment! ❤️

EUR/USD Follows Bullish Path Post-CPI; Buy Limit Strategy FocusEUR/USD experienced a significant upward movement on Wednesday, driven by an overall increase in market risk appetite following the release of a cooler-than-expected US Consumer Price Index (CPI) inflation report. This positive sentiment was initially bolstered as the lower inflation figures suggested a potential easing of pressure on the Federal Reserve to raise interest rates aggressively. However, the enthusiasm was tempered later in the day due to the Federal Reserve’s hawkish stance reflected in its latest update to the dot plot of interest rate expectations. This update indicated a possibility of more rate hikes in the future than previously anticipated, which crimped market sentiment.
From a technical standpoint, the price action adhered closely to our earlier analysis. The EUR/USD pair achieved all the take-profit targets we had established beforehand. Post-FOMC meeting, the price action retraced the gains from the CPI-induced bullish impulse, creating a gap in the market. This gap, left by the rapid price movement following the CPI release, typically attracts market participants looking to "fill" it, as prices often return to these levels to establish more balanced trading conditions.
Given the current scenario, we are contemplating a strategic approach involving a potential buy limit order. This approach is based on the expectation that the price will return to cover the unfilled gap left by the CPI announcement. The buy limit order would allow us to enter the market at a more advantageous price point, capitalizing on the anticipated retracement. Additionally, the broader economic context and market sentiment will be closely monitored to adjust our strategy as needed, ensuring that our trading decisions are well-informed and responsive to ongoing developments.
In conclusion, while the EUR/USD pair has shown resilience and upward momentum, the mixed signals from recent economic data and Fed communications warrant a cautious yet opportunistic approach. By setting a buy limit order, we aim to leverage the expected price correction, positioning ourselves to benefit from subsequent bullish movements.
