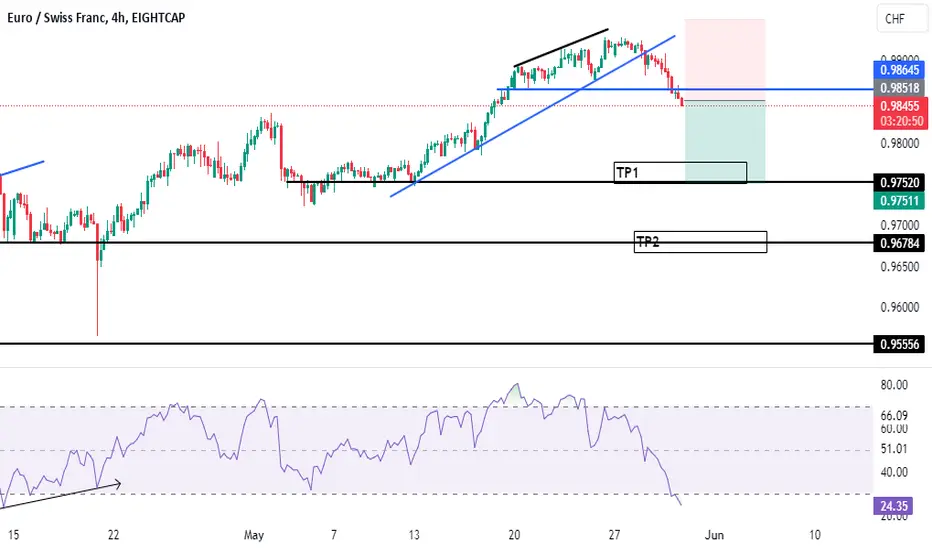
GCHF BUY PROJECTION GBPCHF, UP TREND RETRACEMENT HAS HIT THR TREND LINE, EXPECTING Possible pull up next..
Get your best entry and make money.
Forex market

SHORT EURUSDEURUSD on the daily time frame is bearish and in a downtrend channel.
Correction might be underway to fill up the gap and retest the broken uptrend line at area 1.08 - 1.085 which is the previous support zone and currently the resistance zone, before the next big drop to the lower of the down channel at area 1.0450 - 1.05.

GBP/USD dips as UK growth stallsThe British pound has lost ground on Thursday. GBP/USD is trading at 1.2760 in the North American session at the time of writing, down 0.29% on the day.
The UK economy showed no growth in April, which was in line with expectations but below the March reading of 0.4% m/m. This was the weakest reading in four months, as manufacturing and construction declined, offsetting the rise in services. Yearly, GDP rose 0.6% in April, down from 0.7% in May and in line with expectations. April showers dampened consumer spending as the UK economy continues to struggle.
With a national election taking place on July 4th, politicians will be monitoring and making use of every economic release. The ruling Conservatives are trailing badly in the polls and today’s weak GDP could well be another nail in the coffin for the Conservatives.
The Bank of England meets next week but there is little chance a rate cut in the middle of an election campaign. The markets have priced in an initial rate cut in September, although an August cut is a possibility, when the BoE releases quarterly growth and inflation forecasts.
The advantage of waiting till September is that the Fed may cut at its September meeting, which is a day before the BoE meets. If the Fed does trim rates, then a BoE cut would not have as much negative impact on the British pound.
In the US, May inflation decelerated. The headline figure fell from 3.4% y/y to 3.3% and the core rate dropped from 3.6% to 3.4%. The Federal Reserve held the benchmark rate, as expected, but noted that inflation was moving closer to the 2% target. The Fed remains cautious and has signaled just one rate cut before the end of the year. The probability of a quarter-point cut in September is 61%, according to CME’s FedWatch.
GBP/USD is testing support at 1.2796. Below, there is support at 1.2733
1.2862 and 1.2925 are the next resistance lines

DeGRAM | GBPCAD rebound from the channel boundaryGBPCAD is moving in an ascending channel above the trend line.
The price is above the support level and 38.2% retracement level.
The chart has reached the lower boundary of the channel.
We expect a rebound.
-------------------
Share your opinion in the comments and support the idea with a like. Thanks for your support!

EURUSD Has Begun Wave C of EIt appears that the final wave C of the zigzag forming wave E of a triangle has begun. After this last push down, prices should move higher as part of wave 5.

NZDUSD SELL TO BUYNZDUSD trends usually give a positive or negative percentage no lower than 3.0% and 5.50%. If the whole analysis is completely clear, you'd see the different technical analysis concepts I have incorporated to reach the conclusion of an initial short for a possible weekly trade.

AUDJPY Bearishtrading between the supply and demand areas. Caught price at resistance and loaded shorts. Let's see how we do. Trailing stops from 104.636, 104.492, 104.461

GU New York session The ppi gave out a few pips and took out the previous sessions liquidity. The last trade of the day a short towards London low.

Short trade Wed 12th June 24
10.00am
London to New York Session
Observed major resistance level
Entry 15min TF
Sell side
Entry 0.62032
Profit level 0.61443 (0.95%)
Stop level 0.62230 (0.32%)
RR 2.97

AUDUSD IN BEARISH TREND Fundamental:
DXY: Bullish
AXY: Bearish
Technical:
AUDUSD Printing LH &LL with no bullish divergence
Sentiment : Bearish

EUR/AUD -H4 MED TERM- BUY TRENDUse good trade management only thing important in Trading is how you manage your trade...
our signals are 95% accurate give us follow and motivate us by likes and comments...
.. good luck..

Eur/Aud - Daily / Swing Trade - Fake Break outAt Weekly we are in sell trend clearly but on daily price is at trend line support level this may a pullback for weekly.
we will enter buy if breakout cycle complete.
if breakout not complete then this trade will be risky to enter so wait and see

Bearish Harmonic on $NZDUSD daily chartThe NZDUSD shows a bearish harmonic on the daily chart. The pattern is valid up to 0.62613, above which the stop-loss—target is 0.59843. The weekly range high was reached yesterday.

GBPUSD Strong sell zone. Eyes on FOMC GBPUSD reached the highest supply zone or a resistant level from the first week of march. In the RSI, the price is in the overbought territory. I made a short position in the resistance possible of the strong sell zone.

USDCAD to continue in the upward move?USDCAD - 24h expiry
The current move higher is expected to continue.
Risk/Reward would be poor to call a buy from current levels.
Short term RSI is moving higher.
A move through 1.3750 will confirm the bullish momentum.
The measured move target is 1.3780.
We look to Buy at 1.3725 (stop at 1.3700)
Our profit targets will be 1.3790 and 1.3810
Resistance: 1.3750 / 1.3775 / 1.3780
Support: 1.3725 / 1.3700 / 1.3675
Risk Disclaimer
The trade ideas beyond this page are for informational purposes only and do not constitute investment advice or a solicitation to trade. This information is provided by Signal Centre, a third-party unaffiliated with OANDA, and is intended for general circulation only. OANDA does not guarantee the accuracy of this information and assumes no responsibilities for the information provided by the third party. The information does not take into account the specific investment objectives, financial situation, or particular needs of any particular person. You should take into account your specific investment objectives, financial situation, and particular needs before making a commitment to trade, including seeking advice from an independent financial adviser regarding the suitability of the investment, under a separate engagement, as you deem fit.
You accept that you assume all risks in independently viewing the contents and selecting a chosen strategy.
Where the research is distributed in Singapore to a person who is not an Accredited Investor, Expert Investor or an Institutional Investor, Oanda Asia Pacific Pte Ltd (“OAP“) accepts legal responsibility for the contents of the report to such persons only to the extent required by law. Singapore customers should contact OAP at 6579 8289 for matters arising from, or in connection with, the information/research distributed.

Trade idea - GBPUSD Long1H
Corrective approach towards entry zone.
Market moving in descending channel towards entry zone. Bears getting tired.
-68 Fibonacci completion aligning with entry zone.
= Buy limit.
1% risk.

USDMXN at supportIntraday Update: The USDMXN has come back to the key 18.50 level and could allow for buyers to step in near term.

NZDUSD: Structure AnalysisNZDUSD: Structure Analysis
After the stronger-than-expected NFP data on Friday, we saw the price moving down aggressively.
Actually the price found a strong support zone near 0.6090 which seems to be also a critical
zone for NZDUSD.
A move below 0.6090 should push NZDUSD down further to 0.6045 and 0.5990
If the price develops above 0.6090 the chances will grow again for another bullish wave with targets/resistance zones near 0.6170; 0.6210 and 0.6270
You may find more details in the chart!
Thank you and Good Luck!
❤️PS: Please support with a like or comment if you find this analysis useful for your trading day❤️

CHFJPYCHFJPY is showing Bearish divergence Along with double top place a sell as it will break its Last HL WITH Trendline


GBPUSD OUTLOOK GBPUSD Technical Analysis:
The price recently touched the resistance level of 1.2877 and subsequently reversed to test its previous barrier around 1.2740. As a result, the price is expected to consolidate between 1.2697 and 1.2820 until a breakout occurs.
Bullish Scenario: A break above 1.2819 will support a bullish trend, targeting the levels of 1.2877 and 1.2956.
Bearish Scenario: the price can reach the support level at 1.2697. However, a break below this level is necessary to initiate a bearish trend towards 1.2541.
Key Levels:
Pivot Price: 1.2750
Resistance Levels: 1.2877, 1.2956, 1.3037
Support Levels: 1.2697, 1.2620, 1.2541
The price movement is expected to oscillate between the resistance at 1.2956 and the support at 1.2697.
