Professional analysis and strategy, hopefully will help youS&P500 (US500) is falling towards the pivot which acts as a pullback support and could potentially bounce from this level to the 1st resistance.
Pivot: 5,275.81
1st Support: 5,203.86
1st Resistance: 5,379.39
Market indices

This analysis is really good, I suggest you take a closer lookHello guys, we are in a very strong trendline resistance area and I am not bearish. If the S&P 500 breaks through 5150, I would be very bearish. I am already long SQQQ and UVIX, UVXY, VXXB and long VIX etn.
Happy trade

DAX SELLS @ 18715Selling Dax, supply looks to be strong enough to take us to demand below before continuing higher. Half risk again due to supply in an index.

Nasdaq Not Over Yet !Hi mates sharing a long view on Nasdaq as price break resistance (18350) and sustaining very well above and by the today's candle price breached the high of breakout candle too which is a good sign for resistance breakout so from here onwards i am looking some more upside movement in coming sessions friends. Traget meausured from the swing high to swing low made before this breakout and by the rising resistance line too and it seems logical too me.
Breakout retest- So as we can see that a proper breakout retest not happened so far after breakout which could provide the best entry as we can minimize our risk in any of trade by these type of retest entries as price earlier retested too it's breakout mentioned on provided chart, Rest i will update idea accordingly whenever needed and good to share anything about this publication.
This idea is meant for only educational purpose this not any kind of trading or investment advice.
Best Regards- Amit

Nice Correction On Dax; More Upside Ahead? Stocks remain in risk-on mode after Nvidia's beats earnings expecations, so it’s not surprising to see DAX also turning up. Index has stabilized at the first support area between 18,620 and 18,560 from where we can see the price attempting to break out of what can also be referred to as a bullish flag, therefore, the market will at some point resume higher into a 5th wave.
However, fourth-wave corrections can sometimes be tricky and complex, and it's not always easy to define the end of a wave four unless you wait a bit further for confirmation of a bullish reversal. In our example, if the DAX comes back to this week’s lows, the next significant, but also very strong, support can be found at the 38.2% Fibonacci level around 18,500.
In either case, we believe the DAX will remain in an uptrend, but don’t be alarmed by a potential top if we see deeper price action. The most important invalidation level for a trend change is at 18,237. The upward projection for wave 5 should be around 19,000.

JPY index bullish move preparationJPY index pair is preparing for short bullish move before long fall bearish again...
Almost set to go BULLISH

US100-bias short Bearish indications:
Rising wedge break down indicates bearish move.
Bearish divergence.
Double top formation.
Evening star candle formation from the resistance.
Correction anticipated.
Bullish indications:
HHHL
Trade plan bias short @ 18677
SL:18763
TP1:18590
TP2:18532

NAS100 1 hour outlookPrice has shot up breaking ATH towards the 19000 region.
I do believe price will have to come back down before continuing the bullish trend.
Short was initiated after the 1h candle close with a tight SL above the previous high.
Now we wait and see how far price will retrace before it heads back up.
Good luck!

DOLLAR possible long Setup1. DXY broken the trendline. waiting to break the 200EMA cross
2. Once we got the confirmation after the EMA break we can take long while short the USD pairs (EURUSD and GBPUSD).
3.I'll update once we got the confirmation, stay tuned
4.Please support and follow more for updates. Thank you

Dollar BULLISH from the DAY TRENDLINE!!!!!!!!!!????1.Dollar retested exactly from the Day trendline.
2.If this support line broken we may dollar free fall from 104 to 103 nearly thousand pips.
3.According weekly timeframe dollar is still bullish, for a confirmation it has to break the previous resistance and consolidation.
4.Both the supports and resistance need more volume to break. I hope upcoming weeks news will impact the dollar and decide the direction.

USD come back strongerI have 2 alternative movement for DXY. Looking for bullish an impulsive move upwards.

Hellena | SPX500 (4H): Short to 38.2% Fibo lvl 5205.Dear colleagues, I think that the price has either already completed or is about to complete the impulsive movement in wave “1”, so I expect the beginning of correction at least to the area of 38.2% Fibonacci level 5205. It is quite possible that the price will update the high and reach the area of 5375 before starting the correction.
Manage your capital correctly and competently! Only enter trades based on reliable patterns!

Professional trend analysis and strategy, don't missHello, traders, thoughts on potential future price movements.
- 2 Potential options.
- Opportunities can only be realized in one of two "potential" price paths.
- Technical analysis only.
- "No" Consider fundamental analysis.
- Consider "NO" relevance.
Happy trade

You can't miss professional analysis and strategy!May 13-18 is a super bullish sweep before ATH creates a new one. Further upward momentum needs to be reversed. The CPI OB looks likely to be a sustained bullish zone.
When the price decides to trade in this area, it will expand to 15 m /5 m, which can gain a lower TF scalp or enter the highs of the current week.

Shock! This analysis strategy is worth a look!Hello, traders
The trend is bullish, with higher highs and lows, but now H4 is diverging and the short position is up to 39635
Now there are two scenarios
The first case
1. If the trend will break the Fibonacci 0.6 level, there is already a divergence
Then there will be a reversal
2. If the level Fibonacci 0.6 is rejected and the EMA is below the Fibonacci level, the trend is more likely to continue
If the trend is rejected
0.6 level, moving average below current level
The trend towards more opportunities will continue
If this level is not broken, then the trend will continue its trend
Maybe we should have a wait-and-watch position on the trend

Us30 = = = Bullish internal signal 99% returnDaily internal signal analysis
The trend is bullish, with higher highs and lows, but now H4 is diverging and the short position is up to 39635
Now there are two scenarios
The first case
1. If the trend will break the Fibonacci 0.6 level, there is already a divergence
Then there will be a reversal
2. If the level Fibonacci 0.6 is rejected and the EMA is below the Fibonacci level, the trend is more likely to continue
If this level is not broken, then the trend will continue its trend
There is a wait-and-watch position on the trend

DXY - 23 May 2024Since 16 May 2024, price open low but trade higher. Along the way up, price didn't experience strong resistance from above, not until it reaches 104.35, even there is some remaining selling pressure at that level but we can clearly see there isn't any follow through afterwards.
Price hold, and Monday open price again start to trade higher slowly and gradually. Wednesday LD we start to see some bullish intention, a minor acceleration, this is a sign of continuous SOS. In short term, I will expect a higher prices from here.

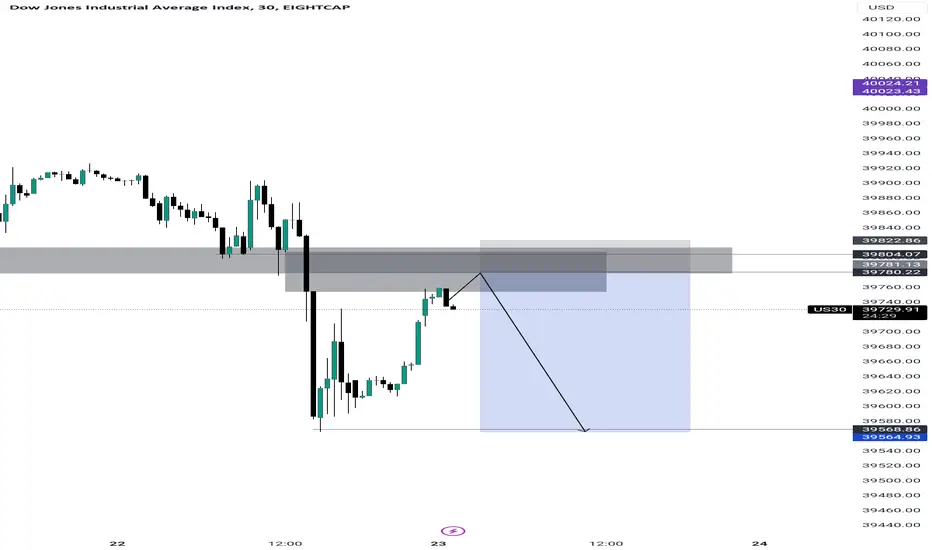
Hellena | DJI (4H): Short to the area of 38566.67.Dear colleagues, I believe that the impulse of the senior wave “1” is not yet over.
I assume that the correction is now in priority, so 2 variants of events are possible:
1) formation of lower wave “4” and “5” (39863.75), then correction with the aim to reach the area of 38566.67;
2) The correction will start soon without a new high, but in this case we will have to reconsider the waves.
Manage your capital correctly and competently! Only enter trades based on reliable patterns!

Follow me. I'll make you moneyTraders take risks to trade, play with confidence, take your own risks, haha. Liq swept over, and all the plays were just too strongly bearish candles


JP225 GRAVITY IMMINENT. CORRECTION IS NEXT.JP225 is already heavily overbought at the current pricepoint and an imminent correction is in order.
NET buying has been fading..
4h lower highs has been spotted -- conveying weakening long momentum.
Expect some trim downs from this levels: 28400
TAYOR.

BNF - 1 hr Bullish Chart View!Good rebound indication given by the market today.
Entered into the stream!
