Development works food 6013head and shoulders pattern on daily frame, after closing in this point will lead us to high target. keep going.


Amiantit 2160I expect good move in this area. Good luck and remember that's not advise for investment, make your own analysis bro :)

Saudi Vitrified Clay Pipe and Personal View The stock has slightly penetrated the top of the price channel. Moving above it confirms the bullish move. however, if it happens to throw over, it may retrace back to mid-bottom of the price channel and then starts another move.

BUY 4013Dear Saudi traders, here's another stock for you to buy tomorrow's trading session, buy it an pay attention for the highest high the market reached.
TP and SL set them at your own risk.
Don't hesitate to leave a comment in case you got any questions.

BUY 5110Dear Saudi traders, here's another stock for you to buy for tomorrow's session, buy it and set TP and SL at your own risk.
I will post time to time trades for day traders to catch, if you got any question don't hesitate to ask!

BUY 2222Dear Saudi traders, as I posted minutes ago about holding positions for investors, here I am posting for the traders to buy the stock for tomorrow's trading session.
TP and SL set them at your own risk!
Don't hesitate to leave a comment if you got any question!

Quick analysis on 2222Good evening dear Saudi traders!
2 months ago, I posted to buy 2222 (ARAMCO) at the perfect entry point, today thanks to god the market is going on its way up after breaking the level 0.5 of the pitchfork that's simulated by the blue line, now it's on its way up to reach the level 0. Keep holding your positions for now.
I can't share the pitchfork analysis to the public that's why I simulated the levels with the blue lines.
Don't hesitate to ask in case you have any question!

Saudi Printing and Packaging needs to close above 18.80Saudi Printing and packaging stock has formed a descending triangle and targeting areas of 22.30. 18.80 is confirmation and it must close above it on a daily timeframe. 16.30 is the stop-loss.
Cheers gents,

4003 | United Electronics | 1D4003 appears to be following dow theory and is making higher highs (HH) and higher lows (HL). Previously it was in a downtrend channel and currently it is in uptrend channel. Currently it has taken support from bottom of the channel and candles formation is like 3 white soldiers which is also bullish.
The trading levels are mentioned on chart.

Al-Jazeera Takaful Al-Jazeerah Takaful is partially penetrating a H&Ss neckline and the target is demonstrated in chart. The dashed line is the wave target. It however could only reach the wave target and may not reach the Head and shoulders target.

Alinma Tokyo The stock is moving towards the target. Watch out for the coming resistance. 16.24 is a stop loss.

National gypsum possible scenario The Gypsum is believed to be bullish after hitting a strong support that previously a demand zone. Target as seen in chart


ARAMCO is going out of the cage nowThe Saudi giant Aramco is thought to be bullish as it has broken out a downtrend. See the stop-loss and if it happens to go below, then time to short it.

Alrajhi The Saudi Giant Stock Alrajhi has two schools suggesting its bullish move, the harmonic and classical triangle. My forecast is that the stock will hit 80 based on the tools highlight in chart.

Anaam looks promising Anaam has been very bearish recently and there were some potential for a break-out but it faked a penetration of a down trend (See my previous analysis). Up to now, it has formed a descending triangle in which it broke down a little and reversed to go bullish. Some analysts call it a wave throwback, a very usual behavior in Saudi stock speculations. Targets as seen in the chart but make sure that 19.80 is your stop-loss otherwise it can be bearish again.

1150: Sell ideaOn 1150 as you see on the chart we have the breakout of support line and also the breakout of the vwap indicator so it's mean that we will have a big probability to have a downtrend.Thanks!

7010: Buy ideaOn 7010 as you see on the chart we have a buy idea because we have the breakout with force the vwap and the resistance line.Thanks!

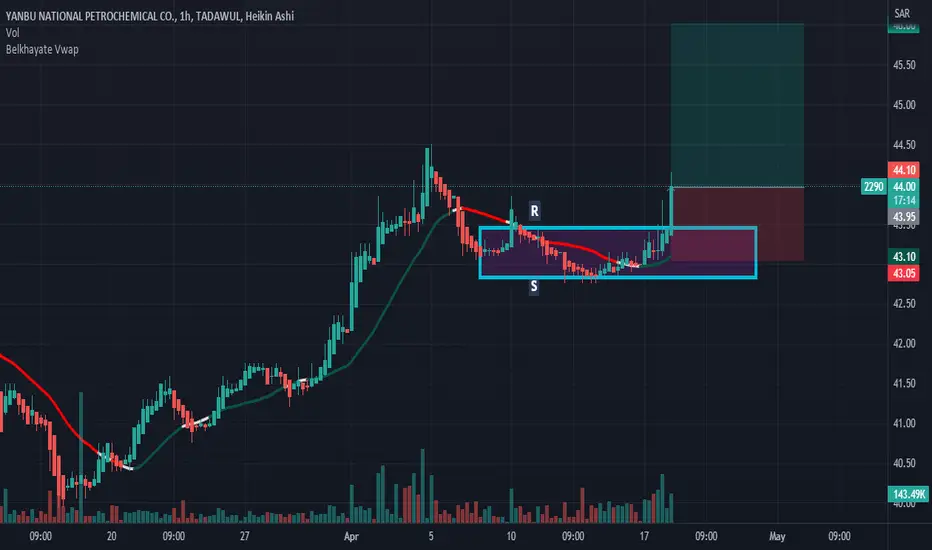
2290: Buy ideaOn 2290 as you see on the chart we have the breakout of vwap and also the breakout of the resistance line so it's mean that we will have a big probability to have an uptrend.Thanks!
Saudi Industrial Investment on W-Analysis.The stock has met all Elliott wave principles and now moving on wave 5. It may, however, retrace a little and continues its bullish wave to target the top of the price channel highlighted. If it penetrates with decent volume, it is going to the second target. The third target is the H&Ss that might hit after penetrating the second one.

Albilad Bank a Potential Scenario Albilad Bank is likely to be bullish to hit the wave target as demonstrated in the chart.

