GTRONIC TF 1DGTRONIC Time Frame Daily
Hai Traders
Nice to review and just follow the trend
Always repeated pattern
Becomes fly to the moon
#thisonlyforpredectionstudy
#thisnotforbuycallorbuysell
#chartpattern
#TAYOR
#MFM.TRADER

DSONIC - TA1. Price candle break out MA 200 on 26 July '23 and BO the DTL thus give strong signal the price movement may change direction to bullish soon.
2. Price candle not yet testing MA 200. Expected the price will PB to MA 200 and shake out weak retailer at the same time form a support.
3. GC (Golden Cross) MA 50 & MA 20 not yet happen above MA 200 thus expect the current price will PB to MA 200 and re-align again to form GC above MA 200.
4. Price candle and MA 200+MA 50+MA 20 not yet align.
5. Price candle need to BO immediate resistance (0.495-0.505) first then we can see more clear the 1st EP.
6. Right now, price candle formed a Doji star candle and this show signs of reversal. Price may PB to MA 200 to form a new support and re-align again for GC above MA 200. After this happen will give possibilities on 1st EP once the price BO and closed above CMT. EW count analysis includes in this TA together with sub wave count.

WCT - TA1. Price candle break out MA 200 on 29 Mar '23 give strong signal the price movement may change direction to bullish soon.
2. Price candle testing MA 200 on 9 May '23 to 3 July '23 to shake out weak retailers. Price candles break out MA 200 again on 4 July '23.
3. GC (Golden Cross) MA 50 & MA 20 happen on 13 July '23 give another strong signal the price is build up the uptrend momentum and ready for bullish.
4. Price candle and MA 200+MA 50+MA 20 has aligned altogether give sign the price is ready for bullish.
5. Price candle has BO strong resistance (0.450-0.465) on 11 Aug 2023 and PB take place to setup a support area at the same price range. This the 1st EP.
6. Two propose EP stated in this WCT TA. 1st EP already happen. Right now, price candle move to next strong resistance. Price may PB to form a new support and this is a possible 2nd EP once the price candle BO and closed above CMT.
7. EW count analysis includes in this TA together with sub wave count. Target wave 3 is still far away. Lot of chances to entry this counter when price candle PB to MA 20/MA50.

GTRONIC ANALYSIS
Price already touch our second entry and attempting to form a cup and handle pattern. Expecting the price to complete the handle formation and break resistance 2 and the short-term trendline, then can look for buying opportunity. This setup is suit for position trader.
This message is for education and information purposes only. It shall not be construed as an offer/solicitation or recommendation to buy/sell any stocks.

EATECH ANALYSISThe direction of this counter is uptrend and price already made a pullback around 61.8% FIBO.
Price already break the sideway trend and start making new high.
This message is for education and information purposes only. It shall not be construed as an offer/solicitation or recommendation to buy/sell any stocks.

JCY - TA1. Price candle break out MA 200 on 13 June '23 give strong signal the price movement may change direction to bullish soon.
2. Price candle testing MA 200 on 24 May '23 to 13 June '23 to shake out weak retailers.
3. GC (Golden Cross) MA 50 & MA 20 happen on 10 July '23 give another strong signal the price is build up the uptrend momentum and ready for bullish.
4. Price candle and MA 200+MA 50+MA 20 has aligned altogether give sign the price is ready for bullish.
5. Price candle still in-progress to BO strong resistance (0.22-0.225). Expected PB will take place once the price candle touch this strong resistance to setup a support area. At this point its a 1st EP.
6. EW analysis cover in this TA including main wave and sub wave count. Correction wave 2 already completed. Price movement in-progress for main wave 3. Target price for main wave 3 at Fibo 1.618 (0.400).

MBN, be the penny or reborn as king?New born baby (IPO).
Previous spoken unable to stand firm. Continue the bearish phase.
Hopefully those bought st 0300 has execute their trading plan and minimum the loses.
Looking for firm support and possible for it to become the king?
Market will show the way of uptrend. Just patient waiting.
Disclaimer: Mentioned stocks are solely based on own opinions for education and/or discussion purpose only. There's no buy and/or sell recommendation. Trading involve financial risk on your own. The author shall not be responsible for any losses or lost profits resulting from investment decisions based on the use of the information contained herein.

DATAPRP - Waiting for breakoutDoes History Repeat Itself? In stock market, it happens. Dataprp currently is sitting on the strong support 0.155. Daily volume shows signs of accumulation activities while stoch RSI is hovering at the oversold region. Breakout with volume will make this counter very interesting.

Accumulated Phase!The candlestick downtrend has probability ended with a fresh buyer which results in volume cross above the MA line.
The MACD and RSI indicate a positive momentum with the price action.
Let's save TEXCHEM in WL and watch out for significant price action movement with a result in volume.
R 0.97
S 0.85


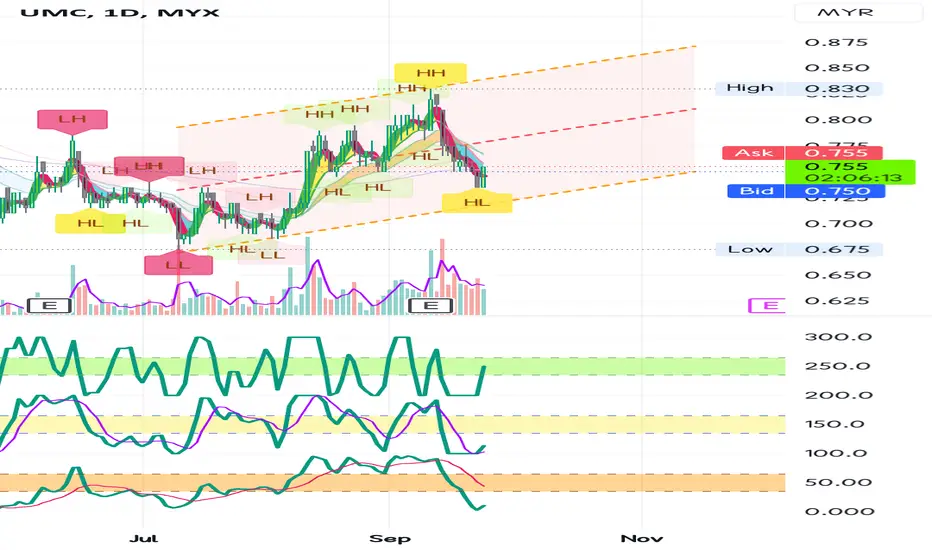
UMC - Looking for support Potential for rebound?
>> Hull MA still red
>> Still trade under red blue sea
>> still OS counter.
Look for potential ladder for safer trade.
Bottom Parallel Channel's line as support.
Disclaimer: Mentioned stocks are solely based on own opinions for education and/or discussion purpose only. There's no buy and/or sell recommendation. Trading involve financial risk on your own. The author shall not be responsible for any losses or lost profits resulting from investment decisions based on the use of the information contained herein.
GFM - TA1. Price candle break out MA 200 on 15 Aug '23 give strong signal the price movement may change direction to bullish soon.
2. Price candle testing MA 200 on 12 May '23 to 14 Aug '23 to shake out weak retailers.
3. GC (Golden Cross) MA 50 & MA 20 happen on 15 Aug '23 is below MA 200 line. Price may PB to MA20/MA50 line to form accumulation area.
4. Price candle and MA 200+MA 50+MA 20 line not yet align, expected a PB will happen soon and price candle may move in accumulation area to get MA line align together.
5. Price candle need BO strong resistance (0.210-0.215) to gain upward momentum.
6. Propose EP area stated in this TA. All MA line need to align first before decide on EP.
7. EW count analysis stated in this TA including with sub-wave count. TP for sub-wave iii is on area Fibo 1.618 (0.270) and TP for main wave 3 is Fibo 1.618 (0.34)

MENANG - TA1. Price candle has break out MA 200 multiple times on 10, 13 Sept '22 and 23 Mar '23 give strong signal the price movement may change direction to bullish soon.
2. Price candle testing MA 200 from 11 May '22 to 21 Mar '23 to shake out weak retailers.
3. GC (Golden Cross) MA 50 & MA 20 happen on 25 Mar '23 give another strong signal the price is build up the uptrend momentum and ready for bullish.
4. Price candle and MA 200+MA 50+MA 20 has aligned altogether give sign the price is ready for bullish.
5. Price candle has to BO strong resistance (0.870-0.905) and possible PB take place to setup a support area at the same price range. This the possible 1st EP.
6. EW count analysis includes in this TA together with sub wave count. Immediate target sub-wave 3 provide in the chart.

KGB - TA1. Price candle break out MA 200 on 7 June '23 give strong signal the price movement may change direction to bullish soon.
2. Price candle testing MA 200 on 18 May '23 to 6 June '23 to shake out weak retailers. Price candles break out MA 200 again on 7 June '23.
3. GC (Golden Cross) MA 50 & MA 20 happen on 29 Aug '23 give another strong signal the price is build up the uptrend momentum and ready for bullish.
4. Price candle and MA 200+MA 50+MA 20 has aligned altogether give sign the price is ready for bullish.
5. Price candle testing strong resistance (1.55-1.58) and PB take place to setup a support area. Price candle BO CMT and hugging MA 20 is the 1st EP.
6. EW analysis includes in this TA together with main wave and sub wave count. Main wave 3 target (Fibo 1.618) include in this TA.


IBHD - TA1. Price candle break out MA 200 on 17 Aug '23 give strong signal the price movement may change direction to bullish soon.
2. Price candle testing MA 200 on 13 Sept '23 and 18 Sept '23 to shake out weak retailers. Price candles maintain closed above MA 200.
3. GC (Golden Cross) MA 50 & MA 20 happen on 30 June '23 give another strong signal the price is build up the uptrend momentum and ready for bullish.
4. Price candle and MA 200+MA 50+MA 20 has aligned altogether give sign the price is ready for bullish.
5. Price candle has BO strong resistance (0.27) for the last 1o years. Price candle has reach immediate resistance and PB may take place to setup new support area close to MA 20/MA 50 line. Identified the Last Red Candle in this PB and wait for next candle the BO and closed above the Last Red Candle.
6. Two propose EP stated in this TA. 1st EP already happen. Right now Price candle has reach immediate resistance and PB may take place to setup a new support area close to MA 20/MA 50 line. Identified the Last Red Candle in this PB and wait for next candle the BO and closed above the Last Red Candle.
7. EW count analysis includes in this TA, main wave 3 is still far away to reach. Ample chances for EP available.

SWIFT - TA1. Price candle break out MA 200 on 20 July '23 give strong signal the price movement may change direction to bullish soon.
2. Price candle testing MA 200 from 21 Aug '23 to 1st Sept '23 to shake out weak retailers. Price candles break out MA 200 again on 4th Sept '23.
3. GC (Golden Cross) MA 50 & MA 20 happen on 22 Sept '23 give another strong signal the price is build up the uptrend momentum and ready for bullish.
4. Price candle and MA 200+MA 50+MA 20 has aligned altogether give sign the price is ready for bullish.
5. Price candle has BO strong resistance (0.51-0.52) on 22 Sept '23. This may become good 1st EP.
6. From EW perspective, price candle may continue upward trend until reach sub-wave III target price which is the next strong resistance. Once price candle reach sub-wave III target price, expect PB may happen to form sub-wave IV. At end of sub-wave IV is may become next EP.
7. Main wave 3 is still far away to reach. Chances for good EP still exist.

IWCITY TF Weekly Iwcity Time Frame Weekly
Got strong momentum coming
Already break resistance and finding cup and handle pattern
Last stand already finished and going to higher and accumulation passes
Wait and see need be patient because you at time frame weekly!!!
#thisonlyforstudy
#notforbuyandsale
#TAYOR
#MFM.TRADER

JFTECH - TA1. Price candle break out MA 200 on 7 June '23 give strong signal the price movement may change direction to bullish soon.
2. Price candle testing MA 200 on 25 Aug '23 to 29 Aug '23 to shake out weak retailers. Price candles break out MA 200 again on 30 Aug '23.
3. GC (Golden Cross) MA 50 & MA 20 happen on 16 June '23 give another strong signal the price is build up the uptrend momentum and ready for bullish.
4. Price candle with MA 200+MA 50+MA 20 in progress to aligned altogether give sign the price is ready for bullish.
5. Price candle has BO strong resistance (0.935) on 11 Sept '23 and PB may take place to setup a support area and GC. Price candle that BO the last red candle at this support area will be the 2nd EP.
6. EW analysis includes in this TA together with sub wave count. Currently price movement in sub-wave 3 of main wave 3. Sub-wave 3 target profit at 1.49.


PECCA - TA1. Price candle break out MA 200 on 24 Aug '23 give strong signal the price movement may change direction to bullish soon.
2. Price candle testing MA 200 on 14 Aug '23 to 23 Aug '23 to shake out weak retailers. Next price candles break out MA 200 on 24 Aug '23.
3. GC (Golden Cross) MA 50 & MA 20 not yet happen, once happen this will give another strong signal the price is build up the uptrend momentum and ready for bullish.
4. Price candle and MA 200+MA 50+MA 20 not yet aligned altogether, once happen this will give sign the price is ready for bullish.
5. Price candle currently try to BO strong resistance (1.07-1.10) on 5 Sept 2023 to 7 Sept 2023. PB may take place to setup a support area at 1.03 - 1.01. At this area GC may happen, once happen this the 1st EP.
6. EW analysis includes in this TA together with sub wave & main wave count. Based on EW analysis, price movement for this counter going to complete Sub wave V - Main wave 5 with target price 1.32- 2.14. This is the last wave before major correction happen.

AWC TECHNICAL ANALYSISTechnical analysis for AWC Stock based on Trend Analysis, Chart Pattern and VPA
1) In Monthly TF
- Rounding Top pattern formation completed. Dec 2021 candle has break the DTL.
- Current price candle trend had significance retracement and rebound at Fibonacci 0.786 indicate new trend establishing itself. Current uptrend movement move higher with increasing volume, volume validate the price action.
- Latest OCT 21 monthly candle shows a body candle with long upper & lower wick accompany by high volume compare to previous volume indicate strong selling & buying pressure occur in the market with buyer has edge out. As long the price action maintains the UTL, the Primary Trend-uptrend movement will continue.
2) In Weekly TF
- Retracement has occur from 12 Apr 2021 to 9 Aug 2021 with price candle move downward along the Downtrend Channel with volume decreases indicate the Market Maker use this downtrend movement to shake out retailer and fill up their warehouse. 30 Aug 2021 candle has begun the uptrend movement.
- Current price candle trend moves upward with several long bullish candle and high volume indicate healthy uptrend movement with highest VAP in 0.455-0.475 area are considered strong support.
- Latest 15 Nov 21 Weekly candle show a Doji Star candle with very long upper wick accompany by very high-volume signal significance selling pressure occur in the market. Price may accumulate with in uptrend channel for several week to remove this seller and establishing new support. As long the price action maintains the Uptrend Channel, the Primary Trend-uptrend movement will continue.
3) In Daily TF
- Overall trend still maintaining the immediate Support line at price 0.545 and maintaining the Uptrend Channel pattern with highest VAP in 0.545-0.555 area are considered as strong support.
- Current daily price candle trend is retraced after the price touch the upper Uptrend Channel line with decreased volume indicate abnormality suggest price may move lower to lower Uptrend Channel line.
- Latest 19 Nov 21 candle give a Bearish candle with lower wick accompany by significance volume give possibility this is Testing-Supply candle with negative result due to significance. Price may move lower breaking the Descending Triangle pattern towards lower Uptrend Channel line to remove the remaining seller. As long the price action maintains the Uptrend Channel, the Secondary Trend-minor downtrend is temporary, and the Primary Trend-uptrend movement will continue.
*Please take note this idea for learning purposes and NOT A BUY CALL.

FPGROUP TECHNICAL ANALYSISTechnical analysis for FPGROUP Stock based on Trend Analysis, Chart Pattern and VPA
1) In Monthly TF
- In this MTF we can see long-term UTL occur from Jun 2018 candle up to July 2020 candle. Aug 2020-Doji Star candle has give signal the reversal will occur and price has move downward since then. Feb 2021 candle has break the long-term UTL and establishing the downtrend phase.
- Current price candle trend had significance retracement begin from Aug 2020 candle and still continue the downtrend. Latest downtrend movement has break the MTF immediate support at price 0.795. This price action tell the downtrend will continue for much longer period.
- Latest OCT 21 monthly candle shows a a Doji Star candle with very long upper wick accompany by low volume signal possibility of this is Demand Test candle that give positive result. Price will move lower and The Primary Trend-continue downtrend.
2) In Weekly TF
- Retracement has occur from 27 July 2020 until now forming a . This downtrend movement has break the Fibonacci 0.5 and entering Fibonacci 0.68 indicate previous bullish trend is ended and a new downtrend is establishing itself.
- Current weekly price candle trend moves downward forming a Downtrend Channel Pattern accompany by decreasing volume. Current price action also shows the price keep forming a new low along the Downtrend Channel pattern. The highest VAP occur at price 0.770-0.810 will become strong resistance.
- Latest 15 Nov 21 Weekly candle show a small bearish candle accompany by low volume signal low activity occur in this downtrend phase. Price may move lower .
3) In Daily TF
- Overall price action still maintaining the Downtrend Channel pattern with highest VAP in 0.805-0.815 area are considered as strong resistance.
- Current daily price candle trend is move downward in Downtrend Channel Pattern accompany by decreasing volume. Formation of Descending Triangle Pattern occur in this Downtrend Channel Pattern telling us weaken demand and bullish momentum due to increasing selling pressure occur in the market. Price candle may move lower to remove this seller and build up the momentum.
- Latest 19 Nov 21 candle give a Shooting Star candle with significance upper wick accompany by low volume signal possibility of this is Demand Test candle that give positive result. Price may move lower for certain period to remove this seller and build up the momentum. As long the price action maintains the Downtrend Channel, the Secondary Trend: the downtrend movement will continue, and the Primary Trend: downtrend movement will prolong.
*Please take note this idea for learning purposes and NOT A BUY CALL.
