TSLA: AnalysisOn TSLA today can see on the chart that the sellers broke the vwap indicator by a large red candle and followed by a large red volume.
Furthermore, as always shown on the chart, we have a high probability that the market will go up.

Remember the .COM bubble?Remember the .COM bubble?
"The dot-com crash was a stark reminder of the risks of speculative investing and the importance of sound financial fundamentals in company valuations."
NVidia is the leader, it will survive, but I think many AI companies will drown when that bubble will burst, and I believe it will.
If your not in yet, too late. If your in, it's time to cash-in. My POV.

Valmond Inc ,,, buy opportinity Uptrend
My main strategy is finding the end of corrections and getting trigger as a new uptrend.
The best zone for finishing corrections is 50-61.8 Fib Ret then breaking a descending trend line and passing out of a price level. I suppose this is one of the best and by setting a sl in a sure place, like 240, You can get a buying position on it.

UBER Swing Trade Cup and Handle This is a cup and handle pattern on the daily in UBER. I am bullish with a stop loss at $65 and a first Profit Target at $80. If the S&P shows buying strength in the I will open a position.

How much longer can $NVDA keep this up!?In this video we breakdown the raging bull NVDA and just how much longer can this stock keep going. In my opinion this thing cant be stopped and even when you think the short entry is safe the rug gets pulled. Let me know your thoughts!

NVDA - Short/Mid Term DownThe Craziness has contunied!!
I expect a rapid Market Structure Shift after we touch the upper Trendline @ 140ish.
We could see a Red Weekly candle for this week and/or a shooting star.
Targets: Previous lows
- 117$
Yes, I expect a 15-20% pullback
Long Term Target by EOY: 195$

$HOLO might push hard in july/augustWe havent seen green for a while.
Im guessing this will drop a total of 50% from 4th of June , currently it has 20% more to drop, its the same resemblence as the last explosion.
I may not be right but its just my idea, i will be DCA'ing.

Nvidia Uptrend Pattern At $136.51. 19.06.2024Nvidia shows an uptrend pattern on the 4-hour chart with the current price at $136.51.
If $136.51 is breached to the upside:
Potential targets: $147.18 and further up to $160.77 upon breaking $147.18.
Conversely, if price reverses from $136.51:
Potential downside targets: $128.11 and further down to $121.51 upon breaking $128.11.
Apply risk management
Risk Warning: Trading in CFDs is highly speculative and carries a high level of risk. It is possible to lose all of your invested capital. These products may not be suitable for everyone, and you should ensure that you fully understand the risks taking into consideration your investment objectives, level of experience, personal circumstances as well as personal resources. Speculate only with funds that you can afford to lose. Seek independent advice if necessary. Please refer to our Risk Disclosure.
BDSwiss is a trading name of BDS Markets and BDS Ltd.
BDS Markets is a company incorporated under the laws of the Republic of Mauritius and is authorized and regulated by the Financial Services Commission of Mauritius ( FSC ) under license number C116016172, address: 6th Floor, Tower 1, Nexteracom Building 72201 Ebene.
BDS Ltd is authorized and regulated by the Financial Services Authority Seychelles (FSA) under license number SD047, address: Suite 3, Global Village, Jivan’s Complex, Mont Fleuri, Mahe, Seychelles. Payment transactions are managed by BDS Markets (Registration number: 143350)
Disclaimer

$RKLB - Potential sentiment changeNASDAQ:RKLB Rocket Lab came close to its first target of $5 and closed above the VWAP.
This is the first time the stock has reacted positively to good news, which indicates a potential shift in sentiment. Although it's still early, the volume on this uptick and the oscillators support this sentiment change.
Closing above $5 could provide an opportunity to form a higher base, from which it could launch further.🚀

BIG Moves to come in PLTRWeekly RSI Breakout soon to come on the start if this Wave 3 push. I would bet we take out the all time high on wave 3 but conservative NYSE:PLTR Fib levels shown.

Dell Stock: Analyzing Key LevelsDell stock is currently trading within a range of $150 to $180 .
If the upper level of this range breaks with high volume , the price may continue to rise, albeit with less momentum compared to the recent buying activity.
The value zone, defined by the all-time Fibonacci levels, is set around $96 and $76 . Below these levels, the stock price will likely require a long-term accumulation phase before returning to previous highs.

Support Line Based on the analysis, Support Line 1 has a potential for further decline and may reach Support Lines 2 and 3.
"Investors should understand the nature of the product, return conditions, and risks before making investment decisions."

NVIDIA 176% YTD GAINS 2024 NASDAQ:NVDA 🚀 NVIDIA’s Stellar Ascent: A 176% YTD Surge! 🚀
In the high-stakes world of tech stocks, NVIDIA has emerged as the year’s undisputed champion, boasting a jaw-dropping 176% increase in its stock price year-to-date. Here’s a snapshot of why NVIDIA is the talk of Wall Street:
Market Cap Milestone: NVIDIA has not only skyrocketed in stock value but also achieved a monumental market cap of $3.335 trillion, surpassing tech giants like Microsoft to become the most valued company in the world.
Stock Split Magic: The company’s recent 10-for-1 stock split has made its shares more accessible to a broader range of investors, fueling the fire of its already impressive rally.
Generative AI Gold Rush: NVIDIA sits at the forefront of the generative AI revolution, with its GPUs being the powerhouse behind the scenes. This sector is projected to reach a staggering $967.6 billion by 2032, and NVIDIA’s leading-edge technology is poised to reap the benefits.
ETF Rebalance: A leading tech ETF has shifted its balance, significantly increasing its stake in NVIDIA. This strategic move involves a massive $23 billion stake exchange, highlighting the confidence investors have in NVIDIA’s future.
Wall Street’s Vote of Confidence: Analysts are bullish, with predictions that NVIDIA’s stock could soar to $200. The consensus is clear: NVIDIA is expected to dominate the computing market for the next decade.

Guidewire lands major insurance clientSoftware development company Guidewire Software, Inc. announced a partnership with the large American insurance company Columbia Insurance, which operates in dozens of US states. As a result, Guidewire remains one of the leading insurance software providers, able to attract valuable customers.
Under this partnership, Columbia Insurance will leverage Guidewire's cloud-based solutions as the technological backbone for its case management and customer engagement processes. The company plans to complete the deployment and launch of the new IT infrastructure shortly.
It is a positive sign that a large customer like Columbia Insurance is ultimately moving away from legacy IT solutions by implementing Guidewire software across all its business lines and branches. In this respect, the insurance company will soon be working with all its clients using solutions from Guidewire.
Let's review the technical analysis of Guidewire Software, Inc. (NYSE: GWRE) shares to explore potential trading opportunities.
On the Daily (D1) timeframe, resistance has formed at 136.45 USD with support at 129.00 USD. A steady upward trend began at the end of June 2023. If the trend reverses downward, the fall target may be 102.80 USD.
In an optimistic scenario for the company's shares, where an upward trend persists, and the resistance level is broken through at 136.45 USD, the short-term target could be set at 145.15 USD. In the medium term, the price may rise to 156.35 USD.
__
Ideas and other content presented on this page should not be considered as guidance for trading or an investment advice. RoboMarkets bears no responsibility for trading results based on trading opinions described in these analytical reviews.
The material presented and the information contained herein is for information purposes only and in no way should be considered as the provision of investment advice for the purposes of Investment Firms Law L. 87(I)/2017 of the Republic of Cyprus or any other form of personal advice or recommendation, which relates to certain types of transactions with certain types of financial instruments.
Risk Warning: CFDs are complex instruments and come with a high risk of losing money rapidly due to leverage. 69.88% of retail investor accounts lose money when trading CFDs with this provider. You should consider whether you understand how CFDs work and whether you can afford to take the high risk of losing your money.

DE - Ground up multi-time frame analysisHere we'll build the chart together from the weekly down and see how we can start tot ell the story of the chart and see the patterns. This gives us a good forecast and understanding of why price is where it is and where we can see it going.
Hope this was helpful as it's more of a tutorial style video for those watching and looking to better understand.
Happy Trading :)

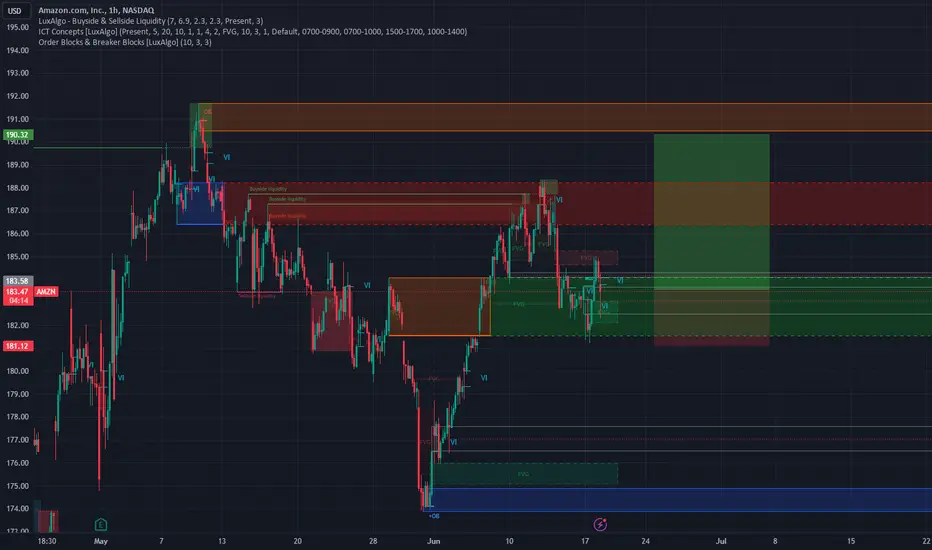
Analysis of Amazon (AMZN) Price Action: Short to Medium Term OutAnalysis of Amazon (AMZN) Price Action: Short to Medium Term Outlook
Upon examining the hourly timeline for Amazon (AMZN), it becomes evident that the stock is currently testing a significant support level that has been established since late April. This support line has proven resilient, having been touched multiple times over the past few weeks.
Technical Analysis Overview
Support Line Analysis: The repeated tests of the support line suggest that it is a robust level where buyers have consistently stepped in to prevent further declines. This indicates strong buying interest whenever the stock approaches this zone.
Bullish Signal: The bounce off this support line in the recent price action signals a potential bullish reversal in the short to medium term. This pattern often suggests that buyers are willing to enter at these levels, viewing the current price as attractive for accumulation.
Volume Confirmation: It would be prudent to confirm this potential reversal with a look at trading volumes. Ideally, an increase in volume accompanying the bounce off support would strengthen the bullish case, indicating conviction among buyers.
Resistance Levels: As the stock attempts to bounce, the next critical hurdle will be overcoming nearby resistance levels. These levels could coincide with previous highs or key moving averages, which may act as barriers in the short term.
Market Sentiment and Economic Indicators
Macro Environment: Understanding the broader market sentiment and economic indicators can provide context. Factors such as consumer spending trends, economic data releases, and sector-specific news can impact Amazon’s stock performance.
Competitive Landscape: Monitoring developments among Amazon’s competitors and within the e-commerce sector can also offer insights into future price movements.
Conclusion
In conclusion, the current technical setup on the hourly chart of Amazon (AMZN) suggests a bullish outlook in the short to medium term. The repeated testing and bounce off the strong support line since late April indicate resilience and potential accumulation by market participants. However, traders and investors should remain vigilant for any signs of reversal or failure to sustain above resistance levels. Confirmation through volume and market sentiment analysis will be crucial in validating this bullish scenario.
This analysis provides a foundation for decision-making but should be complemented with broader market analysis and risk management strategies to navigate potential volatility and market uncertainties effectively.

Updated AMZN inverse H&SHere is the weekly view of the AMZN inverse head and shoulders I finished a while ago. I added a demand zone as well. You will note a nice bounce on the 20EMA supporting this idea long-term. My short-term target is still 210$ here. A brief dip into demand and blastoff is my prediction.
-A test of 189$ is needed before the 210$, this is the area of resistance that would allow for price discovery as well
-There is not much resistance until that point

$RKLB Chart is setting up with 10%+ move today, on news.NASDAQ:RKLB is moving to the upside today (+10%) on news of partnership for 10 coordinated launches.
The space economy is a long-shot, but this a gamble I'm willing to take.
I chose to initiate this position to have exposure to more small and mid-cap growth tech companies, this one I really like.
I have detailed my long-term targets on the chart.
My position was initiated at $3.70 - $3.90 BUY target.
Another that I have been holding for a while is NYSE:JMIA , who has the opportunity for explosive growth as their native economy continues to expand.
I like to think of them as the Amazon of Africa...


Micron Technology : Pattern is top Hello there,
Big Canal since 2015. Top is here or probably here.
A short or a take profit here is interesting.
A false breakout is very possible.
Good luck !

#NOCIf noc holds 433 we will most likely see a break of the current downtrend and a continuation upwards.
(Came across the dip yesterday and bought some contracts personally). Took profit at 430.
If price breaks 433 we might see 1st target of 445 zone followed by 2nd target around 460.
(Did this one in a hurry, will do some more tech to confirm, stay tuned).

AT&T Has Been Fighting HigherAT&T has been fighting higher, and some traders may see an opportunity in the latest pullback.
The first pattern on today’s chart is the falling trendline along the highs of February and April. T broke above it in late May and proceeded to hit a new 52-week high early this month. Notice how prices have retreated and now seem to be stabilizing at the trend line.
Second is the May 20 close of $17.52. The telecom stock probed below that point Thursday, Friday and Monday, but each time closed above it.
Both of those points may suggest that old resistance has become new support.
Next, the 8-day exponential moving average (EMA) remained above the 21-day EMA amid the latest pullback.
Finally, the 50-day simple moving average (SMA) had a “golden cross” above the 200-day SMA in December.
Those points may reflect bullish trends in both the short and longer terms.
TradeStation has, for decades, advanced the trading industry, providing access to stocks, options and futures. See our Overview for more.
Past performance, whether actual or indicated by historical tests of strategies, is no guarantee of future performance or success. There is a possibility that you may sustain a loss equal to or greater than your entire investment regardless of which asset class you trade (equities, options or futures); therefore, you should not invest or risk money that you cannot afford to lose. Online trading is not suitable for all investors. View the document titled Characteristics and Risks of Standardized Options at www.TradeStation.com . Before trading any asset class, customers must read the relevant risk disclosure statements on www.TradeStation.com . System access and trade placement and execution may be delayed or fail due to market volatility and volume, quote delays, system and software errors, Internet traffic, outages and other factors.
Securities and futures trading is offered to self-directed customers by TradeStation Securities, Inc., a broker-dealer registered with the Securities and Exchange Commission and a futures commission merchant licensed with the Commodity Futures Trading Commission). TradeStation Securities is a member of the Financial Industry Regulatory Authority, the National Futures Association, and a number of exchanges.
TradeStation Securities, Inc. and TradeStation Technologies, Inc. are each wholly owned subsidiaries of TradeStation Group, Inc., both operating, and providing products and services, under the TradeStation brand and trademark. When applying for, or purchasing, accounts, subscriptions, products and services, it is important that you know which company you will be dealing with. Visit www.TradeStation.com for further important information explaining what this means.

Amazon Will Soon See Its All Time High AgainReasons why we are bullish for Amazon:
stable fundamentals that point to constant growth
healthy macroeconomic environment with falling inflation
clear stabilization of the share price within a bullish order block with bullish price action
strong performance of the US indices, especially the NASDAQ