Bear Call - TeslaBear Call for 15 Nov'24
Sell Call 120
Buy C all 140
Return / Risk > 3
You can also use the TradingView Options - Strategy Builder (beta) to determine return/risk profiles for a number of equities

PEPG: Tight consolidationPEPG: Tight consolidation
-ABCD pattern.
-Inversed HnS pattern.
-Key level resistence.
-Demand zone support.
.
US STOCKS- WALL STREET DREAM- LET'S THE MARKET SPEAK!
FB : US STOCKS- WALL STREET DREAM

Agilent Reports Second-Quarter Fiscal Year 2024 Financial ResultAgilent Technologies Inc. (NYSE: NYSE:A ) reported a revenue of $1.57 billion for the second quarter of fiscal year 2024, down 8.4% reported and 7.4% core compared to the second quarter of 2023. GAAP net income was $308 million, with earnings per share (EPS) of $1.05, up 3% from the second quarter of 2023. Non-GAAP(2) net income was $356 million, with EPS of $1.22, down 4% from the second quarter of 2023. The full-year revenue outlook was revised at $6.420 billion to $6.500 billion, representing a range of down 6.0% to 4.9% on a reported basis and down 5.4% to 4.3% core. Fiscal year 2024 non-GAAP(3) earnings guidance was revised at a range of $5.15 to $5.25 per share.
The company plans to repurchase $0.75 billion of its common stock by the end of the fiscal year, and the board recently authorized a new $2.0 billion share repurchase program. The company's president and CEO, Padraig McDonnell, expressed confidence in the future and excited about the opportunities that lie ahead for Agilent.
In the first quarter of 2024, Agilent (NYSE: NYSE:A ) implemented certain changes to its segment reporting structure, which have no impact on its consolidated financial statements. The Life Sciences and Applied Markets Group reported second-quarter revenue of $754 million, a decline of 14% reported and 13% core year-over-year. The Agilent CrossLab Group (NYSE: NYSE:A ) reported second-quarter revenue of $402 million, an increase of 4% reported and 5% core year-over-year. The Diagnostics and Genomics Group reported second-quarter revenue of $417 million, a decrease of 9% reported and 8% core year-over-year.
The full-year revenue outlook is revised at $6.420 billion to $6.500 billion, representing a range of down 6.0% to 4.9% on a reported basis and down 5.4% to 4.3% core. The outlook for third-quarter revenue is expected in the range of $1.535 billion to $1.575 billion, a decline of 8.2% to 5.8% reported and 6.9% to 4.5% core.
Technical Outlook
Agilent ( NYSE:A ) stock is down 18.36% in pre-market trading on Thursday starting on a rough slate it technically means Agilent stock is in a oversold region forming a downside gap. Gapping occurs in trading when there is no trading activities that occur but a stock is under-performing or outperforming prior to a fundamental.

NVIDIANVIDIA : Sell
Open: 1142
SL: 1200
TP: 955
Nvidia is a leading company in the design, manufacturing, and marketing of graphics processing units (GPUs), central processing units (CPUs), and parallel computing. Founded in 1993, it is headquartered in Santa Clara, California. Nvidia is renowned for its advanced GPUs used in gaming, scientific computing, artificial intelligence, self-driving cars, and other applications.
**Reasons for Selling Nvidia Stock:**
1. **Price Increase:** The primary reason for selling Nvidia stock may be its significant price appreciation, prompting some investors to consider profit-taking.
2. **Market Evaluation:** Some investors may believe that the market has overvalued Nvidia, and the stock may be overpriced relative to expected returns.
3. **Sector Risks:** Nvidia operates in the technology sector, known for its rapid fluctuations and transformations. Some investors may prefer to reduce exposure to the risks associated with this sector.
4. **Investment Assessment:** There may be an investment assessment suggesting better returns in other sectors, prompting some investors to reduce their positions in Nvidia and reallocate capital to other investment opportunities.
5. **Financial Return Expectations:** Investors' expectations of Nvidia's future financial returns may also influence their decision to sell, as negative forecasts could impact the stock price.

METAMETA : SELL
Open:472.36
SL: 540
TP 1 : 301
TP 2 : 167.70
=======================
### Risk and Uncertainty for Meta
-------------------------------------------
Our Uncertainty Rating for Meta is High. Although barriers to exit are increasing for users of Facebook and its suite of apps, emerging technologies, like TikTok, could diminish user engagement on Meta's platforms. Growth in one social network often comes at the expense of others, potentially reducing engagement and advertiser returns on Meta's apps. Despite Meta's strong market position, its reliance on online advertising makes it vulnerable to extended downturns in ad spending, especially during prolonged economic slumps.
Additionally, Meta's heavy reliance on user behavior data poses significant environmental, social, and governance risks. Regulatory bodies worldwide may impose restrictions on the data Meta can collect and how it is used. Issues related to data privacy, security, or misuse could drive users away from its platforms.

"Healthy Momentum"A simple trading strategy could be based on moving averages: Buy when the shorter-term moving average (e.g., 50-day) crosses above the longer-term moving average (e.g., 200-day) and sell when the opposite occurs. Implement risk management by setting stop-loss orders to limit losses. Additionally, consider using technical indicators like RSI or MACD for confirmation. Adapt the strategy to fit individual risk tolerance and market conditions. Regularly review and adjust the strategy as needed.

FFIE | Faraday Future Intelligent Electric | idea | key levelsFFIE | Faraday Future Intelligent Electric | idea | key levels
NASDAQ:FFIE
Each line is important of xd-Band12
good if closing and opening above $1.8

$SHOP will push higher to end 2Q24May 30, 2024 @6:57AM
MONTHLY
- Currently on a downtrend (2D-2D-2D Continuation) #TheStrat
- Finishing off a Stage 3 #TheMoneyFlow
- MACD curling down, RSI curling down at 46
WEEKLY
- MACD beginning to curl up
- Price is b/t the 0.618 & 0.786 monthly fibs (Oct 2023 - Feb 2024)
- Price is slightly under last week's middle price of $58.51 at $58.18 (pre-market)
DAILY
- Price appears to moving upward after touching lower weekly broadening formation (BF) #thestrat
- Gap to be filled above ($64-75) and gap to be filled below ($55-$48)
- MACD and RSI curling up
- On May 28, NYSE:GS maintained NYSE:SHOP as a BUY
DECISION:
HOLDING 2 NYSE:SHOP 65C 19 JUL 24 (AVG: $1.76) (DOWN 30% @ 1.25).

NFLX: Rising Wedge (Short Term)Key Points: NASDAQ:NFLX
1. A raising wedge pattern is used to identify possible trend reversals.
2. It is considered a bearish pattern.
3. It signals that the buying momentum is slowing down.
resistance - 666.56
support -637.88
N.B:
I am skilled in day and swing trading. Otherwise, I am skilled in technical analysis such as trend, chart pattern, trade set up, entry and target set up, resistance, support, etc.

AAPL: Sideways Trend(Short Term)Key Points: NASDAQ:AAPL
* Sideways Trend may be continued.
* The price may be stayed between Resistance and support .
Resistance - 192.70
Support - 186.67
N.B:
I am skilled in day and swing trading. Otherwise, I am skilled in technical analysis such as trend, chart pattern, trade set up, entry and target set up, resistance, support, etc.

Technical Analysis of Salesforce.As of the latest close, Salesforce (CRM) is trading at $271.62, up by $1.79 (0.66%). The pre-market data shows a significant drop to $228.03, down by $43.59 (-16.05%). This sharp pre-market decline suggests potential upcoming volatility.
Relative Strength Index (RSI): The RSI value is 39.75, indicating a neutral to slightly oversold condition. This suggests that while the stock is not extremely oversold, it is approaching levels that could attract buyers.
Stochastic %K: At 16.23, the Stochastic %K is neutral, suggesting limited momentum either way.
Commodity Channel Index (CCI): The CCI is at -96.65, also indicating a neutral position.
Average Directional Index (ADX): The ADX is 22.46, indicating a weak trend.
Momentum (10): This is a buy signal with a value of -5.18, indicating short-term bullish momentum.
MACD Level (12, 26): At -2.03, the MACD indicates a sell signal, suggesting bearish momentum.
The majority of moving averages, including the 10-day, 20-day, 30-day, 50-day, and 100-day, suggest a sell signal. The 200-day exponential moving average is a buy at 260.29, indicating long-term support around this level.
Support Levels: S1 at 254.43, S2 at 239.92, and S3 at 196.98.
Resistance Levels: R1 at 297.38, R2 at 325.81, and R3 at 368.76.
Pivot Point: 282.87.
The recent candlestick patterns and Ichimoku Cloud analysis indicate a bearish trend, with the price moving below the cloud and key resistance levels. The RSI and MACD corroborate this bearish sentiment.
Short Position: Enter a short position if the price breaks below the pre-market low of $228.03. Set a stop-loss at $240.00 to limit potential losses. The first target for the short position would be the S2 support level at $239.92, followed by S3 at $196.98 if bearish momentum continues.
Long Position: Consider entering a long position if the stock shows signs of recovery and breaks above the pivot point at $282.87. Set a stop-loss at $275.00. The first target for this long position would be R1 at $297.38, followed by R2 at $325.81.
Salesforce (CRM) is currently showing bearish signals across multiple technical indicators and moving averages. The significant pre-market drop suggests a bearish sentiment that could persist. Traders should look for short opportunities below $228.03 with cautious stop-loss settings, and only consider long positions if there is a definitive break above the pivot point at $282.87. The upcoming earnings report on August 28 could be a catalyst for future price action, so keeping an eye on fundamental developments is crucial.

TSLA : Trend AnalysisKey Points : NASDAQ:TSLA
* Sideways Trend may be continued.
* The price may be stayed between Resistance and support .
Resistance - 186.39
Support - 168.28
N.B:
I am skilled in day and swing trading. Otherwise, I am skilled in technical analysis such as trend, chart pattern, trade set up, entry and target set up, resistance, support, etc.

PalentirHi I think is possible buy Palentir, it's a little early but if broke line tendencial is posible a make a Pullback and I add more positions

APPLEAPPLE : Sell
Open: 190.65
SL: 201
TP: 145
=====================
Nvidia's shares surged by 6%, reaching a record high, positioning the market value of the AI chip manufacturer just $100 billion shy of surpassing Apple. The latest trade of Nvidia's stock was at $1,128, pushing its market value to $2.8 trillion, compared to Apple's $2.9 trillion. Apple remains the second most valuable company on Wall Street, after Microsoft.
Nvidia's stock has more than doubled this year, following a tripling in value last year. Recently, Nvidia, a major beneficiary of the AI boom, reported a fivefold increase in revenue from its data center sector, driven by high demand for its high-performance chips.
Dan Coatsworth, an investment analyst at AJ Bell, commented on the stock's rise, stating, "The business is performing exceptionally well, with significant growth opportunities ahead. The AI theme continues to have strong momentum."
Apple, traditionally a must-have stock on Wall Street, has underperformed compared to other major tech companies in recent months, with a 2% decline this year. The company faces challenges from weakened demand for iPhones and intense competition in China.

Why hold Tesla instead of Silver?Why hold Tesla instead of Silver?
#Tesla (priced in #silver) topped over 2 years ago, down slightly over 67%.
You want to own instruments with price trending upwards after a breakout, not before.

The Nasdaq reaches a critical resistance and could reverse.The Nasdaq is forming a falling triangle pattern. It has been in an uptrend since October 2023, as have the stocks that comprise the Nasdaq. At the moment, it is approaching the resistance line on the upside and could get rejected. What does this mean for the other stocks?
- On the 3-line indicator, the mid-trend line (blue) crosses below the long-trend line (green), which is bearish.
- On the RSI, the RSI line crosses below the moving average, indicating a reversal.
The last time this happened was in November 2022.


0.4142 Fib Level example on AAPLThe system works. This is so I can link this idea in my longer idea I am posting shortly.

Easy money with ASTS stockI am following ASTS trend few years ago and I made a conclusion of a cyclic trend as shown in the chart.
Now it is in the bottom, expect 2X minimum within next 3 months.
Good luck!
This is not a financial advice.

Buy the Dip on this H&S!One of the best alternative investment funds in the world, arguably the best with a 4% divi while delivering 20% returns for the last 40 years and similar guidance for next 20. Current valuation seems a tad high given MRQ/Q growth so this pullback can be justified however the history of this company's returns warrant closer inspection.
Currently unconfirmed H&S pattern w/ a potential target from 34-36.

TSLA-TRADING-RANGETESLA is trading in range between support and resistance if price broke support 1 price may go bearish and if price break R1 price may test R2 and retest R!

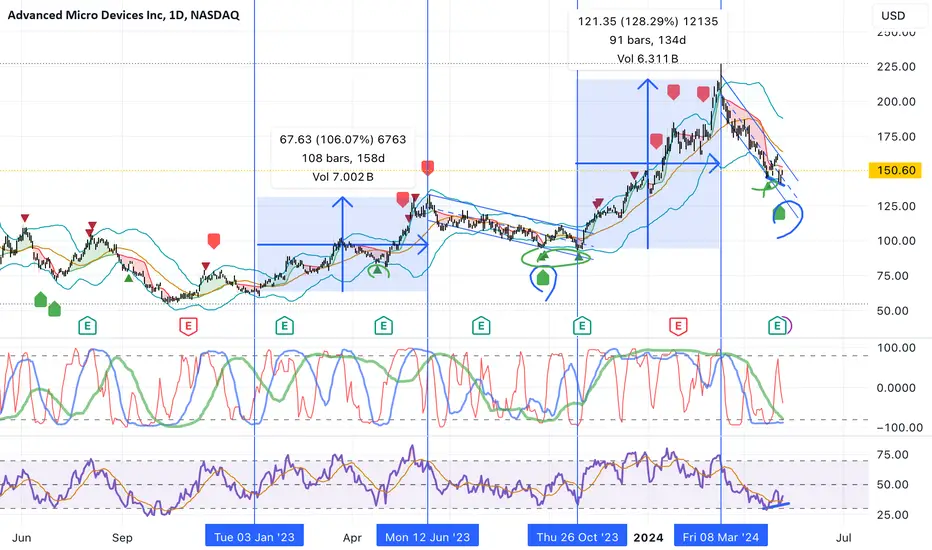
AMDs retracement might come to an end soon. Watch closely.The last retracement to the downside was about 30%. This has been completed.
- The 3 Lines (Long, middle and lower trend) are almost on the bottom.
- The RSI is forming a bullish div on the last move.
- A green bullish signal appeared.
- Price came outside of the BB and closed back inside.
Many indications that the downtrend might come to an end soon or has already.
I keep an eye on it.
Because someone had to short this.We will consider one technical indicator:
F = (G * m1 * m2) / d^2
Aka “gravity”
