Yield Curve Percent Inverted
Updated
**************************************************************************************************
Yield Curve Percent Inverted Indicator
This indicator will check all fifty-five Treasury Bond Yield spreads - every combination from
1-month up to 30-year - and then graph the percentage of spreads which are inverted.
Yield curve inversion occurs when the longer-duration bond pays a lower yield than the shorter-
duration bond. Longer-dated bonds normally pay a higher yield because the investor's money is
committed for a longer period of time. Inversion occurs when investors have little confidence
in the near-term economy and demand higher rates for short-term investments.
Historically, a few months ahead of a recession this percent-inverted value will spike up into
the 60%-70% range - you can see this behavior in 1989, 2000, 2007, and 2019. (Note that there
is no data available on Trading View prior to 1987.)
**************************************************************************************************
Release Notes
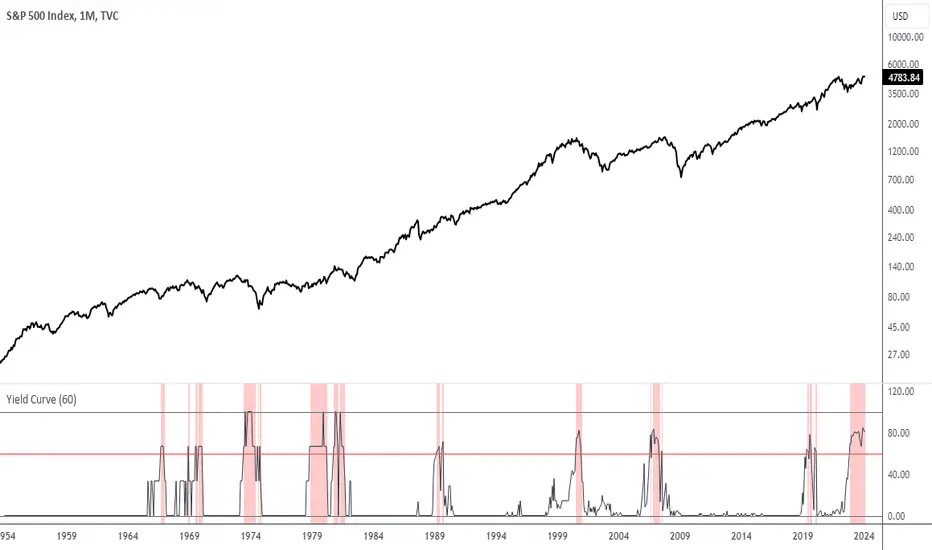
Yield Curve Percent Inverted IndicatorThis indicator checks all seventy-eight Treasury Bond Yield spreads - every combination from
1-month up to 30-year - and then graph the percentage of spreads which are inverted.
Yield curve inversion occurs when the longer-duration bond pays a lower yield than the shorter-
duration bond. Longer-dated bonds normally pay a higher yield because the investor's money is
committed for a longer period of time. Inversion occurs when investors have little confidence
in the near-term economy and demand higher rates for short-term investments.
Historically, a few months ahead of a recession this percent-inverted value will spike up into
the 60%-70% range - you can see this behavior throughout the 1960's and 1970's, as well as in
1989, 2000, 2007, and 2019/2020. As of 2023-2024 the Yield Curve has been very inverted for
quite a while but no recession yet.
Jan 2024 update
- Convert to PineScript v5
- Include 4-month and 20-year bonds
- Replace tedious expressions with array and nested for loop
Open-source script
In true TradingView spirit, the author of this script has published it open-source, so traders can understand and verify it. Cheers to the author! You may use it for free, but reuse of this code in publication is governed by House rules. You can favorite it to use it on a chart.
Want to use this script on a chart?
Disclaimer
The information and publications are not meant to be, and do not constitute, financial, investment, trading, or other types of advice or recommendations supplied or endorsed by TradingView. Read more in the Terms of Use.