MarketCapLibrary2Library "MarketCapLibrary2"
setMarketCapMap(m)
Parameters:
m (map)
getMarketCap(ticker)
Parameters:
ticker (string)
Arrays

MarketCapLibrary1Library "MarketCapLibrary1"
setMarketCapMap(m)
Parameters:
m (map)
getMarketCap(ticker)
Parameters:
ticker (string)

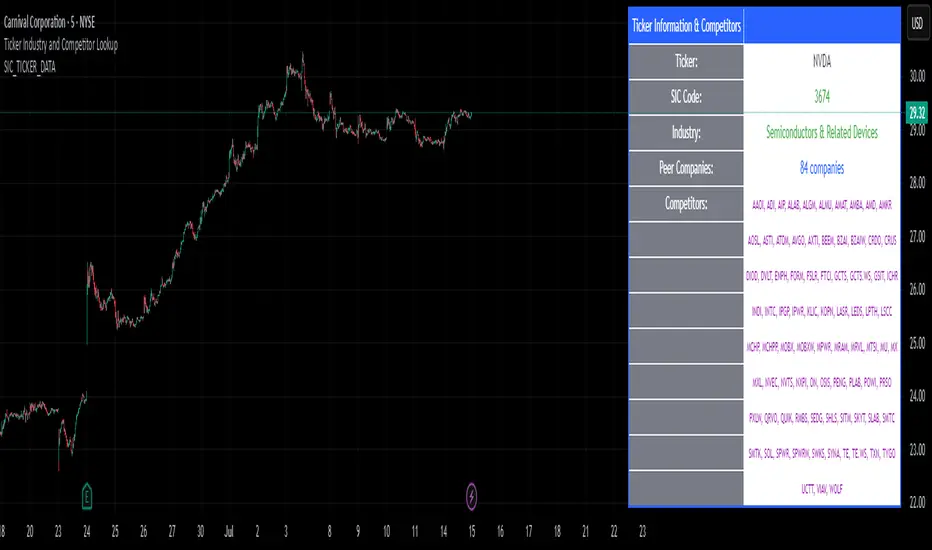
SIC_TICKER_DATAThe SIC Ticker Data is an advanced and efficient library for ticker-to-industry classification and sector analysis. Built with enterprise-grade performance optimizations, this library provides instant access to SIC codes, industry classifications, and peer company data for comprehensive market analysis.
Perfect for: Sector rotation strategies, peer analysis, portfolio diversification, market screening, and financial research tools.
The simple idea behind this library is to pull any data related to SIC number of any US stock market ticker provided by SEC in order to see the industry and also see the exact competitors of the ticker.
The library stores 3 types of data: SIC number, Ticker, and Industry name. What makes it very useful is that you can pull any one of this data using the other. For example, if you would like to know which tickers are inside a certain SIC, or what's the SIC number of a specific ticker, or even which tickers are inside a certain industry, you can use this library to pull this data. The idea for data inside this library is to be accessible in any direction possible as long as they're related to each other.
We've also published a simple indicator that uses this library in order to demonstrate the inner workings of this library.
The library stores thousands of tickers and their relevant SIC code and industry for your use and is constantly updated with new data when available. This is a large library but it is optimized to run as fast as possible. The previous unpublished versions would take over 40 seconds to load any data but the final public version here loads the data in less than 5 seconds.
🔍 Primary Lookup Functions
createDataStore()
Initialize the library with all pre-loaded data.
store = data.createDataStore()
getSicByTicker(store, ticker)
Get SIC code for any ticker symbol.
sic = data.getSicByTicker(store, "AAPL") // Returns: "3571"
getIndustryByTicker(store, ticker)
Get industry classification for any ticker.
industry = data.getIndustryByTicker(store, "AAPL") // Returns: "Computer Hardware"
getTickersBySic(store, sic)
Get all companies in a specific SIC code.
software = data.getTickersBySic(store, "7372") // Returns: "MSFT,GOOGL,META,V,MA,CRM,ADBE,ORCL,NOW,INTU"
getTickersByIndustry(store, industry)
Get all companies in an industry.
retail = data.getTickersByIndustry(store, "Retail") // Returns: "AMZN,HD,WMT,TGT,COST,LOW"
📊 Array & Analysis Functions
getTickerArrayBySic(store, sic)
Get tickers as array for processing.
techArray = data.getTickerArrayBySic(store, "7372")
for i = 0 to array.size(techArray) - 1
ticker = array.get(techArray, i)
// Process each tech company
getTickerCountBySic(store, sic)
Count companies in a sector (ultra-fast).
pinescripttechCount = data.getTickerCountBySic(store, "7372") // Returns: 10
🎯 Utility Functions
tickerExists(store, ticker)
Check if ticker exists in database.
exists = data.tickerExists(store, "AAPL") // Returns: true
tickerInSic(store, ticker, sic)
Check if ticker belongs to specific sector.
isInTech = data.tickerInSic(store, "AAPL", "3571") // Returns: true
💡 Usage Examples
Example 1: Basic Ticker Lookup
// @version=6
import EdgeTerminal/SIC_TICKER_DATA/1 as data
indicator("Ticker Analysis", overlay=true)
store = data.createDataStore()
currentSic = data.getSicByTicker(store, syminfo.ticker)
currentIndustry = data.getIndustryByTicker(store, syminfo.ticker)
if barstate.islast and currentSic != "NOT_FOUND"
label.new(bar_index, high, syminfo.ticker + " SIC: " + currentSic + " Industry: " + currentIndustry)
Example 2: Sector Analysis
// @version=6
import EdgeTerminal/SIC_TICKER_DATA/1 as data
indicator("Sector Comparison", overlay=false)
store = data.createDataStore()
// Compare sector sizes
techCount = data.getTickerCountBySic(store, "7372") // Software
financeCount = data.getTickerCountBySic(store, "6199") // Finance
healthCount = data.getTickerCountBySic(store, "2834") // Pharmaceutical
plot(techCount, title="Tech Companies", color=color.blue)
plot(financeCount, title="Finance Companies", color=color.green)
plot(healthCount, title="Health Companies", color=color.red)
Example 3: Peer Analysis
// @version=6
import EdgeTerminal/SIC_TICKER_DATA/1 as data
indicator("Find Competitors", overlay=true)
store = data.createDataStore()
currentSic = data.getSicByTicker(store, syminfo.ticker)
if currentSic != "NOT_FOUND"
competitors = data.getTickersBySic(store, currentSic)
peerCount = data.getTickerCountBySic(store, currentSic)
if barstate.islast
label.new(bar_index, high, "Competitors (" + str.tostring(peerCount) + "): " + competitors)
Example 4: Portfolio Sector Allocation
// @version=6
import EdgeTerminal/SIC_TICKER_DATA/1 as data
indicator("Portfolio Analysis", overlay=false)
store = data.createDataStore()
// Analyze your portfolio's sector distribution
portfolioTickers = array.from("AAPL", "MSFT", "GOOGL", "JPM", "JNJ")
sectorCount = map.new()
for i = 0 to array.size(portfolioTickers) - 1
ticker = array.get(portfolioTickers, i)
industry = data.getIndustryByTicker(store, ticker)
if industry != "NOT_FOUND"
currentCount = map.get(sectorCount, industry)
newCount = na(currentCount) ? 1 : currentCount + 1
map.put(sectorCount, industry, newCount)
🔧 Advanced Feature
You can also bulk load data for large data sets like this:
// Pre-format your data as pipe-separated string
bulkData = "AAPL:3571:Computer Hardware|MSFT:7372:Software|GOOGL:7372:Software"
store = data.createDataStoreFromBulk(bulkData)
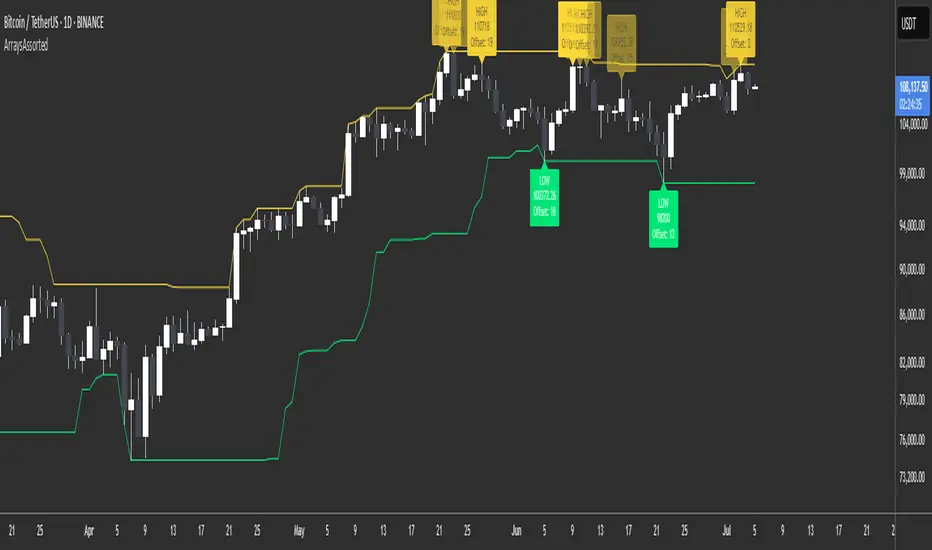
ArraysAssorted🟩 OVERVIEW
This library provides utility methods for working with arrays in Pine Script. The first method finds extreme values (highest/lowest) within a rolling lookback window and returns both the value and its position. I might extend the library for other ad-hoc methods I use to work with arrays.
🟩 HOW TO USE
Pine Script libraries contain reusable code for importing into indicators. You do not need to copy any code out of here. Just import the library and call the method you want.
For example, for version 1 of this library, import it like this:
import SimpleCryptoLife/ArraysAssorted/1
See the EXAMPLE USAGE sections within the library for examples of calling the methods.
You do not need permission to use Pine libraries in your open-source scripts.
However, you do need explicit permission to reuse code from a Pine Script library’s functions in a public protected or invite-only publication .
In any case, credit the author in your description. It is also good form to credit in open-source comments.
For more information on libraries and incorporating them into your scripts, see the Libraries section of the Pine Script User Manual.
🟩 METHOD 1: m_getHighestLowestFloat()
Finds the highest or lowest float value from an array. Simple enough. It also returns the index of the value as an offset from the end of the array.
• It works with rolling lookback windows, so you can find extremes within the last N elements
• It includes an offset parameter to skip recent elements if needed
• It handles edge cases like empty arrays and invalid ranges gracefully
• It can find either the first or last occurrence of the extreme value
We also export two enums whose sole purpose is to look pretty as method arguments.
method m_getHighestLowestFloat(_self, _highestLowest, _lookbackBars, _offset, _firstLastType)
Namespace types: array
This method finds the highest or lowest value in a float array within a rolling lookback window, and returns the value along with the offset (number of elements back from the end of the array) of its first or last occurrence.
Parameters:
_self (array) : The array of float values to search for extremes.
_highestLowest (HighestLowest) : Whether to search for the highest or lowest value. Use the enum value HighestLowest.highest or HighestLowest.lowest.
_lookbackBars (int) : The number of array elements to include in the rolling lookback window. Must be positive. Note: Array elements only correspond to bars if the consuming script always adds exactly one element on consecutive bars.
_offset (int) : The number of array elements back from the end of the array to start the lookback window. A value of zero means no offset. The _offset parameter offsets both the beginning and end of the range.
_firstLastType (FirstLast) : Whether to return the offset of the first (lowest index) or last (highest index) occurrence of the extreme value. Use FirstLast.first or FirstLast.last.
Returns: (tuple) A tuple containing the highest or lowest value and its offset -- the number of elements back from the end of the array. If not found, returns . NOTE: The _offsetFromEndOfArray value is not affected by the _offset parameter. In other words, it is not the offset from the end of the range but from the end of the array. This number may or may not have any relation to the number of *bars* back, depending on how the array is populated. The calling code needs to figure that out.
EXPORTED ENUMS
HighestLowest
Whether to return the highest value or lowest value in the range.
• highest : Find the highest value in the specified range
• lowest : Find the lowest value in the specified range
FirstLast
Whether to return the first (lowest index) or last (highest index) occurrence of the extreme value.
• first : Return the offset of the first occurrence of the extreme value
• last : Return the offset of the last occurrence of the extreme value
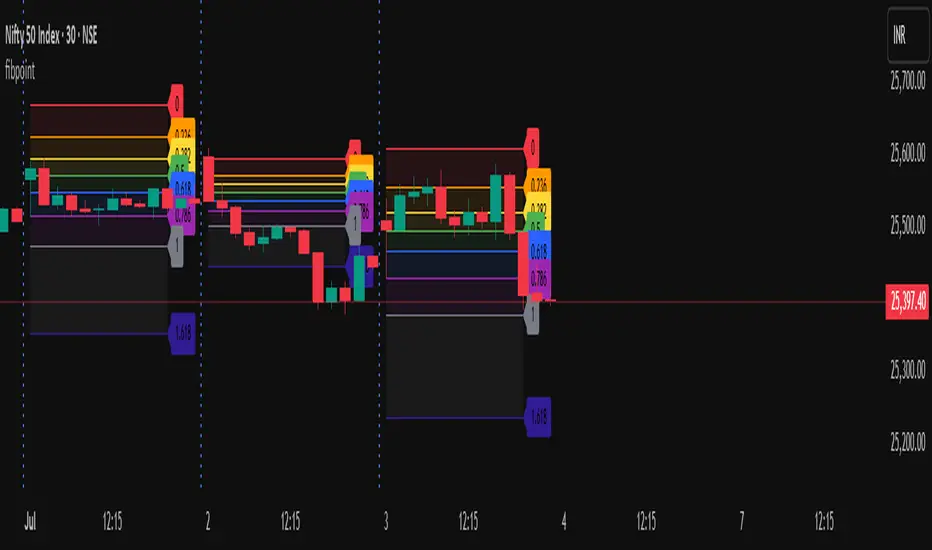
fibpointLibrary "fibpoint"
A library for generating Fibonacci retracement levels on a chart, including customizable lines, labels, and filled areas between levels. It provides functionality to plot Fibonacci levels based on given price points and bar indices, with options for custom levels and colors.
getFib(startPoint, endPoint, startIdx, endIdx, fibLevels, fibColors, tsp)
Calculates Fibonacci retracement levels between two price points and draws corresponding lines and labels on the chart.
Parameters:
startPoint (float) : The starting price point for the Fibonacci retracement.
endPoint (float) : The ending price point for the Fibonacci retracement.
startIdx (int) : The bar index where the Fibonacci retracement starts.
endIdx (int) : The bar index where the Fibonacci retracement ends.
fibLevels (array) : An optional array of custom Fibonacci levels (default is ).
fibColors (array) : An optional array of colors for each Fibonacci level (default is a predefined color array).
tsp (int) : The transparency level for the fill between Fibonacci levels (default is 90).
Returns: A tuple containing an array of fibItem objects (each with a line and label) and an array of linefill objects for the filled areas between levels.
fibItem
A custom type representing a Fibonacci level with its associated line and label.
Fields:
line (series line) : The line object drawn for the Fibonacci level.
label (series label) : The label object displaying the Fibonacci level value.
BybitPerpsArrayLibrary "BybitPerpsArray"
f_getSymbolsForGroup(groupName)
Parameters:
groupName (string)
Contains all of the BYBIT Perp charts- use function to call them in groups

lib_core_utilsLibrary "lib_core_utils"
Core utility functions for Pine Script strategies
Provides safe mathematical operations, array management, and basic helpers
Version: 1.0.0
Author: NQ Hybrid Strategy Team
Last Updated: 2025-06-18
===================================================================
safe_division(numerator, denominator)
safe_division
@description Performs division with safety checks for zero denominators and invalid values
Parameters:
numerator (float) : (float) The numerator value
denominator (float) : (float) The denominator value
Returns: (float) Result of division, or 0.0 if invalid
safe_division_detailed(numerator, denominator)
safe_division_detailed
@description Enhanced division with detailed result information
Parameters:
numerator (float) : (float) The numerator value
denominator (float) : (float) The denominator value
Returns: (SafeCalculationResult) Detailed calculation result
safe_multiply(a, b)
safe_multiply
@description Performs multiplication with safety checks for overflow and invalid values
Parameters:
a (float) : (float) First multiplier
b (float) : (float) Second multiplier
Returns: (float) Result of multiplication, or 0.0 if invalid
safe_add(a, b)
safe_add
@description Performs addition with safety checks
Parameters:
a (float) : (float) First addend
b (float) : (float) Second addend
Returns: (float) Result of addition, or 0.0 if invalid
safe_subtract(a, b)
safe_subtract
@description Performs subtraction with safety checks
Parameters:
a (float) : (float) Minuend
b (float) : (float) Subtrahend
Returns: (float) Result of subtraction, or 0.0 if invalid
safe_abs(value)
safe_abs
@description Safe absolute value calculation
Parameters:
value (float) : (float) Input value
Returns: (float) Absolute value, or 0.0 if invalid
safe_max(a, b)
safe_max
@description Safe maximum value calculation
Parameters:
a (float) : (float) First value
b (float) : (float) Second value
Returns: (float) Maximum value, handling NA cases
safe_min(a, b)
safe_min
@description Safe minimum value calculation
Parameters:
a (float) : (float) First value
b (float) : (float) Second value
Returns: (float) Minimum value, handling NA cases
safe_array_get(arr, index)
safe_array_get
@description Safely retrieves value from array with bounds checking
Parameters:
arr (array) : (array) The array to access
index (int) : (int) Index to retrieve
Returns: (float) Value at index, or na if invalid
safe_array_push(arr, value, max_size)
safe_array_push
@description Safely pushes value to array with size management
Parameters:
arr (array) : (array) The array to modify
value (float) : (float) Value to push
max_size (int) : (int) Maximum array size
Returns: (bool) True if push was successful
safe_array_unshift(arr, value, max_size)
safe_array_unshift
@description Safely adds value to beginning of array with size management
Parameters:
arr (array) : (array) The array to modify
value (float) : (float) Value to add at beginning
max_size (int) : (int) Maximum array size
Returns: (bool) True if unshift was successful
get_array_stats(arr, max_size)
get_array_stats
@description Gets statistics about an array
Parameters:
arr (array) : (array) The array to analyze
max_size (int) : (int) The maximum allowed size
Returns: (ArrayStats) Statistics about the array
cleanup_array(arr, target_size)
cleanup_array
@description Cleans up array by removing old elements if it's too large
Parameters:
arr (array) : (array) The array to cleanup
target_size (int) : (int) Target size after cleanup
Returns: (int) Number of elements removed
is_valid_price(price)
is_valid_price
@description Checks if a price value is valid for trading calculations
Parameters:
price (float) : (float) Price to validate
Returns: (bool) True if price is valid
is_valid_volume(vol)
is_valid_volume
@description Checks if a volume value is valid
Parameters:
vol (float) : (float) Volume to validate
Returns: (bool) True if volume is valid
sanitize_price(price, default_value)
sanitize_price
@description Sanitizes price value to ensure it's within valid range
Parameters:
price (float) : (float) Price to sanitize
default_value (float) : (float) Default value if price is invalid
Returns: (float) Sanitized price value
sanitize_percentage(pct)
sanitize_percentage
@description Sanitizes percentage value to 0-100 range
Parameters:
pct (float) : (float) Percentage to sanitize
Returns: (float) Sanitized percentage (0-100)
is_session_active(session_string, timezone)
Parameters:
session_string (string)
timezone (string)
get_session_progress(session_string, timezone)
Parameters:
session_string (string)
timezone (string)
format_price(price, decimals)
Parameters:
price (float)
decimals (int)
format_percentage(pct, decimals)
Parameters:
pct (float)
decimals (int)
bool_to_emoji(condition, true_emoji, false_emoji)
Parameters:
condition (bool)
true_emoji (string)
false_emoji (string)
log_debug(message, level)
Parameters:
message (string)
level (string)
benchmark_start()
benchmark_end(start_time)
Parameters:
start_time (int)
get_library_info()
get_library_version()
SafeCalculationResult
SafeCalculationResult
Fields:
value (series float) : (float) The calculated value
is_valid (series bool) : (bool) Whether the calculation was successful
error_message (series string) : (string) Error description if calculation failed
ArrayStats
ArrayStats
Fields:
size (series int) : (int) Current array size
max_size (series int) : (int) Maximum allowed size
is_full (series bool) : (bool) Whether array has reached max capacity

AllCandlestickPatternsLibraryAll Candlestick Patterns Library
The Candlestick Patterns Library is a Pine Script (version 6) library extracted from the All Candlestick Patterns indicator. It provides a comprehensive set of functions to calculate candlestick properties, detect market trends, and identify various candlestick patterns (bullish, bearish, and neutral). The library is designed for reusability, enabling TradingView users to incorporate pattern detection into their own scripts, such as indicators or strategies.
The library is organized into three main sections:
Trend Detection: Functions to determine market trends (uptrend or downtrend) based on user-defined rules.
Candlestick Property Calculations: A function to compute core properties of a candlestick, such as body size, shadow lengths, and doji characteristics.
Candlestick Pattern Detection: Functions to detect specific candlestick patterns, each returning a tuple with detection status, pattern name, type, and description.
Library Structure
1. Trend Detection
This section includes the detectTrend function, which identifies whether the market is in an uptrend or downtrend based on user-specified rules, such as the relationship between the closing price and Simple Moving Averages (SMAs).
Function: detectTrend
Parameters:
downTrend (bool): Initial downtrend condition.
upTrend (bool): Initial uptrend condition.
trendRule (string): The rule for trend detection ("SMA50" or "SMA50, SMA200").
p_close (float): Current closing price.
sma50 (float): Simple Moving Average over 50 periods.
sma200 (float): Simple Moving Average over 200 periods.
Returns: A tuple indicating the detected trend.
Logic:
If trendRule is "SMA50", a downtrend is detected when p_close < sma50, and an uptrend when p_close > sma50.
If trendRule is "SMA50, SMA200", a downtrend is detected when p_close < sma50 and sma50 < sma200, and an uptrend when p_close > sma50 and sma50 > sma200.
2. Candlestick Property Calculations
This section includes the calculateCandleProperties function, which computes essential properties of a candlestick based on OHLC (Open, High, Low, Close) data and configuration parameters.
Function: calculateCandleProperties
Parameters:
p_open (float): Candlestick open price.
p_close (float): Candlestick close price.
p_high (float): Candlestick high price.
p_low (float): Candlestick low price.
bodyAvg (float): Average body size (e.g., from EMA of body sizes).
shadowPercent (float): Minimum shadow size as a percentage of body size.
shadowEqualsPercent (float): Tolerance for equal shadows in doji detection.
dojiBodyPercent (float): Maximum body size as a percentage of range for doji detection.
Returns: A tuple containing 17 properties:
C_BodyHi (float): Higher of open or close price.
C_BodyLo (float): Lower of open or close price.
C_Body (float): Body size (difference between C_BodyHi and C_BodyLo).
C_SmallBody (bool): True if body size is below bodyAvg.
C_LongBody (bool): True if body size is above bodyAvg.
C_UpShadow (float): Upper shadow length (p_high - C_BodyHi).
C_DnShadow (float): Lower shadow length (C_BodyLo - p_low).
C_HasUpShadow (bool): True if upper shadow exceeds shadowPercent of body.
C_HasDnShadow (bool): True if lower shadow exceeds shadowPercent of body.
C_WhiteBody (bool): True if candle is bullish (p_open < p_close).
C_BlackBody (bool): True if candle is bearish (p_open > p_close).
C_Range (float): Candlestick range (p_high - p_low).
C_IsInsideBar (bool): True if current candle body is inside the previous candle's body.
C_BodyMiddle (float): Midpoint of the candle body.
C_ShadowEquals (bool): True if upper and lower shadows are equal within shadowEqualsPercent.
C_IsDojiBody (bool): True if body size is small relative to range (C_Body <= C_Range * dojiBodyPercent / 100).
C_Doji (bool): True if the candle is a doji (C_IsDojiBody and C_ShadowEquals).
Purpose: These properties are used by pattern detection functions to evaluate candlestick formations.
3. Candlestick Pattern Detection
This section contains functions to detect specific candlestick patterns, each returning a tuple . The patterns are categorized as bullish, bearish, or neutral, and include detailed descriptions for use in tooltips or alerts.
Supported Patterns
The library supports the following candlestick patterns, grouped by type:
Bullish Patterns:
Rising Window: A two-candle continuation pattern in an uptrend with a price gap between the first candle's high and the second candle's low.
Rising Three Methods: A five-candle continuation pattern with a long green candle, three short red candles, and another long green candle.
Tweezer Bottom: A two-candle reversal pattern in a downtrend with nearly identical lows.
Upside Tasuki Gap: A three-candle continuation pattern in an uptrend with a gap between the first two green candles and a red candle closing partially into the gap.
Doji Star (Bullish): A two-candle reversal pattern in a downtrend with a long red candle followed by a doji gapping down.
Morning Doji Star: A three-candle reversal pattern with a long red candle, a doji gapping down, and a long green candle.
Piercing: A two-candle reversal pattern in a downtrend with a red candle followed by a green candle closing above the midpoint of the first.
Hammer: A single-candle reversal pattern in a downtrend with a small body and a long lower shadow.
Inverted Hammer: A single-candle reversal pattern in a downtrend with a small body and a long upper shadow.
Morning Star: A three-candle reversal pattern with a long red candle, a short candle gapping down, and a long green candle.
Marubozu White: A single-candle pattern with a long green body and minimal shadows.
Dragonfly Doji: A single-candle reversal pattern in a downtrend with a doji where open and close are at the high.
Harami Cross (Bullish): A two-candle reversal pattern in a downtrend with a long red candle followed by a doji inside its body.
Harami (Bullish): A two-candle reversal pattern in a downtrend with a long red candle followed by a small green candle inside its body.
Long Lower Shadow: A single-candle pattern with a long lower shadow indicating buyer strength.
Three White Soldiers: A three-candle reversal pattern with three long green candles in a downtrend.
Engulfing (Bullish): A two-candle reversal pattern in a downtrend with a small red candle followed by a larger green candle engulfing it.
Abandoned Baby (Bullish): A three-candle reversal pattern with a long red candle, a doji gapping down, and a green candle gapping up.
Tri-Star (Bullish): A three-candle reversal pattern with three doji candles in a downtrend, with gaps between them.
Kicking (Bullish): A two-candle reversal pattern with a bearish marubozu followed by a bullish marubozu gapping up.
Bearish Patterns:
On Neck: A two-candle continuation pattern in a downtrend with a long red candle followed by a short green candle closing near the first candle's low.
Falling Window: A two-candle continuation pattern in a downtrend with a price gap between the first candle's low and the second candle's high.
Falling Three Methods: A five-candle continuation pattern with a long red candle, three short green candles, and another long red candle.
Tweezer Top: A two-candle reversal pattern in an uptrend with nearly identical highs.
Dark Cloud Cover: A two-candle reversal pattern in an uptrend with a green candle followed by a red candle opening above the high and closing below the midpoint.
Downside Tasuki Gap: A three-candle continuation pattern in a downtrend with a gap between the first two red candles and a green candle closing partially into the gap.
Evening Doji Star: A three-candle reversal pattern with a long green candle, a doji gapping up, and a long red candle.
Doji Star (Bearish): A two-candle reversal pattern in an uptrend with a long green candle followed by a doji gapping up.
Hanging Man: A single-candle reversal pattern in an uptrend with a small body and a long lower shadow.
Shooting Star: A single-candle reversal pattern in an uptrend with a small body and a long upper shadow.
Evening Star: A three-candle reversal pattern with a long green candle, a short candle gapping up, and a long red candle.
Marubozu Black: A single-candle pattern with a long red body and minimal shadows.
Gravestone Doji: A single-candle reversal pattern in an uptrend with a doji where open and close are at the low.
Harami Cross (Bearish): A two-candle reversal pattern in an uptrend with a long green candle followed by a doji inside its body.
Harami (Bearish): A two-candle reversal pattern in an uptrend with a long green candle followed by a small red candle inside its body.
Long Upper Shadow: A single-candle pattern with a long upper shadow indicating seller strength.
Three Black Crows: A three-candle reversal pattern with three long red candles in an uptrend.
Engulfing (Bearish): A two-candle reversal pattern in an uptrend with a small green candle followed by a larger red candle engulfing it.
Abandoned Baby (Bearish): A three-candle reversal pattern with a long green candle, a doji gapping up, and a red candle gapping down.
Tri-Star (Bearish): A three-candle reversal pattern with three doji candles in an uptrend, with gaps between them.
Kicking (Bearish): A two-candle reversal pattern with a bullish marubozu followed by a bearish marubozu gapping down.
Neutral Patterns:
Doji: A single-candle pattern with a very small body, indicating indecision.
Spinning Top White: A single-candle pattern with a small green body and long upper and lower shadows, indicating indecision.
Spinning Top Black: A single-candle pattern with a small red body and long upper and lower shadows, indicating indecision.
Pattern Detection Functions
Each pattern detection function evaluates specific conditions based on candlestick properties (from calculateCandleProperties) and trend conditions (from detectTrend). The functions return:
detected (bool): True if the pattern is detected.
name (string): The name of the pattern (e.g., "On Neck").
type (string): The pattern type ("Bullish", "Bearish", or "Neutral").
description (string): A detailed description of the pattern for use in tooltips or alerts.
For example, the detectOnNeckBearish function checks for a bearish On Neck pattern by verifying a downtrend, a long red candle followed by a short green candle, and specific price relationships.
Usage Example
To use the library in a TradingView indicator, you can import it and call its functions as shown below:
//@version=6
indicator("Candlestick Pattern Detector", overlay=true)
import CandlestickPatternsLibrary as cp
// Calculate SMA for trend detection
sma50 = ta.sma(close, 50)
sma200 = ta.sma(close, 200)
= cp.detectTrend(true, true, "SMA50", close, sma50, sma200)
// Calculate candlestick properties
bodyAvg = ta.ema(math.max(close, open) - math.min(close, open), 14)
= cp.calculateCandleProperties(open, close, high, low, bodyAvg, 5.0, 100.0, 5.0)
// Detect a pattern (e.g., On Neck Bearish)
= cp.detectOnNeckBearish(downTrend, blackBody, longBody, whiteBody, open, close, low, bodyAvg, smallBody, candleRange)
if onNeckDetected
label.new(bar_index, low, onNeckName, style=label.style_label_up, color=color.red, textcolor=color.white, tooltip=onNeckDesc)
// Detect another pattern (e.g., Piercing Bullish)
= cp.detectPiercingBullish(downTrend, blackBody, longBody, whiteBody, open, low, close, bodyMiddle)
if piercingDetected
label.new(bar_index, low, piercingName, style=label.style_label_up, color=color.blue, textcolor=color.white, tooltip=piercingDesc)
Steps in the Example
Import the Library: Use import CandlestickPatternsLibrary as cp to access the library's functions.
Calculate Trend: Use detectTrend to determine the market trend based on SMA50 or SMA50/SMA200 rules.
Calculate Candlestick Properties: Use calculateCandleProperties to compute properties like body size, shadow lengths, and doji status.
Detect Patterns: Call specific pattern detection functions (e.g., detectOnNeckBearish, detectPiercingBullish) and use the returned values to display labels or alerts.
Visualize Patterns: Use label.new to display detected patterns on the chart with their names, types, and descriptions.
Key Features
Modularity: The library is designed as a standalone module, making it easy to integrate into other Pine Script projects.
Comprehensive Pattern Coverage: Supports over 40 candlestick patterns, covering bullish, bearish, and neutral formations.
Detailed Documentation: Each function includes comments with @param and @returns annotations for clarity.
Reusability: Can be used in indicators, strategies, or alerts by importing the library and calling its functions.
Extracted from All Candlestick Patterns: The library is derived from the All Candlestick Patterns indicator, ensuring it inherits a well-tested foundation for pattern detection.
Notes for Developers
Pine Script Version: The library uses Pine Script version 6, as specified by //@version=6.
Parameter Naming: Parameters use prefixes like p_ (e.g., p_open, p_close) to avoid conflicts with built-in variables.
Error Handling: The library has been fixed to address issues like undeclared identifiers (C_SmallBody, C_Range), unused arguments (factor), and improper comment formatting.
Testing: Developers should test the library in TradingView to ensure patterns are detected correctly under various market conditions.
Customization: Users can adjust parameters like bodyAvg, shadowPercent, shadowEqualsPercent, and dojiBodyPercent in calculateCandleProperties to fine-tune pattern detection sensitivity.
Conclusion
The Candlestick Patterns Library, extracted from the All Candlestick Patterns indicator, is a powerful tool for traders and developers looking to implement candlestick pattern detection in TradingView. Its modular design, comprehensive pattern support, and detailed documentation make it an ideal choice for building custom indicators or strategies. By leveraging the library's functions, users can analyze market trends, compute candlestick properties, and detect a wide range of patterns to inform their trading decisions.

HexworksSharedUtilitiesLibrary "HexworksSharedUtilities"
Shared global utilities that can be used for
- creating bounded queues from primitives
- checking visibility of objects having Bounds on both (x, y) axes
- checking if a line is too long
method offer(history, value)
Namespace types: FloatHistory
Parameters:
history (FloatHistory)
value (simple float)
method offer(history, value)
Namespace types: IntHistory
Parameters:
history (IntHistory)
value (simple int)
method offer(history, value)
Namespace types: StringHistory
Parameters:
history (StringHistory)
value (simple string)
method offer(history, value)
Namespace types: BoolHistory
Parameters:
history (BoolHistory)
value (simple bool)
method toString(point)
Namespace types: chart.point
Parameters:
point (chart.point)
method toString(num)
Namespace types: simple float, input float, const float
Parameters:
num (simple float)
method toString(num)
Namespace types: simple int, input int, const int
Parameters:
num (simple int)
method toString(value)
Namespace types: simple bool, input bool, const bool
Parameters:
value (simple bool)
method toString(l)
Namespace types: series line
Parameters:
l (line)
method isLineTooLong(fromPoint, toPoint)
Namespace types: chart.point
Parameters:
fromPoint (chart.point)
toPoint (chart.point)
method isTooLong(l)
Namespace types: series line
Parameters:
l (line)
createVisibilityChecker()
method update(v)
Namespace types: VisibilityChecker
Parameters:
v (VisibilityChecker)
method canDraw(v)
Namespace types: VisibilityChecker
Parameters:
v (VisibilityChecker)
method isVisible(v, b)
Namespace types: VisibilityChecker
Parameters:
v (VisibilityChecker)
b (Bounds)
FloatHistory
Fields:
history (array)
maxLength (series int)
IntHistory
Fields:
history (array)
maxLength (series int)
StringHistory
Fields:
history (array)
maxLength (series int)
BoolHistory
Fields:
history (array)
maxLength (series int)
Bounds
Fields:
startIdx (series int)
endIdx (series int)
highValue (series float)
lowValue (series float)
VisibilityChecker
Fields:
leftVisibleBarIdx (series int)
rightVisibleBarIdx (series int)
maxDrawDistance (series int)
updatedAt (series int)
visibleHighest (series float)
visibleLowest (series float)

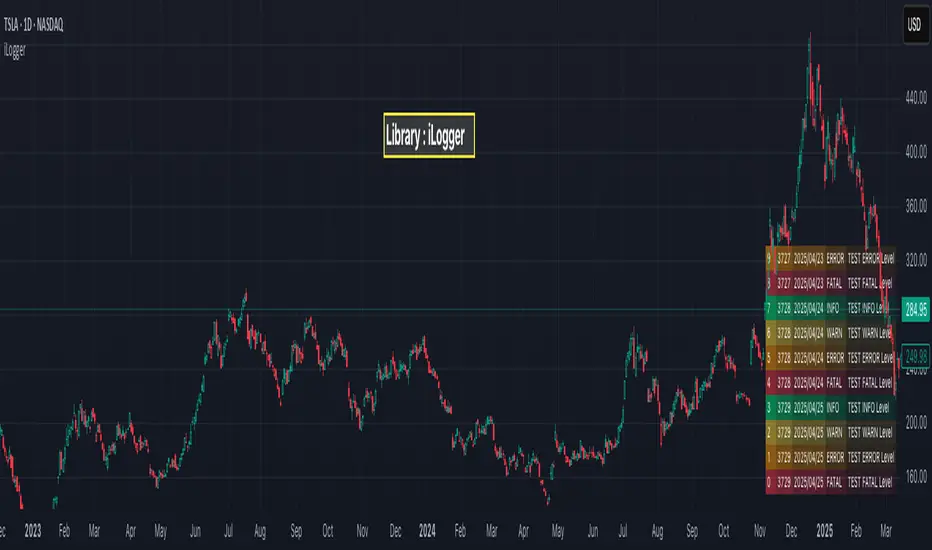
iLoggerLibrary "iLogger"
Logger Library based on types and methods.
method init(this)
init will initialize logger table and log stream array
Namespace types: Logger
Parameters:
this (Logger) : Logger object
Returns: void
method getLogger(level)
Namespace types: series LogLevel
Parameters:
level (series LogLevel)
method setPage(this, pageNumber)
setPage will set current page number of logs to display
Namespace types: Logger
Parameters:
this (Logger) : Logger object
pageNumber (int) : - Page number of logs to display
Returns: void
method nextPage(this)
nextPage will incremement page number to display on screen
Namespace types: Logger
Parameters:
this (Logger) : Logger object
Returns: void
method previousPage(this)
previousPage will decrement page number to display on screen
Namespace types: Logger
Parameters:
this (Logger) : Logger object
Returns: void
method log(this, level, message)
log will record message to be logged and repopulate logs displayed
Namespace types: Logger
Parameters:
this (Logger) : Logger object
level (series LogLevel) : logging level. Can be `TRACE`, `DEBUG`, `INFO`, `WARN`, `ERROR`, `FATAL`, `CRITICAL`. Logs only if log level is higher than Loggers minimul log level set
message (string) : log message to be recorded
Returns: void
method trace(this, message)
trace will record message to be logged with level 'TRACE'
Namespace types: Logger
Parameters:
this (Logger) : Logger object
message (string) : log message to be recorded
Returns: void
method debug(this, message)
debug will record message to be logged with level 'DEBUG'
Namespace types: Logger
Parameters:
this (Logger) : Logger object
message (string) : log message to be recorded
Returns: void
method info(this, message)
info will record message to be logged with level 'INFO'
Namespace types: Logger
Parameters:
this (Logger) : Logger object
message (string) : log message to be recorded
Returns: void
method warn(this, message)
warn will record message to be logged with level 'WARN'
Namespace types: Logger
Parameters:
this (Logger) : Logger object
message (string) : log message to be recorded
Returns: void
method error(this, message)
error will record message to be logged with level 'ERROR'
Namespace types: Logger
Parameters:
this (Logger) : Logger object
message (string) : log message to be recorded
Returns: void
method fatal(this, message)
fatal will record message to be logged with level 'FATAL'
Namespace types: Logger
Parameters:
this (Logger) : Logger object
message (string) : log message to be recorded
Returns: void
Log
Log Object holding log entry
Fields:
level (series LogLevel) : Logging level
message (series string) : Logging message
bartime (series int) : bar time at which log is recorded
bar (series int) : bar index at which log is recorded
Logger
Logger object which can be used for logging purposes
Fields:
position (series string) : position on chart where logs can be shown. Valid values are table position values. Make sure that the script does not have any other table at this position
pageSize (series int) : size of each page of logs which can be shown on UI. Default is 10
maxEntries (series int) : max size logs to be stored
pageNumber (series int) : current page number of logs to display on chart
textSize (series string) : size of text on debug table to be shown. default is size.small. Other options - size.tiny, size.normal, size.large, size.huge, size.auto
textColor (series color) : text color of debug messages. Default is color.white
showOnlyLast (series bool) : If set, shows the logs derived only from last bar. Default is true
minimumLevel (series LogLevel) : Minimum level of logs to be considered for logging.
realTime (series bool) : Print logs based on real time bar. This should be set to true for debugging indicators and false for debugging strategies.
debugTable (series table) : table containing debug messages. It will be set in init method. Hence no need to pass this in constructor
logs (array) : Array of Log containing logging messages. It will be set in init method. Hence no need to pass this in constructor
reversalchartpatternsLibrary "reversalchartpatterns"
User Defined Types and Methods for reversal chart patterns - Double Top, Double Bottom, Triple Top, Triple Bottom, Cup and Handle, Inverted Cup and Handle, Head and Shoulders, Inverse Head and Shoulders
method delete(this)
Deletes the drawing components of ReversalChartPatternDrawing object
Namespace types: ReversalChartPatternDrawing
Parameters:
this (ReversalChartPatternDrawing) : ReversalChartPatternDrawing object
Returns: current ReversalChartPatternDrawing object
method delete(this)
Deletes the drawing components of ReversalChartPattern object. In turn calls the delete of ReversalChartPatternDrawing
Namespace types: ReversalChartPattern
Parameters:
this (ReversalChartPattern) : ReversalChartPattern object
Returns: current ReversalChartPattern object
method lpush(this, obj, limit, deleteOld)
Array push with limited number of items in the array. Old items are deleted when new one comes and exceeds the limit
Namespace types: array
Parameters:
this (array) : array object
obj (ReversalChartPattern) : ReversalChartPattern object which need to be pushed to the array
limit (int) : max items on the array. Default is 10
deleteOld (bool) : If set to true, also deletes the drawing objects. If not, the drawing objects are kept but the pattern object is removed from array. Default is false.
Returns: current ReversalChartPattern object
method draw(this)
Draws the components of ReversalChartPatternDrawing
Namespace types: ReversalChartPatternDrawing
Parameters:
this (ReversalChartPatternDrawing) : ReversalChartPatternDrawing object
Returns: current ReversalChartPatternDrawing object
method draw(this)
Draws the components of ReversalChartPatternDrawing within the ReversalChartPattern object.
Namespace types: ReversalChartPattern
Parameters:
this (ReversalChartPattern) : ReversalChartPattern object
Returns: current ReversalChartPattern object
method scan(zigzag, patterns, errorPercent, shoulderStart, shoulderEnd, allowedPatterns, offset)
Scans zigzag for ReversalChartPattern occurences
Namespace types: zg.Zigzag
Parameters:
zigzag (Zigzag type from Trendoscope/Zigzag/11) : ZigzagTypes.Zigzag object having array of zigzag pivots and other information on each pivots
patterns (array) : Existing patterns array. Used for validating duplicates
errorPercent (float) : Error threshold for considering ratios. Default is 13
shoulderStart (float) : Starting range of shoulder ratio. Used for identifying shoulders, handles and necklines
shoulderEnd (float) : Ending range of shoulder ratio. Used for identifying shoulders, handles and necklines
allowedPatterns (array) : array of int containing allowed pattern types
offset (int) : Offset of zigzag to consider only confirmed pivots
Returns: int pattern type
method createPattern(zigzag, patternType, patternColor, properties, offset)
Create Pattern from ZigzagTypes.Zigzag object
Namespace types: zg.Zigzag
Parameters:
zigzag (Zigzag type from Trendoscope/Zigzag/11) : ZigzagTypes.Zigzag object having array of zigzag pivots and other information on each pivots
patternType (int) : Type of pattern being created. 1 - Double Tap, 2 - Triple Tap, 3 - Cup and Handle, 4 - Head and Shoulders
patternColor (color) : Color in which the patterns are drawn
properties (ReversalChartTradeProperties)
offset (int)
Returns: ReversalChartPattern object created
method getName(this)
get pattern name of ReversalChartPattern object
Namespace types: ReversalChartPattern
Parameters:
this (ReversalChartPattern) : ReversalChartPattern object
Returns: string name of the pattern
method getDescription(this)
get consolidated description of ReversalChartPattern object
Namespace types: ReversalChartPattern
Parameters:
this (ReversalChartPattern) : ReversalChartPattern object
Returns: string consolidated description
method init(this)
initializes the ReversalChartPattern object and creates sub object types
Namespace types: ReversalChartPattern
Parameters:
this (ReversalChartPattern) : ReversalChartPattern object
Returns: ReversalChartPattern current object
ReversalChartPatternDrawing
Type which holds the drawing objects for Reversal Chart Pattern Types
Fields:
patternLines (array type from Trendoscope/Drawing/2) : array of Line objects representing pattern
entry (Line type from Trendoscope/Drawing/2) : Entry price Line
targets (array type from Trendoscope/Drawing/2)
stop (Line type from Trendoscope/Drawing/2) : Stop price Line
patternLabel (Label type from Trendoscope/Drawing/2)
ReversalChartTradeProperties
Trade properties of ReversalChartPattern
Fields:
riskAdjustment (series float) : Risk Adjustment for calculation of stop
useFixedTarget (series bool) : Boolean flag saying use fixed target type wherever possible. If fixed target type is not possible, then risk reward/fib ratios are used for calculation of targets
variableTargetType (series int) : Integer value which defines whether to use fib based targets or risk reward based targets. 1 - Risk Reward, 2 - Fib Ratios
variableTargetRatios (array) : Risk reward or Fib Ratios to be used for calculation of targets when fixed target is not possible or not enabled
entryPivotForWm (series int) : which Pivot should be considered as entry point for WM patterns. 0 refers to the latest breakout pivot where as 5 refers to initial pivot of the pattern
ReversalChartPattern
Reversal Chart Pattern master type which holds the pattern components, drawings and trade details
Fields:
pivots (array type from Trendoscope/Zigzag/11) : Array of Zigzag Pivots forming the pattern
patternType (series int) : Defines the main type of pattern 1 - Double Tap, 1 - Triple Tap, 3 - Cup and Handle, 4 - Head and Shoulders, 5- W/M Patterns, 6 - Full Trend, 7 - Half Trend
patternColor (series color) : Color in which the pattern will be drawn on chart
properties (ReversalChartTradeProperties)
drawing (ReversalChartPatternDrawing) : ReversalChartPatternDrawing object which holds the drawing components
trade (Trade type from Trendoscope/TradeTracker/1) : TradeTracker.Trade object holding trade components

PineVersatilitiesBundleLibrary "PineVersatilitiesBundle"
Versatilities (aka, Versatile Utilities) Pack includes:
- Eighteen Price Variants bundled in a Map,
- Nine Smoothing Variants bundled in a Map,
- Visualisations that indicate on both - pane and chart.
price_variants(lb)
Computes Several different averages using current and previous OHLC values
Parameters:
lb (int) : - lookback distance for combining OHLC values from the past with the present
Returns: Map of Eighteen Uncommon Combinations of single and two-bar OHLC averages (rounded-to-mintick)
dynamic_MA(masrc, malen, lsmaoff, almasgm, almaoff, almaflr)
Dynamically computes Eight different MAs and returns a Map containing Nine MAs
Parameters:
masrc (float) : source series to compute MA
malen (simple int) : lookback distance for MA
lsmaoff (simple int) : optional LSMA offset - default is 0
almasgm (simple float) : optional ALMA sigma - default is 5
almaoff (simple float) : optional ALMA offset - default is 0.5
almaflr (simple bool) : optional ALMA floor flag - default is false
Returns: Map of MAs - 'ALMA', 'EMA', 'HMA', 'LSMA', 'RMA', 'SMA', 'SWMA', 'WMA', 'ALL' (rounded-to-mintick)

DoppelLibLibrary "DoppelLib"
getDailyClose(offset)
Returns the daily close for a specific offset.
For each offset value (from 1 to 21), the function uses a static request.security() call
to retrieve the daily close from the previous day at the specified offset.
Parameters:
offset (int) : (int) The offset value (from 1 to 21) representing the desired close value.
Returns: (float) The daily close for the specified offset or na if offset is out of range.
isVolumeAboveThreshold(vol, mediaPeriod, thresholdPercent)
Checks if the current volume is above the threshold based on its moving average.
The threshold is calculated as the average volume plus a percentage increment.
Parameters:
vol (float) : (series float) The volume series (e.g. the chart volume).
mediaPeriod (int) : (int) The period for calculating the moving average.
thresholdPercent (float) : (float) The percentage to add to the average for the threshold.
Returns: (bool) True if the volume exceeds the threshold, false otherwise.
calcPvsra(pvsraVolume, pvsraHigh, pvsraLow, pvsraClose, pvsraOpen, redVectorColor, greenVectorColor, violetVectorColor, blueVectorColor, darkGreyCandleColor, lightGrayCandleColor)
Calculates the PVSRA candle color, determines if a vector candle has appeared,
and returns additional support parameters (average volume, volume spread, highest volume spread).
- "High" (Climax): volume >= 200% of the average OR (volume * candle spread) >= highest spread over the previous 10 bars.
-> Bull candle: green; Bear candle: red.
- "Medium": volume >= 150% of the average.
-> Bull candle: blue; Bear candle: violet.
- Otherwise, default (non-vector) candle colors are used.
Parameters:
pvsraVolume (float) : (series float) Volume series.
pvsraHigh (float) : (series float) High price series.
pvsraLow (float) : (series float) Low price series.
pvsraClose (float) : (series float) Close price series.
pvsraOpen (float) : (series float) Open price series.
redVectorColor (simple color) : (simple color) Color for bearish candle in high scenario.
greenVectorColor (simple color) : (simple color) Color for bullish candle in high scenario.
violetVectorColor (simple color) : (simple color) Color for bearish candle in medium scenario.
blueVectorColor (simple color) : (simple color) Color for bullish candle in medium scenario.
darkGreyCandleColor (simple color) : (simple color) Color for bearish candle in non-vector situation.
lightGrayCandleColor (simple color) : (simple color) Color for bullish candle in non-vector situation.
Returns: (tuple) A tuple containing: .

NR_VersatilitiesLibrary "NR_Versatilities"
Versatilities (aka, Versatile Utilities) includes:
- Seventeen Price Variants returned as a tuple,
- Eight Smoothing functions rolled into one,
- Pick any Past Value from any series with offset,
- Or just the previous value from any series.
pastVal(src, len)
Fetches past value from src that came len distance ago
Parameters:
src (float) : source series
len (int) : lookback distance - (optional) default is 1
Returns: latest src if len <= 0, else src
previous(src)
Fetches past value from src that came len distance ago
Parameters:
src (float) : source series
Returns: previous value in the series if found, else current value
price_variants()
Computes Several different averages using current and previous OHLC values
Returns: Seventeen Uncommon Average Price Combinations
dynamic_MA(matyp, masrc, malen, lsmaoff, almasgm, almaoff, almaflr)
Dynamically computes Eight different MAs on-demand individually, or an average of all taken together
Parameters:
matyp (string) : pick one of these MAs - ALMA, EMA, HMA, LSMA, RMA, SMA, SWMA, WMA, ALL
masrc (float) : source series to compute MA
malen (simple int) : lookback distance for MA
lsmaoff (simple int) : optional LSMA offset - default is 0
almasgm (simple float) : optional ALMA sigma - default is 5
almaoff (simple float) : optional ALMA offset - default is 0.5
almaflr (simple bool) : optional ALMA floor flag - default is false
Returns: MA series for chosen type or, an average of all of them, if chosen so

projectiontrackingLibrary "projectiontracking"
Library contains few data structures and methods for tracking harmonic patterns and projections via pinescript.
method erase(this)
erase Harmonic Projection Drawing
Namespace types: HarmonicProjectionDrawing
Parameters:
this (HarmonicProjectionDrawing) : HarmonicProjectionDrawing object
Returns: void
method erase(this)
erase HarmonicProjection
Namespace types: HarmonicProjection
Parameters:
this (HarmonicProjection) : HarmonicProjection object
Returns: void
method draw(this)
draw HarmonicProjection
Namespace types: HarmonicProjection
Parameters:
this (HarmonicProjection) : HarmonicProjection object
Returns: HarmonicProjection object
method getRanges(projectionPrzRanges, dir)
Convert PRZRange to Projection ranges
Namespace types: array
Parameters:
projectionPrzRanges (array type from Trendoscope/HarmonicMapLib/1) : array of PrzRange objects
dir (int) : Projection direction
Returns: array
ProjectionRange
Harmonic Projection Range
Fields:
patterns (array) : array of pattern names
start (series float) : Start Range
end (series float) : End Range
status (series int) : Projection Status
ProjectionProperties
Harmonic Projection Properties
Fields:
fillMajorTriangles (series bool) : Use linefill for major triangles
fillMinorTriangles (series bool) : Use linefill for minor triangles
majorFillTransparency (series int) : transparency of major triangles
minorFillTransparency (series int) : transparency of minor triangles
showXABC (series bool) : Show XABC labels
lblSizePivots (series string) : Pivot labels size
showRatios (series bool) : Show ratio labels
useLogScaleForScan (series bool) : Log scale is used for scanning projections
activateOnB (series bool) : Activate projections on reaching B
activationRatio (series float) : Use activation ratio for activation
confirmationRatio (series float) : Confirmation ratio of projection before removal
HarmonicProjectionDrawing
Harmonic Projection Projection drawing objects
Fields:
xa (series line) : line xa
ab (series line) : line ab
bc (series line) : line bc
xb (series line) : line xb
ac (series line) : line ac
x (series label) : Pivot label x
a (series label) : Pivot label a
b (series label) : Pivot label b
c (series label) : Pivot label c
xabRatio (series label) : Label XAB Ratio
abcRatio (series label) : Label ABC Ratio
HarmonicProjection
Harmonic Projection Projection object
Fields:
patternId (series int) : id of the pattern
dir (series int) : projection direction
x (chart.point) : Pivot X
a (chart.point) : Pivot A
b (chart.point) : Pivot B
c (chart.point) : Pivot C
patternColor (series color) : Color in which pattern is displayed
przRange (PrzRange type from Trendoscope/HarmonicMapLib/1) : PRZ Range
activationPrice (series float) : Projection activation price
reversalPrice (series float) : Projection reversal price
status (series int) : Projection status
properties (ProjectionProperties) : Projection properties
projectionRanges (array) : array of Projection Ranges
initialD (series float) : Initial D pivot
d (chart.point) : Pivot D
drawing (HarmonicProjectionDrawing) : HarmonicProjectionDrawing Object

HarmonicMapLibLibrary "HarmonicMapLib"
Harmonic Pattern Library implementation utilising maps
method tostring(this)
convert Range value to string
Namespace types: Range
Parameters:
this (Range) : Range value
Returns: converted string representation
method tostring(this)
convert array of Range value to string
Namespace types: array
Parameters:
this (array) : array object
Returns: converted string representation
method tostring(this)
convert map of string to Range value to string
Namespace types: map
Parameters:
this (map) : map object
Returns: converted string representation
method tostring(this)
convert RatioMap to string
Namespace types: RatioMap
Parameters:
this (RatioMap) : RatioMap object
Returns: converted string representation
method tostring(this)
convert array of RatioMap to string
Namespace types: array
Parameters:
this (array) : array object
Returns: converted string representation
method tostring(this)
convert map of string to RatioMap to string
Namespace types: map
Parameters:
this (map) : map object
Returns: converted string representation
method tostring(this)
convert map of string to bool to string
Namespace types: map
Parameters:
this (map) : map object
Returns: converted string representation
method tostring(this)
convert PrzRange to string
Namespace types: PrzRange
Parameters:
this (PrzRange) : PrzRange object
Returns: converted string representation
method tostring(this)
convert array of PrzRange to string
Namespace types: array
Parameters:
this (array) : array object
Returns: converted string representation
getHarmonicMap()
Creates the RatioMap for harmonic patterns
Returns: map haronic ratio rules for all patterns
method evaluate(patternsMap, pattern, ratioRange, properties, ratioValue)
evaluates harmonic ratio range
Namespace types: map
Parameters:
patternsMap (map) : parameter containing valid pattern names
pattern (string) : Pattern type to be evaluated
ratioRange (Range) : ratio range to be checked
properties (ScanProperties) : Scan Properties
ratioValue (float)
Returns: void
method evaluate(przRange, pattern, ratioRange, priceRange, properties)
Evaluate PRZ ranges
Namespace types: map
Parameters:
przRange (map)
pattern (string) : Pattern name
ratioRange (Range) : Range of ratio for the pattern
priceRange (Range) : Price range based on ratio
properties (ScanProperties) : ScanProperties object
Returns: void
method scanRatio(currentPatterns, rules, properties, ratioName, ratioValue)
Scan for particular named ratio of harmonic pattern to filter valid patterns
Namespace types: map
Parameters:
currentPatterns (map) : Current valid patterns map
rules (map) : map Harmonic ratio rules
properties (ScanProperties) : ScanProperties object
ratioName (string) : Specific ratio name
ratioValue (float) : ratio value to be checked
Returns: updated currentPatterns object
method scanPatterns(patterns, x, a, b, c, d, properties)
Scan for patterns based on X, A, B, C, D values
Namespace types: map
Parameters:
patterns (map) : List of allowed patterns
x (float) : X coordinate
a (float) : A coordinate
b (float) : B coordinate
c (float) : C coordinate
d (float) : D coordinate
properties (ScanProperties) : ScanProperties object. If na, default values are initialised
Returns: updated valid patterns map
method scanProjections(patterns, x, a, b, c, properties)
Scan for projections based on X, A, B, C values
Namespace types: map
Parameters:
patterns (map) : List of allowed patterns
x (float) : X coordinate
a (float) : A coordinate
b (float) : B coordinate
c (float) : C coordinate
properties (ScanProperties) : ScanProperties object. If na, default values are initialised
Returns: updated valid projections map
method merge(this, other)
merge two ranges into one
Namespace types: Range
Parameters:
this (Range) : first range
other (Range) : second range
Returns: combined range
method union(this, other)
union of two ranges into one
Namespace types: Range
Parameters:
this (Range) : first range
other (Range) : second range
Returns: union range
method overlaps(this, other)
checks if two ranges intersect
Namespace types: Range
Parameters:
this (Range) : first range
other (Range) : second range
Returns: true if intersects, false otherwise
method consolidate(this)
Consolidate ranges into PRZ
Namespace types: map
Parameters:
this (map) : map of Ranges
Returns: consolidated PRZ
method consolidateMany(this)
Consolidate ranges into multiple PRZ ranges
Namespace types: map
Parameters:
this (map) : map of Ranges
Returns: consolidated array of PRZ ranges
method getRange(currentPatterns, x, a, b, c, properties)
Get D range based on X, A, B, C coordinates for the current patterns
Namespace types: map
Parameters:
currentPatterns (map) : List of valid patterns
x (float) : X coordinate
a (float) : A coordinate
b (float) : B coordinate
c (float) : C coordinate
properties (ScanProperties) : ScanProperties object. If na, default values are initialised
Returns: map of D ranges
method getPrzRange(currentPatterns, x, a, b, c, properties)
Get PRZ range based on X, A, B, C coordinates for the current patterns
Namespace types: map
Parameters:
currentPatterns (map) : List of valid patterns
x (float) : X coordinate
a (float) : A coordinate
b (float) : B coordinate
c (float) : C coordinate
properties (ScanProperties) : ScanProperties object. If na, default values are initialised
Returns: PRZRange for the pattern
method getProjectionRanges(currentPatterns, x, a, b, c, properties)
Get projection range based on X, A, B, C coordinates for the current patterns
Namespace types: map
Parameters:
currentPatterns (map) : List of valid patterns
x (float) : X coordinate
a (float) : A coordinate
b (float) : B coordinate
c (float) : C coordinate
properties (ScanProperties) : ScanProperties object. If na, default values are initialised
Returns: array of projection ranges
Range
Collection of range values
Fields:
values (array) : array of float values
RatioMap
ratio map for pattern
Fields:
ratioMap (map) : map of string to Range (array of float)
ScanProperties
Pattern Scanning properties
Fields:
strictMode (series bool) : strict scanning mode will check for overflows
logScale (series bool) : scan ratios in log scale
errorMin (series float) : min error threshold
errorMax (series float)
mintick (series float) : minimum tick value of price
PrzRange
Potential reversal zone range
Fields:
patterns (array) : array of pattern names for the given XABCD combination
prz (Range) : PRZ range
datastructuresLibrary "datastructures"
Collection of complex data structures not generally present as part of pinescript and can be used for collection and transformation of the data
method init(this)
initialise StringSet
Namespace types: StringSet
Parameters:
this (StringSet) : StringSet to be initialised
Returns: current object of StringSet
method add(this, value)
add value to StringSet
Namespace types: StringSet
Parameters:
this (StringSet) : StringSet object
@value the key of stringset to be set
value (string)
Returns: current object of StringSet
method clear(this)
clear StringSet contents
Namespace types: StringSet
Parameters:
this (StringSet) : StringSet object
Returns: current object of StringSet
method remove(this, value)
remove value from StringSet
Namespace types: StringSet
Parameters:
this (StringSet) : StringSet object
@value the key of stringset to be removed
value (string)
Returns: current object of StringSet
method size(this)
get size of the StringSet
Namespace types: StringSet
Parameters:
this (StringSet) : StringSet object
Returns: size of StringSet map
method isEmpty(this)
check if stringset is empty
Namespace types: StringSet
Parameters:
this (StringSet) : StringSet object
Returns: true if empty else returns false
method iterator(this)
get values of the StringSet
Namespace types: StringSet
Parameters:
this (StringSet) : StringSet object
Returns: values of StringSet
method contains(this, value)
check if value is present in StringSet
Namespace types: StringSet
Parameters:
this (StringSet) : StringSet object
value (string)
Returns: true if Value is present. False otherwise
method initialiseCountMap(types, numberOfStates)
Initialise a new map of string to Count
Namespace types: array
Parameters:
types (array) : array of string containing map keys
numberOfStates (int) : number of items to be tracked for each type
Returns: new map() with empty initialisation
method initialiseCountMap(types, numberOfStates)
Initialise a new map of string to Count
Namespace types: map
Parameters:
types (map) : map containing types and configurable boolean flag
numberOfStates (int) : number of items to be tracked for each type
Returns: new map() with empty initialisation
method get(this, key, n)
get count based on primary string key and secondary int key
Namespace types: map
Parameters:
this (map) : map of string to to Count
key (string) : primary key
n (int) : secondary key
Returns: derived count from map of map
method get(this, key, n)
get array of int associated with key and n
Namespace types: map
Parameters:
this (map) : map of string to to MapToInts
key (string) : primary string key
n (int) : secondary int key
Returns: derived array of int for the given key combination
method get(this, key, n)
get array of float associated with key and n
Namespace types: map
Parameters:
this (map) : map of string to to MapToFloats
key (string) : primary string key
n (int) : secondary int key
Returns: derived array of float
method get(this, key)
get values of Ints based on key
Namespace types: map
Parameters:
this (map) : map of string to Ints
key (string) : string key
Returns: values inside Ints object associated in the map
method set(this, key, n, value)
set count for specific primary and secondary key
Namespace types: map
Parameters:
this (map) : map of string to to Count
key (string) : primary string key
n (int) : secondary int key
value (int) : the new count value to be set
Returns: updated value for key and n
method increment(this, key, n)
increment count for specific primary and secondary key
Namespace types: map
Parameters:
this (map) : map of string to to Count
key (string) : primary string key
n (int) : secondary int key
Returns: incremented value
method increment(this, key, n)
intcrement the value of Ints based on key and n (secondary key)
Namespace types: map
Parameters:
this (map) : map of string to Ints
key (string) : string key
n (int) : secondary int key
Returns: incremented nth object of Ints associated with key
method initialiseIntsMap(types, numberOfStates)
Initialise a new map of string to Map to Ints
Namespace types: array
Parameters:
types (array) : array of string containing map keys
numberOfStates (int) : number of items to be tracked for each type
Returns: new map() with empty initialisation
method initialiseIntsMap(types, numberOfStates)
Initialise a new map of string to Map to Ints
Namespace types: map
Parameters:
types (map) : map with boolean flag
numberOfStates (int) : number of items to be tracked for each type
Returns: new map() with empty initialisation
method initialiseFloatsMap(types, numberOfStates)
Initialise a new map of string to Map to Floats
Namespace types: array
Parameters:
types (array) : array of string containing map keys
numberOfStates (int) : number of items to be tracked for each type
Returns: new map() with empty initialisation
method initialiseFloatsMap(types, numberOfStates)
Initialise a new map of string to Map to Floats
Namespace types: map
Parameters:
types (map) : map with boolean flag
numberOfStates (int) : number of items to be tracked for each type
Returns: new map() with empty initialisation
method initialiseMapOfInts(types, numberOfStates)
Initialise map of two dimentional Ints based on types and number of states
Namespace types: array
Parameters:
types (array) : types array for which a new Map to Ints to be created
numberOfStates (int) : number of states for which the Ints needs to be initialised
Returns: new map of string to two dimension array of int (Ints)
method initialiseMapOfInts(types, numberOfStates)
Initialise map of two dimentional Ints based on types and number of states
Namespace types: map
Parameters:
types (map) : types map for which a new Map to Ints to be created along with bool flag
numberOfStates (int) : number of states for which the Ints needs to be initialised
Returns: new map of string to two dimension array of int (Ints)
StringSet
Set implementation using map
Fields:
strSet (map) : map of string to bool
Count
type containing map of int to int
Fields:
count (map) : map of int to int used for counting
Ints
custom type to enable array of array of int
Fields:
values (array) : int array
Floats
custom type to enable array of array of float
Fields:
values (array) : float array
MapToInts
type containing map of int to int array
Fields:
vmap (map) : map of int to Ints used as counting collection
MapToFloats
type containing map of int to float array
Fields:
vmap (map) : map of int to Floats used as floating stat collection

drawingutilsLibrary "drawingutils"
methods used in my scripts for some basic and customized drawings and arrays.
method line(this, p1, p2, lineColor, style, width, xloc, extend)
Draws line and adds to the array
Namespace types: array
Parameters:
this (array) : array to which the created line needs to be added
p1 (chart.point) : point1 of the line
p2 (chart.point) : point2 of the line
lineColor (color) : line color
style (string) : line style
width (int) : line width
xloc (string) : xloc.bar_index or xloc.bar_time
extend (string) : default is extend.none
Returns: line created
method label(this, p, txt, tooltip, xloc, yloc, color, style, textcolor, size, textalign)
Draws label and adds to the array
Namespace types: array
Parameters:
this (array) : array to which the created label needs to be added
p (chart.point) : point at which the label needs to be drawn
txt (string) : label text
tooltip (string) : tooltip text
xloc (string) : xloc value - xloc.bar_index or xloc.bar_time
yloc (string) : y location of the label
color (color) : label color
style (string) : label style
textcolor (color) : label text color
size (string) : Size of the label
textalign (string) : text alignment
Returns: label created
method linefill(this, ln1, ln2, fillColor, transparency)
Draws linefill and adds to array
Namespace types: array
Parameters:
this (array) : array to which the created linefill needs to be added
ln1 (line) : line1 of the fill
ln2 (line) : line2 of the fill
fillColor (color) : fill Color
transparency (int) : fill transparency
Returns: linefill created
draw_labelled_line(target, lblText, linecolor, labelcolor, index, highlight, linesArray, labelsArray, highlightSize, tinySize, yloc, textalign)
Draws labelled line
Parameters:
target (float) : target price
lblText (string) : label text
linecolor (color) : line color
labelcolor (color) : label color
index (int) : index to calculate the distance offset
highlight (bool) : highlight true/false
linesArray (array) : array of lines where the created line is added
labelsArray (array) : array of labels where the created label is added
highlightSize (string) : Size of highlighted text
tinySize (string) : size of non highlighted text
yloc (string) : y location
textalign (string) : text alignment
Returns: void
draw_labelled_box(y1, y2, labelColor, labelText, index, boxArray, labelArray, borderColor, borderStyle, borderWidth, textAlign, highlight, highLightLabel)
Draws custom labelled box
Parameters:
y1 (float) : price 1 of the box
y2 (float) : price 2 of the box
labelColor (color) : label color
labelText (string) : label text
index (int) : index to calculate the offset distance
boxArray (array) : box array to which the box needs to be added
labelArray (array) : label array to which the label needs to be added
borderColor (color) : border color
borderStyle (string) : border style
borderWidth (int) : border width
textAlign (string) : text align of the label
highlight (bool) : highlight label text
highLightLabel (bool) : highlight label size
Returns: void

FA_PA_LIBLibrary "FA_PA_LIB"
A collection of custom tools & utility functions commonly used for coding Dr Al Brooks, Price Action System with my scripts
getBodySize()
Gets the current candle's body size (in POINTS, divide by 10 to get pips)
Returns: The current candle's body size in POINTS
getTopWickSize()
Gets the current candle's top wick size (in POINTS, divide by 10 to get pips)
Returns: The current candle's top wick size in POINTS
getTopWickPercent()
Gets the current candle's top wick size (in POINTS, divide by 10 to get pips)
Returns: Percent of total candle width that is occupied by the upper wick
getBottomWickSize()
Gets the current candle's bottom wick size (in POINTS, divide by 10 to get pips)
Returns: The current candle's bottom wick size in POINTS
getBottomWickPercent()
Gets the current candle's bottom wick size (in POINTS, divide by 10 to get pips)
Returns: Percent of total candle width that is occupied by the lower wick
getBarMidPoint()
Gets the current candle's midpoint wick to wick
Returns: The current candle's mid point
getBodyPercent()
Gets the current candle's body size as a percentage of its entire size including its wicks
Returns: The current candle's body size percentage (00.00)
bullFib(priceLow, priceHigh, fibRatio)
Calculates a bullish fibonacci value
Parameters:
priceLow (float) : The lowest price point
priceHigh (float) : The highest price point
fibRatio (float) : The fibonacci % ratio to calculate
Returns: The fibonacci value of the given ratio between the two price points
bearFib(priceLow, priceHigh, fibRatio)
Calculates a bearish fibonacci value
Parameters:
priceLow (float) : The lowest price point
priceHigh (float) : The highest price point
fibRatio (float) : The fibonacci % ratio to calculate
Returns: The fibonacci value of the given ratio between the two price points
isBr()
Checks if the current bar is a Bear Bar
Returns: A boolean - true if the current bar is bear candle
isBl()
Checks if the current bar is a Bull Bar
Returns: A boolean - true if the current bar is Bull candle
isTrendBar()
Checks if the current bar is a Trend Bar. Candle that its body size is greater than 50% of entire candle size
Returns: A boolean - true if the current bar is Trend candle
isBlTrendBar()
Checks if the current bar is a Bull Trend Bar. Bullish candle that its body size is greater than 50% of entire candle size
Returns: A boolean - true if the current bar is Bull Trend candle
isBrTrendBar()
Checks if the current bar is a Bull Trend Bar. Bullish candle that its body size is greater than 50% of entire candle size
Returns: A boolean - true if the current bar is Bull Trend candle
isBlRevB()
Checks if the current bar is a Bull Reversal Bar. Bullish candle that closes on upper half of candle body
Returns: A boolean - true if the current bar is Bull Reversal candle
isBrRevB()
Checks if the current bar is a Bear Reversal Bar. BulBearish candle that closes on lower half of candle body
Returns: A boolean - true if the current bar is Bear Reversal candle
isDoji(wickSize, bodySize)
Checks if the current bar is a doji candle based on the given parameters
Parameters:
wickSize (float) : (default=2) The maximum top wick size compared to the bottom (and vice versa)
bodySize (float) : (default=0.05) The maximum body size as a percentage compared to the entire candle size
Returns: A boolean - true if the current bar matches the requirements of a doji candle
isHammer(fib, colorMatch)
Checks if the current bar is a hammer candle based on the given parameters
Parameters:
fib (float) : (default=0.382) The fib to base candle body on
colorMatch (bool) : (default=true) Does the candle need to be green? (true/false)
Returns: A boolean - true if the current bar matches the requirements of a hammer candle
isStar(fib, colorMatch)
Checks if the current bar is a shooting star candle based on the given parameters
Parameters:
fib (float) : (default=0.382) The fib to base candle body on
colorMatch (bool) : (default=false) Does the candle need to be red? (true/false)
Returns: A boolean - true if the current bar matches the requirements of a shooting star candle
isBlOB()
Detects Bullish outside bars(OB)
Returns: Returns true if the current bar is a bull outside bar
isBrOB()
Detects Bearish outside bars(OB)
Returns: Returns true if the current bar is a bear outside bar
real_time_candlesIntroduction
The Real-Time Candles Library provides comprehensive tools for creating, manipulating, and visualizing custom timeframe candles in Pine Script. Unlike standard indicators that only update at bar close, this library enables real-time visualization of price action and indicators within the current bar, offering traders unprecedented insight into market dynamics as they unfold.
This library addresses a fundamental limitation in traditional technical analysis: the inability to see how indicators evolve between bar closes. By implementing sophisticated real-time data processing techniques, traders can now observe indicator movements, divergences, and trend changes as they develop, potentially identifying trading opportunities much earlier than with conventional approaches.
Key Features
The library supports two primary candle generation approaches:
Chart-Time Candles: Generate real-time OHLC data for any variable (like RSI, MACD, etc.) while maintaining synchronization with chart bars.
Custom Timeframe (CTF) Candles: Create candles with custom time intervals or tick counts completely independent of the chart's native timeframe.
Both approaches support traditional candlestick and Heikin-Ashi visualization styles, with options for moving average overlays to smooth the data.
Configuration Requirements
For optimal performance with this library:
Set max_bars_back = 5000 in your script settings
When using CTF drawing functions, set max_lines_count = 500, max_boxes_count = 500, and max_labels_count = 500
These settings ensure that you will be able to draw correctly and will avoid any runtime errors.
Usage Examples
Basic Chart-Time Candle Visualization
// Create real-time candles for RSI
float rsi = ta.rsi(close, 14)
Candle rsi_candle = candle_series(rsi, CandleType.candlestick)
// Plot the candles using Pine's built-in function
plotcandle(rsi_candle.Open, rsi_candle.High, rsi_candle.Low, rsi_candle.Close,
"RSI Candles", rsi_candle.candle_color, rsi_candle.candle_color)
Multiple Access Patterns
The library provides three ways to access candle data, accommodating different programming styles:
// 1. Array-based access for collection operations
Candle candles = candle_array(source)
// 2. Object-oriented access for single entity manipulation
Candle candle = candle_series(source)
float value = candle.source(Source.HLC3)
// 3. Tuple-based access for functional programming styles
= candle_tuple(source)
Custom Timeframe Examples
// Create 20-second candles with EMA overlay
plot_ctf_candles(
source = close,
candle_type = CandleType.candlestick,
sample_type = SampleType.Time,
number_of_seconds = 20,
timezone = -5,
tied_open = true,
ema_period = 9,
enable_ema = true
)
// Create tick-based candles (new candle every 15 ticks)
plot_ctf_tick_candles(
source = close,
candle_type = CandleType.heikin_ashi,
number_of_ticks = 15,
timezone = -5,
tied_open = true
)
Advanced Usage with Custom Visualization
// Get custom timeframe candles without automatic plotting
CandleCTF my_candles = ctf_candles_array(
source = close,
candle_type = CandleType.candlestick,
sample_type = SampleType.Time,
number_of_seconds = 30
)
// Apply custom logic to the candles
float ema_values = my_candles.ctf_ema(14)
// Draw candles and EMA using time-based coordinates
my_candles.draw_ctf_candles_time()
ema_values.draw_ctf_line_time(line_color = #FF6D00)
Library Components
Data Types
Candle: Structure representing chart-time candles with OHLC, polarity, and visualization properties
CandleCTF: Extended candle structure with additional time metadata for custom timeframes
TickData: Structure for individual price updates with time deltas
Enumerations
CandleType: Specifies visualization style (candlestick or Heikin-Ashi)
Source: Defines price components for calculations (Open, High, Low, Close, HL2, etc.)
SampleType: Sets sampling method (Time-based or Tick-based)
Core Functions
get_tick(): Captures current price as a tick data point
candle_array(): Creates an array of candles from price updates
candle_series(): Provides a single candle based on latest data
candle_tuple(): Returns OHLC values as a tuple
ctf_candles_array(): Creates custom timeframe candles without rendering
Visualization Functions
source(): Extracts specific price components from candles
candle_ctf_to_float(): Converts candle data to float arrays
ctf_ema(): Calculates exponential moving averages for candle arrays
draw_ctf_candles_time(): Renders candles using time coordinates
draw_ctf_candles_index(): Renders candles using bar index coordinates
draw_ctf_line_time(): Renders lines using time coordinates
draw_ctf_line_index(): Renders lines using bar index coordinates
Technical Implementation Notes
This library leverages Pine Script's varip variables for state management, creating a sophisticated real-time data processing system. The implementation includes:
Efficient tick capturing: Samples price at every execution, maintaining temporal tracking with time deltas
Smart state management: Uses a hybrid approach with mutable updates at index 0 and historical preservation at index 1+
Temporal synchronization: Manages two time domains (chart time and custom timeframe)
The tooltip implementation provides crucial temporal context for custom timeframe visualizations, allowing users to understand exactly when each candle formed regardless of chart timeframe.
Limitations
Custom timeframe candles cannot be backtested due to Pine Script's limitations with historical tick data
Real-time visualization is only available during live chart updates
Maximum history is constrained by Pine Script's array size limits
Applications
Indicator visualization: See how RSI, MACD, or other indicators evolve in real-time
Volume analysis: Create custom volume profiles independent of chart timeframe
Scalping strategies: Identify short-term patterns with precisely defined time windows
Volatility measurement: Track price movement characteristics within bars
Custom signal generation: Create entry/exit signals based on custom timeframe patterns
Conclusion
The Real-Time Candles Library bridges the gap between traditional technical analysis (based on discrete OHLC bars) and the continuous nature of market movement. By making indicators more responsive to real-time price action, it gives traders a significant edge in timing and decision-making, particularly in fast-moving markets where waiting for bar close could mean missing important opportunities.
Whether you're building custom indicators, researching price patterns, or developing trading strategies, this library provides the foundation for sophisticated real-time analysis in Pine Script.
Implementation Details & Advanced Guide
Core Implementation Concepts
The Real-Time Candles Library implements a sophisticated event-driven architecture within Pine Script's constraints. At its heart, the library creates what's essentially a reactive programming framework handling continuous data streams.
Tick Processing System
The foundation of the library is the get_tick() function, which captures price updates as they occur:
export get_tick(series float source = close, series float na_replace = na)=>
varip float price = na
varip int series_index = -1
varip int old_time = 0
varip int new_time = na
varip float time_delta = 0
// ...
This function:
Samples the current price
Calculates time elapsed since last update
Maintains a sequential index to track updates
The resulting TickData structure serves as the fundamental building block for all candle generation.
State Management Architecture
The library employs a sophisticated state management system using varip variables, which persist across executions within the same bar. This creates a hybrid programming paradigm that's different from standard Pine Script's bar-by-bar model.
For chart-time candles, the core state transition logic is:
// Real-time update of current candle
candle_data := Candle.new(Open, High, Low, Close, polarity, series_index, candle_color)
candles.set(0, candle_data)
// When a new bar starts, preserve the previous candle
if clear_state
candles.insert(1, candle_data)
price.clear()
// Reset state for new candle
Open := Close
price.push(Open)
series_index += 1
This pattern of updating index 0 in real-time while inserting completed candles at index 1 creates an elegant solution for maintaining both current state and historical data.
Custom Timeframe Implementation
The custom timeframe system manages its own time boundaries independent of chart bars:
bool clear_state = switch settings.sample_type
SampleType.Ticks => cumulative_series_idx >= settings.number_of_ticks
SampleType.Time => cumulative_time_delta >= settings.number_of_seconds
This dual-clock system synchronizes two time domains:
Pine's execution clock (bar-by-bar processing)
The custom timeframe clock (tick or time-based)
The library carefully handles temporal discontinuities, ensuring candle formation remains accurate despite irregular tick arrival or market gaps.
Advanced Usage Techniques
1. Creating Custom Indicators with Real-Time Candles
To develop indicators that process real-time data within the current bar:
// Get real-time candles for your data
Candle rsi_candles = candle_array(ta.rsi(close, 14))
// Calculate indicator values based on candle properties
float signal = ta.ema(rsi_candles.first().source(Source.Close), 9)
// Detect patterns that occur within the bar
bool divergence = close > close and rsi_candles.first().Close < rsi_candles.get(1).Close
2. Working with Custom Timeframes and Plotting
For maximum flexibility when visualizing custom timeframe data:
// Create custom timeframe candles
CandleCTF volume_candles = ctf_candles_array(
source = volume,
candle_type = CandleType.candlestick,
sample_type = SampleType.Time,
number_of_seconds = 60
)
// Convert specific candle properties to float arrays
float volume_closes = volume_candles.candle_ctf_to_float(Source.Close)
// Calculate derived values
float volume_ema = volume_candles.ctf_ema(14)
// Create custom visualization
volume_candles.draw_ctf_candles_time()
volume_ema.draw_ctf_line_time(line_color = color.orange)
3. Creating Hybrid Timeframe Analysis
One powerful application is comparing indicators across multiple timeframes:
// Standard chart timeframe RSI
float chart_rsi = ta.rsi(close, 14)
// Custom 5-second timeframe RSI
CandleCTF ctf_candles = ctf_candles_array(
source = close,
candle_type = CandleType.candlestick,
sample_type = SampleType.Time,
number_of_seconds = 5
)
float fast_rsi_array = ctf_candles.candle_ctf_to_float(Source.Close)
float fast_rsi = fast_rsi_array.first()
// Generate signals based on divergence between timeframes
bool entry_signal = chart_rsi < 30 and fast_rsi > fast_rsi_array.get(1)
Final Notes
This library represents an advanced implementation of real-time data processing within Pine Script's constraints. By creating a reactive programming framework for handling continuous data streams, it enables sophisticated analysis typically only available in dedicated trading platforms.
The design principles employed—including state management, temporal processing, and object-oriented architecture—can serve as patterns for other advanced Pine Script development beyond this specific application.
------------------------
Library "real_time_candles"
A comprehensive library for creating real-time candles with customizable timeframes and sampling methods.
Supports both chart-time and custom-time candles with options for candlestick and Heikin-Ashi visualization.
Allows for tick-based or time-based sampling with moving average overlay capabilities.
get_tick(source, na_replace)
Captures the current price as a tick data point
Parameters:
source (float) : Optional - Price source to sample (defaults to close)
na_replace (float) : Optional - Value to use when source is na
Returns: TickData structure containing price, time since last update, and sequential index
candle_array(source, candle_type, sync_start, bullish_color, bearish_color)
Creates an array of candles based on price updates
Parameters:
source (float) : Optional - Price source to sample (defaults to close)
candle_type (simple CandleType) : Optional - Type of candle chart to create (candlestick or Heikin-Ashi)
sync_start (simple bool) : Optional - Whether to synchronize with the start of a new bar
bullish_color (color) : Optional - Color for bullish candles
bearish_color (color) : Optional - Color for bearish candles
Returns: Array of Candle objects ordered with most recent at index 0
candle_series(source, candle_type, wait_for_sync, bullish_color, bearish_color)
Provides a single candle based on the latest price data
Parameters:
source (float) : Optional - Price source to sample (defaults to close)
candle_type (simple CandleType) : Optional - Type of candle chart to create (candlestick or Heikin-Ashi)
wait_for_sync (simple bool) : Optional - Whether to wait for a new bar before starting
bullish_color (color) : Optional - Color for bullish candles
bearish_color (color) : Optional - Color for bearish candles
Returns: A single Candle object representing the current state
candle_tuple(source, candle_type, wait_for_sync, bullish_color, bearish_color)
Provides candle data as a tuple of OHLC values
Parameters:
source (float) : Optional - Price source to sample (defaults to close)
candle_type (simple CandleType) : Optional - Type of candle chart to create (candlestick or Heikin-Ashi)
wait_for_sync (simple bool) : Optional - Whether to wait for a new bar before starting
bullish_color (color) : Optional - Color for bullish candles
bearish_color (color) : Optional - Color for bearish candles
Returns: Tuple representing current candle values
method source(self, source, na_replace)
Extracts a specific price component from a Candle
Namespace types: Candle
Parameters:
self (Candle)
source (series Source) : Type of price data to extract (Open, High, Low, Close, or composite values)
na_replace (float) : Optional - Value to use when source value is na
Returns: The requested price value from the candle
method source(self, source)
Extracts a specific price component from a CandleCTF
Namespace types: CandleCTF
Parameters:
self (CandleCTF)
source (simple Source) : Type of price data to extract (Open, High, Low, Close, or composite values)
Returns: The requested price value from the candle as a varip
method candle_ctf_to_float(self, source)
Converts a specific price component from each CandleCTF to a float array
Namespace types: array
Parameters:
self (array)
source (simple Source) : Optional - Type of price data to extract (defaults to Close)
Returns: Array of float values extracted from the candles, ordered with most recent at index 0
method ctf_ema(self, ema_period)
Calculates an Exponential Moving Average for a CandleCTF array
Namespace types: array
Parameters:
self (array)
ema_period (simple float) : Period for the EMA calculation
Returns: Array of float values representing the EMA of the candle data, ordered with most recent at index 0
method draw_ctf_candles_time(self, sample_type, number_of_ticks, number_of_seconds, timezone)
Renders custom timeframe candles using bar time coordinates
Namespace types: array
Parameters:
self (array)
sample_type (simple SampleType) : Optional - Method for sampling data (Time or Ticks), used for tooltips
number_of_ticks (simple int) : Optional - Number of ticks per candle (used when sample_type is Ticks), used for tooltips
number_of_seconds (simple float) : Optional - Time duration per candle in seconds (used when sample_type is Time), used for tooltips
timezone (simple int) : Optional - Timezone offset from UTC (-12 to +12), used for tooltips
Returns: void - Renders candles on the chart using time-based x-coordinates
method draw_ctf_candles_index(self, sample_type, number_of_ticks, number_of_seconds, timezone)
Renders custom timeframe candles using bar index coordinates
Namespace types: array
Parameters:
self (array)
sample_type (simple SampleType) : Optional - Method for sampling data (Time or Ticks), used for tooltips
number_of_ticks (simple int) : Optional - Number of ticks per candle (used when sample_type is Ticks), used for tooltips
number_of_seconds (simple float) : Optional - Time duration per candle in seconds (used when sample_type is Time), used for tooltips
timezone (simple int) : Optional - Timezone offset from UTC (-12 to +12), used for tooltips
Returns: void - Renders candles on the chart using index-based x-coordinates
method draw_ctf_line_time(self, source, line_size, line_color)
Renders a line representing a price component from the candles using time coordinates
Namespace types: array
Parameters:
self (array)
source (simple Source) : Optional - Type of price data to extract (defaults to Close)
line_size (simple int) : Optional - Width of the line
line_color (simple color) : Optional - Color of the line
Returns: void - Renders a connected line on the chart using time-based x-coordinates
method draw_ctf_line_time(self, line_size, line_color)
Renders a line from a varip float array using time coordinates
Namespace types: array
Parameters:
self (array)
line_size (simple int) : Optional - Width of the line, defaults to 2
line_color (simple color) : Optional - Color of the line
Returns: void - Renders a connected line on the chart using time-based x-coordinates
method draw_ctf_line_index(self, source, line_size, line_color)
Renders a line representing a price component from the candles using index coordinates
Namespace types: array
Parameters:
self (array)
source (simple Source) : Optional - Type of price data to extract (defaults to Close)
line_size (simple int) : Optional - Width of the line
line_color (simple color) : Optional - Color of the line
Returns: void - Renders a connected line on the chart using index-based x-coordinates
method draw_ctf_line_index(self, line_size, line_color)
Renders a line from a varip float array using index coordinates
Namespace types: array
Parameters:
self (array)
line_size (simple int) : Optional - Width of the line, defaults to 2
line_color (simple color) : Optional - Color of the line
Returns: void - Renders a connected line on the chart using index-based x-coordinates
plot_ctf_tick_candles(source, candle_type, number_of_ticks, timezone, tied_open, ema_period, bullish_color, bearish_color, line_width, ema_color, use_time_indexing)
Plots tick-based candles with moving average
Parameters:
source (float) : Input price source to sample
candle_type (simple CandleType) : Type of candle chart to display
number_of_ticks (simple int) : Number of ticks per candle
timezone (simple int) : Timezone offset from UTC (-12 to +12)
tied_open (simple bool) : Whether to tie open price to close of previous candle
ema_period (simple float) : Period for the exponential moving average
bullish_color (color) : Optional - Color for bullish candles
bearish_color (color) : Optional - Color for bearish candles
line_width (simple int) : Optional - Width of the moving average line, defaults to 2
ema_color (color) : Optional - Color of the moving average line
use_time_indexing (simple bool) : Optional - When true the function will plot with xloc.time, when false it will plot using xloc.bar_index
Returns: void - Creates visual candle chart with EMA overlay
plot_ctf_tick_candles(source, candle_type, number_of_ticks, timezone, tied_open, bullish_color, bearish_color, use_time_indexing)
Plots tick-based candles without moving average
Parameters:
source (float) : Input price source to sample
candle_type (simple CandleType) : Type of candle chart to display
number_of_ticks (simple int) : Number of ticks per candle
timezone (simple int) : Timezone offset from UTC (-12 to +12)
tied_open (simple bool) : Whether to tie open price to close of previous candle
bullish_color (color) : Optional - Color for bullish candles
bearish_color (color) : Optional - Color for bearish candles
use_time_indexing (simple bool) : Optional - When true the function will plot with xloc.time, when false it will plot using xloc.bar_index
Returns: void - Creates visual candle chart without moving average
plot_ctf_time_candles(source, candle_type, number_of_seconds, timezone, tied_open, ema_period, bullish_color, bearish_color, line_width, ema_color, use_time_indexing)
Plots time-based candles with moving average
Parameters:
source (float) : Input price source to sample
candle_type (simple CandleType) : Type of candle chart to display
number_of_seconds (simple float) : Time duration per candle in seconds
timezone (simple int) : Timezone offset from UTC (-12 to +12)
tied_open (simple bool) : Whether to tie open price to close of previous candle
ema_period (simple float) : Period for the exponential moving average
bullish_color (color) : Optional - Color for bullish candles
bearish_color (color) : Optional - Color for bearish candles
line_width (simple int) : Optional - Width of the moving average line, defaults to 2
ema_color (color) : Optional - Color of the moving average line
use_time_indexing (simple bool) : Optional - When true the function will plot with xloc.time, when false it will plot using xloc.bar_index
Returns: void - Creates visual candle chart with EMA overlay
plot_ctf_time_candles(source, candle_type, number_of_seconds, timezone, tied_open, bullish_color, bearish_color, use_time_indexing)
Plots time-based candles without moving average
Parameters:
source (float) : Input price source to sample
candle_type (simple CandleType) : Type of candle chart to display
number_of_seconds (simple float) : Time duration per candle in seconds
timezone (simple int) : Timezone offset from UTC (-12 to +12)
tied_open (simple bool) : Whether to tie open price to close of previous candle
bullish_color (color) : Optional - Color for bullish candles
bearish_color (color) : Optional - Color for bearish candles
use_time_indexing (simple bool) : Optional - When true the function will plot with xloc.time, when false it will plot using xloc.bar_index
Returns: void - Creates visual candle chart without moving average
plot_ctf_candles(source, candle_type, sample_type, number_of_ticks, number_of_seconds, timezone, tied_open, ema_period, bullish_color, bearish_color, enable_ema, line_width, ema_color, use_time_indexing)
Unified function for plotting candles with comprehensive options
Parameters:
source (float) : Input price source to sample
candle_type (simple CandleType) : Optional - Type of candle chart to display
sample_type (simple SampleType) : Optional - Method for sampling data (Time or Ticks)
number_of_ticks (simple int) : Optional - Number of ticks per candle (used when sample_type is Ticks)
number_of_seconds (simple float) : Optional - Time duration per candle in seconds (used when sample_type is Time)
timezone (simple int) : Optional - Timezone offset from UTC (-12 to +12)
tied_open (simple bool) : Optional - Whether to tie open price to close of previous candle
ema_period (simple float) : Optional - Period for the exponential moving average
bullish_color (color) : Optional - Color for bullish candles
bearish_color (color) : Optional - Color for bearish candles
enable_ema (bool) : Optional - Whether to display the EMA overlay
line_width (simple int) : Optional - Width of the moving average line, defaults to 2
ema_color (color) : Optional - Color of the moving average line
use_time_indexing (simple bool) : Optional - When true the function will plot with xloc.time, when false it will plot using xloc.bar_index
Returns: void - Creates visual candle chart with optional EMA overlay
ctf_candles_array(source, candle_type, sample_type, number_of_ticks, number_of_seconds, tied_open, bullish_color, bearish_color)
Creates an array of custom timeframe candles without rendering them
Parameters:
source (float) : Input price source to sample
candle_type (simple CandleType) : Type of candle chart to create (candlestick or Heikin-Ashi)
sample_type (simple SampleType) : Method for sampling data (Time or Ticks)
number_of_ticks (simple int) : Optional - Number of ticks per candle (used when sample_type is Ticks)
number_of_seconds (simple float) : Optional - Time duration per candle in seconds (used when sample_type is Time)
tied_open (simple bool) : Optional - Whether to tie open price to close of previous candle
bullish_color (color) : Optional - Color for bullish candles
bearish_color (color) : Optional - Color for bearish candles
Returns: Array of CandleCTF objects ordered with most recent at index 0
Candle
Structure representing a complete candle with price data and display properties
Fields:
Open (series float) : Opening price of the candle
High (series float) : Highest price of the candle
Low (series float) : Lowest price of the candle
Close (series float) : Closing price of the candle
polarity (series bool) : Boolean indicating if candle is bullish (true) or bearish (false)
series_index (series int) : Sequential index identifying the candle in the series
candle_color (series color) : Color to use when rendering the candle
ready (series bool) : Boolean indicating if candle data is valid and ready for use
TickData
Structure for storing individual price updates
Fields:
price (series float) : The price value at this tick
time_delta (series float) : Time elapsed since the previous tick in milliseconds
series_index (series int) : Sequential index identifying this tick
CandleCTF
Structure representing a custom timeframe candle with additional time metadata
Fields:
Open (series float) : Opening price of the candle
High (series float) : Highest price of the candle
Low (series float) : Lowest price of the candle
Close (series float) : Closing price of the candle
polarity (series bool) : Boolean indicating if candle is bullish (true) or bearish (false)
series_index (series int) : Sequential index identifying the candle in the series
open_time (series int) : Timestamp marking when the candle was opened (in Unix time)
time_delta (series float) : Duration of the candle in milliseconds
candle_color (series color) : Color to use when rendering the candle

rzigzagLibrary "rzigzag"
Recursive Zigzag Using Matrix allows to create zigzags recursively on multiple levels. This is an old library converted to V6
zigzag(length, ohlc, numberOfPivots, offset)
calculates plain zigzag based on input
Parameters:
length (int) : Zigzag Length
ohlc (array) : Array containing ohlc values. Can also contain custom series
numberOfPivots (simple int) : Number of max pivots to be returned
offset (simple int) : Offset from current bar. Can be used for calculations based on confirmed bars
Returns: [matrix zigzagmatrix, bool flags]
iZigzag(length, h, l, numberOfPivots)
calculates plain zigzag based on input array
Parameters:
length (int) : Zigzag Length
h (array) : array containing high values of a series
l (array) : array containing low values of a series
numberOfPivots (simple int) : Number of max pivots to be returned
Returns: matrix zigzagmatrix
nextlevel(zigzagmatrix, numberOfPivots)
calculates next level zigzag based on present zigzag coordinates
Parameters:
zigzagmatrix (matrix) : Matrix containing zigzag pivots, bars, bar time, direction and level
numberOfPivots (simple int) : Number of max pivots to be returned
Returns: matrix zigzagmatrix
draw(zigzagmatrix, flags, lineColor, lineWidth, lineStyle, showLabel, xloc)
draws zigzag based on the zigzagmatrix input
Parameters:
zigzagmatrix (matrix) : Matrix containing zigzag pivots, bars, bar time, direction and level
flags (array) : Zigzag pivot flags
lineColor (color) : Zigzag line color
lineWidth (int) : Zigzag line width
lineStyle (string) : Zigzag line style
showLabel (bool) : Flag to indicate display pivot labels
xloc (string) : xloc preference for drawing lines/labels
Returns:
draw(length, ohlc, numberOfPivots, offset, lineColor, lineWidth, lineStyle, showLabel, xloc)
calculates and draws zigzag based on zigzag length and source input
Parameters:
length (int) : Zigzag Length
ohlc (array) : Array containing ohlc values. Can also contain custom series
numberOfPivots (simple int) : Number of max pivots to be returned
offset (simple int) : Offset from current bar. Can be used for calculations based on confirmed bars
lineColor (color) : Zigzag line color
lineWidth (int) : Zigzag line width
lineStyle (string) : Zigzag line style
showLabel (bool) : Flag to indicate display pivot labels
xloc (string) : xloc preference for drawing lines/labels
Returns: [matrix zigzagmatrix, array zigzaglines, array zigzaglabels, bool flags]
drawfresh(zigzagmatrix, zigzaglines, zigzaglabels, lineColor, lineWidth, lineStyle, showLabel, xloc)
draws fresh zigzag for all pivots in the input matrix.
Parameters:
zigzagmatrix (matrix) : Matrix containing zigzag pivots, bars, bar time, direction and level
zigzaglines (array) : array to which all newly created lines will be added
zigzaglabels (array) : array to which all newly created lables will be added
lineColor (color) : Zigzag line color
lineWidth (int) : Zigzag line width
lineStyle (string) : Zigzag line style
showLabel (bool) : Flag to indicate display pivot labels
xloc (string) : xloc preference for drawing lines/labels
Returns:

_matrixLibrary "_matrix"
Library helps visualize matrix as array of arrays and enables users to use array methods such as push, pop, shift, unshift etc along with cleanup activities on drawing objects wherever required
method delete(mtx, rowNumber)
deletes row from a matrix
Namespace types: matrix
Parameters:
mtx (matrix) : matrix of objects
rowNumber (int) : row index to be deleted
Returns: void
method delete(mtx, rowNumber)
Namespace types: matrix
Parameters:
mtx (matrix)
rowNumber (int)
method delete(mtx, rowNumber)
Namespace types: matrix
Parameters:
mtx (matrix)
rowNumber (int)
method delete(mtx, rowNumber)
Namespace types: matrix
Parameters:
mtx (matrix)
rowNumber (int)
method delete(mtx, rowNumber)
Namespace types: matrix
Parameters:
mtx (matrix)
rowNumber (int)
method delete(mtx, rowNumber)
Namespace types: matrix
Parameters:
mtx (matrix)
rowNumber (int)
method delete(mtx, rowNumber)
Namespace types: matrix
Parameters:
mtx (matrix)
rowNumber (int)
method delete(mtx, rowNumber)
Namespace types: matrix
Parameters:
mtx (matrix)
rowNumber (int)
method delete(mtx, rowNumber)
Namespace types: matrix
Parameters:
mtx (matrix)
rowNumber (int)
method delete(mtx, rowNumber)
Namespace types: matrix
Parameters:
mtx (matrix)
rowNumber (int)
method remove(mtx, rowNumber)
remove row from a matrix and returns them to caller
Namespace types: matrix
Parameters:
mtx (matrix) : matrix of objects
rowNumber (int) : row index to be deleted
Returns: type
method remove(mtx, rowNumber)
Namespace types: matrix
Parameters:
mtx (matrix)
rowNumber (int)
method remove(mtx, rowNumber)
Namespace types: matrix
Parameters:
mtx (matrix)
rowNumber (int)
method remove(mtx, rowNumber)
Namespace types: matrix
Parameters:
mtx (matrix)
rowNumber (int)
method remove(mtx, rowNumber)
Namespace types: matrix
Parameters:
mtx (matrix)
rowNumber (int)
method remove(mtx, rowNumber)
Namespace types: matrix
Parameters:
mtx (matrix)
rowNumber (int)
method remove(mtx, rowNumber)
Namespace types: matrix
Parameters:
mtx (matrix)
rowNumber (int)
method remove(mtx, rowNumber)
Namespace types: matrix
Parameters:
mtx (matrix)
rowNumber (int)
method remove(mtx, rowNumber)
Namespace types: matrix
Parameters:
mtx (matrix)
rowNumber (int)
method remove(mtx, rowNumber)
Namespace types: matrix
Parameters:
mtx (matrix)
rowNumber (int)
method unshift(mtx, row, maxItems)
unshift array of lines to first row of the matrix
Namespace types: matrix
Parameters:
mtx (matrix) : matrix of lines
row (array) : array of lines to be inserted in row
maxItems (simple int)
Returns: resulting matrix of type
method unshift(mtx, row, maxItems)
Namespace types: matrix
Parameters:
mtx (matrix)
row (array)
maxItems (simple int)
method unshift(mtx, row, maxItems)
Namespace types: matrix
Parameters:
mtx (matrix)
row (array)
maxItems (simple int)
method unshift(mtx, row, maxItems)
Namespace types: matrix
Parameters:
mtx (matrix)
row (array)
maxItems (simple int)
method unshift(mtx, row, maxItems)
Namespace types: matrix
Parameters:
mtx (matrix)
row (array)
maxItems (simple int)
method unshift(mtx, row, maxItems)
Namespace types: matrix
Parameters:
mtx (matrix)
row (array)
maxItems (simple int)
method unshift(mtx, row, maxItems)
Namespace types: matrix
Parameters:
mtx (matrix)
row (array)
maxItems (simple int)
method unshift(mtx, row, maxItems)
Namespace types: matrix
Parameters:
mtx (matrix)
row (array)
maxItems (simple int)
method unshift(mtx, row, maxItems)
Namespace types: matrix
Parameters:
mtx (matrix)
row (array)
maxItems (simple int)
method unshift(mtx, row, maxItems)
Namespace types: matrix
Parameters:
mtx (matrix)
row (array)
maxItems (simple int)
method push(mtx, row, maxItems)
push array of lines to end of the matrix row
Namespace types: matrix
Parameters:
mtx (matrix) : matrix of lines
row (array) : array of lines to be inserted in row
maxItems (simple int)
Returns: resulting matrix of lines
method push(mtx, row, maxItems)
Namespace types: matrix
Parameters:
mtx (matrix)
row (array)
maxItems (simple int)
method push(mtx, row, maxItems)
Namespace types: matrix
Parameters:
mtx (matrix)
row (array)
maxItems (simple int)
method push(mtx, row, maxItems)
Namespace types: matrix
Parameters:
mtx (matrix)
row (array)
maxItems (simple int)
method push(mtx, row, maxItems)
Namespace types: matrix
Parameters:
mtx (matrix)
row (array)
maxItems (simple int)
method push(mtx, row, maxItems)
Namespace types: matrix
Parameters:
mtx (matrix)
row (array)
maxItems (simple int)
method push(mtx, row, maxItems)
Namespace types: matrix
Parameters:
mtx (matrix)
row (array)
maxItems (simple int)
method push(mtx, row, maxItems)
Namespace types: matrix
Parameters:
mtx (matrix)
row (array)
maxItems (simple int)
method push(mtx, row, maxItems)
Namespace types: matrix
Parameters:
mtx (matrix)
row (array)
maxItems (simple int)
method push(mtx, row, maxItems)
Namespace types: matrix
Parameters:
mtx (matrix)
row (array)
maxItems (simple int)
method shift(mtx)
shift removes first row from matrix of lines
Namespace types: matrix
Parameters:
mtx (matrix) : matrix of lines from which the shift operation need to be performed
Returns: void
method shift(mtx)
Namespace types: matrix
Parameters:
mtx (matrix)
method shift(mtx)
Namespace types: matrix
Parameters:
mtx (matrix)
method shift(mtx)
Namespace types: matrix
Parameters:
mtx (matrix)
method shift(mtx)
Namespace types: matrix
Parameters:
mtx (matrix)
method shift(mtx)
Namespace types: matrix
Parameters:
mtx (matrix)
method shift(mtx)
Namespace types: matrix
Parameters:
mtx (matrix)
method shift(mtx)
Namespace types: matrix
Parameters:
mtx (matrix)
method shift(mtx)
Namespace types: matrix
Parameters:
mtx (matrix)
method shift(mtx)
Namespace types: matrix
Parameters:
mtx (matrix)
method rshift(mtx)
rshift removes first row from matrix of lines and returns them as array
Namespace types: matrix
Parameters:
mtx (matrix) : matrix of lines from which the rshift operation need to be performed
Returns: type
method rshift(mtx)
Namespace types: matrix
Parameters:
mtx (matrix)
method rshift(mtx)
Namespace types: matrix
Parameters:
mtx (matrix)
method rshift(mtx)
Namespace types: matrix
Parameters:
mtx (matrix)
method rshift(mtx)
Namespace types: matrix
Parameters:
mtx (matrix)
method rshift(mtx)
Namespace types: matrix
Parameters:
mtx (matrix)
method rshift(mtx)
Namespace types: matrix
Parameters:
mtx (matrix)
method rshift(mtx)
Namespace types: matrix
Parameters:
mtx (matrix)
method rshift(mtx)
Namespace types: matrix
Parameters:
mtx (matrix)
method rshift(mtx)
Namespace types: matrix
Parameters:
mtx (matrix)
method pop(mtx)
pop removes last row from matrix of lines
Namespace types: matrix
Parameters:
mtx (matrix) : matrix of lines from which the pop operation need to be performed
Returns: void
method pop(mtx)
Namespace types: matrix
Parameters:
mtx (matrix)
method pop(mtx)
Namespace types: matrix
Parameters:
mtx (matrix)
method pop(mtx)
Namespace types: matrix
Parameters:
mtx (matrix)
method pop(mtx)
Namespace types: matrix
Parameters:
mtx (matrix)
method pop(mtx)
Namespace types: matrix
Parameters:
mtx (matrix)
method pop(mtx)
Namespace types: matrix
Parameters:
mtx (matrix)
method pop(mtx)
Namespace types: matrix
Parameters:
mtx (matrix)
method pop(mtx)
Namespace types: matrix
Parameters:
mtx (matrix)
method pop(mtx)
Namespace types: matrix
Parameters:
mtx (matrix)
method rpop(mtx)
rpop removes last row from matrix of lines and reutnrs the array to caller
Namespace types: matrix
Parameters:
mtx (matrix) : matrix of lines from which the rpop operation need to be performed
Returns: void
method rpop(mtx)
Namespace types: matrix
Parameters:
mtx (matrix)
method rpop(mtx)
Namespace types: matrix
Parameters:
mtx (matrix)
method rpop(mtx)
Namespace types: matrix
Parameters:
mtx (matrix)
method rpop(mtx)
Namespace types: matrix
Parameters:
mtx (matrix)
method rpop(mtx)
Namespace types: matrix
Parameters:
mtx (matrix)
method rpop(mtx)
Namespace types: matrix
Parameters:
mtx (matrix)
method rpop(mtx)
Namespace types: matrix
Parameters:
mtx (matrix)
method rpop(mtx)
Namespace types: matrix
Parameters:
mtx (matrix)
method rpop(mtx)
Namespace types: matrix
Parameters:
mtx (matrix)
method clear(mtx)
clear clears the matrix
Namespace types: matrix
Parameters:
mtx (matrix) : matrix of lines which needs to be cleared
Returns: void
method clear(mtx)
Namespace types: matrix
Parameters:
mtx (matrix)
method clear(mtx)
Namespace types: matrix
Parameters:
mtx (matrix)
method clear(mtx)
Namespace types: matrix
Parameters:
mtx (matrix)
method clear(mtx)
Namespace types: matrix
Parameters:
mtx (matrix)
method clear(mtx)
Namespace types: matrix
Parameters:
mtx (matrix)
method clear(mtx)
Namespace types: matrix
Parameters:
mtx (matrix)
method clear(mtx)
Namespace types: matrix
Parameters:
mtx (matrix)
method clear(mtx)
Namespace types: matrix
Parameters:
mtx (matrix)
method clear(mtx)
Namespace types: matrix
Parameters:
mtx (matrix)
method flush(mtx)
clear clears the matrix but retains the drawing objects
Namespace types: matrix
Parameters:
mtx (matrix) : matrix of lines which needs to be cleared
Returns: void
method flush(mtx)
Namespace types: matrix
Parameters:
mtx (matrix)
method flush(mtx)
Namespace types: matrix
Parameters:
mtx (matrix)
method flush(mtx)
Namespace types: matrix
Parameters:
mtx (matrix)
method flush(mtx)
Namespace types: matrix
Parameters:
mtx (matrix)
method flush(mtx)
Namespace types: matrix
Parameters:
mtx (matrix)
method flush(mtx)
Namespace types: matrix
Parameters:
mtx (matrix)
method flush(mtx)
Namespace types: matrix
Parameters:
mtx (matrix)
method flush(mtx)
Namespace types: matrix
Parameters:
mtx (matrix)
method flush(mtx)
Namespace types: matrix
Parameters:
mtx (matrix)
PaddingThe Padding library is a comprehensive and flexible toolkit designed to extend time series data within TradingView, making it an indispensable resource for advanced signal processing tasks such as FFT, filtering, convolution, and wavelet analysis. At its core, the library addresses the common challenge of edge effects by "padding" your data—that is, by appending additional data points beyond the natural boundaries of your original dataset. This extension not only mitigates the distortions that can occur at the endpoints but also helps to maintain the integrity of various transformations and calculations performed on the series. The library accomplishes this while preserving the ordering of your data, ensuring that the most recent point always resides at index 0.
Central to the functionality of this library are two key enumerations: Direction and PaddingType. The Direction enum determines where the padding will be applied. You can choose to extend the data in the forward direction (ahead of the current values), in the backward direction (behind the current values), or in both directions simultaneously. The PaddingType enum defines the specific method used for extending the data. The library supports several methods—including symmetric, reflect, periodic, antisymmetric, antireflect, smooth, constant, and zero padding—each of which has been implemented to suit different analytical scenarios. For instance, symmetric padding mirrors the original data across its boundaries, while reflect padding continues the trend by reflecting around endpoint values. Periodic padding repeats the data, and antisymmetric padding mirrors the data with alternating signs to counterbalance it. The antireflect and smooth methods take into account the derivatives of your data, thereby extending the series in a way that preserves or smoothly continues these derivative values. Constant and zero padding simply extend the series using fixed endpoint values or zeros. Together, these enums allow you to fine-tune how your data is extended, ensuring that the padding method aligns with the specific requirements of your analysis.
The library is designed to work with both single variable inputs and array inputs. When using array-based methods—particularly with the antireflect and smooth padding types—please note that the implementation intentionally discards the last data point as a result of the delta computation process. This behavior is an important consideration when integrating the library into your TradingView studies, as it affects the overall data length of the padded series. Despite this, the library’s structure and documentation make it straightforward to incorporate into your existing scripts. You simply provide your data source, define the length of your data window, and select the desired padding type and direction, along with any optional parameters to control the extent of the padding (using both_period, forward_period, or backward_period).
In practical application, the Padding library enables you to extend historical data beyond its original range in a controlled and predictable manner. This is particularly useful when preparing datasets for further signal processing, as it helps to reduce artifacts that can otherwise compromise the results of your analytical routines. Whether you are an experienced Pine Script developer or a trader exploring advanced data analysis techniques, this library offers a robust solution that enhances the reliability and accuracy of your studies by ensuring your algorithms operate on a more complete and well-prepared dataset.
Library "Padding"
A comprehensive library for padding time series data with various methods. Supports both single variable and array inputs, with flexible padding directions and periods. Designed for signal processing applications including FFT, filtering, convolution, and wavelets. All methods maintain data ordering with most recent point at index 0.
symmetric(source, series_length, direction, both_period, forward_period, backward_period)
Applies symmetric padding by mirroring the input data across boundaries
Parameters:
source (float) : Input value to pad from
series_length (int) : Length of the data window
direction (series Direction) : Direction to apply padding
both_period (int) : Optional - periods to pad in both directions. Overrides forward_period and backward_period if specified
forward_period (int) : Optional - periods to pad forward. Defaults to series_length if not specified
backward_period (int) : Optional - periods to pad backward. Defaults to series_length if not specified
Returns: Array ordered with most recent point at index 0, containing original data with symmetric padding applied
method symmetric(source, direction, both_period, forward_period, backward_period)
Applies symmetric padding to an array by mirroring the data across boundaries
Namespace types: array
Parameters:
source (array) : Array of values to pad
direction (series Direction) : Direction to apply padding
both_period (int) : Optional - periods to pad in both directions. Overrides forward_period and backward_period if specified
forward_period (int) : Optional - periods to pad forward. Defaults to array length if not specified
backward_period (int) : Optional - periods to pad backward. Defaults to array length if not specified
Returns: Array ordered with most recent point at index 0, containing original data with symmetric padding applied
reflect(source, series_length, direction, both_period, forward_period, backward_period)
Applies reflect padding by continuing trends through reflection around endpoint values
Parameters:
source (float) : Input value to pad from
series_length (int) : Length of the data window
direction (series Direction) : Direction to apply padding
both_period (int) : Optional - periods to pad in both directions. Overrides forward_period and backward_period if specified
forward_period (int) : Optional - periods to pad forward. Defaults to series_length if not specified
backward_period (int) : Optional - periods to pad backward. Defaults to series_length if not specified
Returns: Array ordered with most recent point at index 0, containing original data with reflect padding applied
method reflect(source, direction, both_period, forward_period, backward_period)
Applies reflect padding to an array by continuing trends through reflection around endpoint values
Namespace types: array
Parameters:
source (array) : Array of values to pad
direction (series Direction) : Direction to apply padding
both_period (int) : Optional - periods to pad in both directions. Overrides forward_period and backward_period if specified
forward_period (int) : Optional - periods to pad forward. Defaults to array length if not specified
backward_period (int) : Optional - periods to pad backward. Defaults to array length if not specified
Returns: Array ordered with most recent point at index 0, containing original data with reflect padding applied
periodic(source, series_length, direction, both_period, forward_period, backward_period)
Applies periodic padding by repeating the input data
Parameters:
source (float) : Input value to pad from
series_length (int) : Length of the data window
direction (series Direction) : Direction to apply padding
both_period (int) : Optional - periods to pad in both directions. Overrides forward_period and backward_period if specified
forward_period (int) : Optional - periods to pad forward. Defaults to series_length if not specified
backward_period (int) : Optional - periods to pad backward. Defaults to series_length if not specified
Returns: Array ordered with most recent point at index 0, containing original data with periodic padding applied
method periodic(source, direction, both_period, forward_period, backward_period)
Applies periodic padding to an array by repeating the data
Namespace types: array
Parameters:
source (array) : Array of values to pad
direction (series Direction) : Direction to apply padding
both_period (int) : Optional - periods to pad in both directions. Overrides forward_period and backward_period if specified
forward_period (int) : Optional - periods to pad forward. Defaults to array length if not specified
backward_period (int) : Optional - periods to pad backward. Defaults to array length if not specified
Returns: Array ordered with most recent point at index 0, containing original data with periodic padding applied
antisymmetric(source, series_length, direction, both_period, forward_period, backward_period)
Applies antisymmetric padding by mirroring data and alternating signs
Parameters:
source (float) : Input value to pad from
series_length (int) : Length of the data window
direction (series Direction) : Direction to apply padding
both_period (int) : Optional - periods to pad in both directions. Overrides forward_period and backward_period if specified
forward_period (int) : Optional - periods to pad forward. Defaults to series_length if not specified
backward_period (int) : Optional - periods to pad backward. Defaults to series_length if not specified
Returns: Array ordered with most recent point at index 0, containing original data with antisymmetric padding applied
method antisymmetric(source, direction, both_period, forward_period, backward_period)
Applies antisymmetric padding to an array by mirroring data and alternating signs
Namespace types: array
Parameters:
source (array) : Array of values to pad
direction (series Direction) : Direction to apply padding
both_period (int) : Optional - periods to pad in both directions. Overrides forward_period and backward_period if specified
forward_period (int) : Optional - periods to pad forward. Defaults to array length if not specified
backward_period (int) : Optional - periods to pad backward. Defaults to array length if not specified
Returns: Array ordered with most recent point at index 0, containing original data with antisymmetric padding applied
antireflect(source, series_length, direction, both_period, forward_period, backward_period)
Applies antireflect padding by reflecting around endpoints while preserving derivatives
Parameters:
source (float) : Input value to pad from
series_length (int) : Length of the data window
direction (series Direction) : Direction to apply padding
both_period (int) : Optional - periods to pad in both directions. Overrides forward_period and backward_period if specified
forward_period (int) : Optional - periods to pad forward. Defaults to series_length if not specified
backward_period (int) : Optional - periods to pad backward. Defaults to series_length if not specified
Returns: Array ordered with most recent point at index 0, containing original data with antireflect padding applied
method antireflect(source, direction, both_period, forward_period, backward_period)
Applies antireflect padding to an array by reflecting around endpoints while preserving derivatives
Namespace types: array
Parameters:
source (array) : Array of values to pad
direction (series Direction) : Direction to apply padding
both_period (int) : Optional - periods to pad in both directions. Overrides forward_period and backward_period if specified
forward_period (int) : Optional - periods to pad forward. Defaults to array length if not specified
backward_period (int) : Optional - periods to pad backward. Defaults to array length if not specified
Returns: Array ordered with most recent point at index 0, containing original data with antireflect padding applied. Note: Last data point is lost when using array input
smooth(source, series_length, direction, both_period, forward_period, backward_period)
Applies smooth padding by extending with constant derivatives from endpoints
Parameters:
source (float) : Input value to pad from
series_length (int) : Length of the data window
direction (series Direction) : Direction to apply padding
both_period (int) : Optional - periods to pad in both directions. Overrides forward_period and backward_period if specified
forward_period (int) : Optional - periods to pad forward. Defaults to series_length if not specified
backward_period (int) : Optional - periods to pad backward. Defaults to series_length if not specified
Returns: Array ordered with most recent point at index 0, containing original data with smooth padding applied
method smooth(source, direction, both_period, forward_period, backward_period)
Applies smooth padding to an array by extending with constant derivatives from endpoints
Namespace types: array
Parameters:
source (array) : Array of values to pad
direction (series Direction) : Direction to apply padding
both_period (int) : Optional - periods to pad in both directions. Overrides forward_period and backward_period if specified
forward_period (int) : Optional - periods to pad forward. Defaults to array length if not specified
backward_period (int) : Optional - periods to pad backward. Defaults to array length if not specified
Returns: Array ordered with most recent point at index 0, containing original data with smooth padding applied. Note: Last data point is lost when using array input
constant(source, series_length, direction, both_period, forward_period, backward_period)
Applies constant padding by extending endpoint values
Parameters:
source (float) : Input value to pad from
series_length (int) : Length of the data window
direction (series Direction) : Direction to apply padding
both_period (int) : Optional - periods to pad in both directions. Overrides forward_period and backward_period if specified
forward_period (int) : Optional - periods to pad forward. Defaults to series_length if not specified
backward_period (int) : Optional - periods to pad backward. Defaults to series_length if not specified
Returns: Array ordered with most recent point at index 0, containing original data with constant padding applied
method constant(source, direction, both_period, forward_period, backward_period)
Applies constant padding to an array by extending endpoint values
Namespace types: array
Parameters:
source (array) : Array of values to pad
direction (series Direction) : Direction to apply padding
both_period (int) : Optional - periods to pad in both directions. Overrides forward_period and backward_period if specified
forward_period (int) : Optional - periods to pad forward. Defaults to array length if not specified
backward_period (int) : Optional - periods to pad backward. Defaults to array length if not specified
Returns: Array ordered with most recent point at index 0, containing original data with constant padding applied
zero(source, series_length, direction, both_period, forward_period, backward_period)
Applies zero padding by extending with zeros
Parameters:
source (float) : Input value to pad from
series_length (int) : Length of the data window
direction (series Direction) : Direction to apply padding
both_period (int) : Optional - periods to pad in both directions. Overrides forward_period and backward_period if specified
forward_period (int) : Optional - periods to pad forward. Defaults to series_length if not specified
backward_period (int) : Optional - periods to pad backward. Defaults to series_length if not specified
Returns: Array ordered with most recent point at index 0, containing original data with zero padding applied
method zero(source, direction, both_period, forward_period, backward_period)
Applies zero padding to an array by extending with zeros
Namespace types: array
Parameters:
source (array) : Array of values to pad
direction (series Direction) : Direction to apply padding
both_period (int) : Optional - periods to pad in both directions. Overrides forward_period and backward_period if specified
forward_period (int) : Optional - periods to pad forward. Defaults to array length if not specified
backward_period (int) : Optional - periods to pad backward. Defaults to array length if not specified
Returns: Array ordered with most recent point at index 0, containing original data with zero padding applied
pad_data(source, series_length, padding_type, direction, both_period, forward_period, backward_period)
Generic padding function that applies specified padding type to input data
Parameters:
source (float) : Input value to pad from
series_length (int) : Length of the data window
padding_type (series PaddingType) : Type of padding to apply (see PaddingType enum)
direction (series Direction) : Direction to apply padding
both_period (int) : Optional - periods to pad in both directions. Overrides forward_period and backward_period if specified
forward_period (int) : Optional - periods to pad forward. Defaults to series_length if not specified
backward_period (int) : Optional - periods to pad backward. Defaults to series_length if not specified
Returns: Array ordered with most recent point at index 0, containing original data with specified padding applied
method pad_data(source, padding_type, direction, both_period, forward_period, backward_period)
Generic padding function that applies specified padding type to array input
Namespace types: array
Parameters:
source (array) : Array of values to pad
padding_type (series PaddingType) : Type of padding to apply (see PaddingType enum)
direction (series Direction) : Direction to apply padding
both_period (int) : Optional - periods to pad in both directions. Overrides forward_period and backward_period if specified
forward_period (int) : Optional - periods to pad forward. Defaults to array length if not specified
backward_period (int) : Optional - periods to pad backward. Defaults to array length if not specified
Returns: Array ordered with most recent point at index 0, containing original data with specified padding applied. Note: Last data point is lost when using antireflect or smooth padding types
make_padded_data(source, series_length, padding_type, direction, both_period, forward_period, backward_period)
Creates a window-based padded data series that updates with each new value. WARNING: Function must be called on every bar for consistency. Do not use in scopes where it may not execute on every bar.
Parameters:
source (float) : Input value to pad from
series_length (int) : Length of the data window
padding_type (series PaddingType) : Type of padding to apply (see PaddingType enum)
direction (series Direction) : Direction to apply padding
both_period (int) : Optional - periods to pad in both directions. Overrides forward_period and backward_period if specified
forward_period (int) : Optional - periods to pad forward. Defaults to series_length if not specified
backward_period (int) : Optional - periods to pad backward. Defaults to series_length if not specified
Returns: Array ordered with most recent point at index 0, containing windowed data with specified padding applied
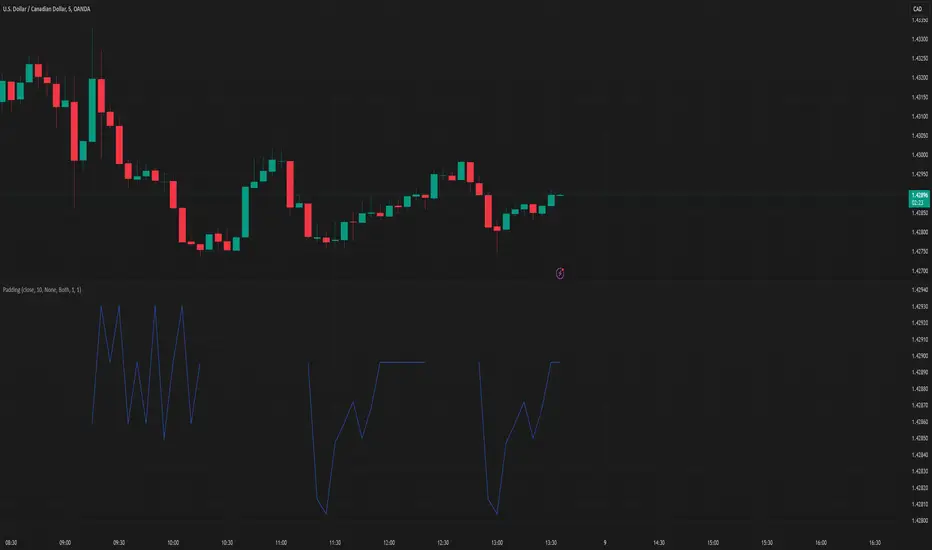
UtilityLibraryLibrary "UtilityLibrary"
A collection of custom utility functions used in my scripts.
milliseconds_per_bar()
Gets the number of milliseconds per bar.
Returns: (int) The number of milliseconds per bar.
realtime()
Checks if the current bar is the actual realtime bar.
Returns: (bool) `true` when the current bar is the actual realtime bar, `false` otherwise.
replay()
Checks if the current bar is the last replay bar.
Returns: (bool) `true` when the current bar is the last replay bar, `false` otherwise.
bar_elapsed()
Checks how much of the current bar has elapsed.
Returns: (float) Between 0 and 1.
even(number)
Checks if a number is even.
Parameters:
number (float) : (float) The number to evaluate.
Returns: (bool) `true` when the number is even, `false` when the number is odd.
sign(number)
Gets the sign of a float.
Parameters:
number (float) : (float) The number to evaluate.
Returns: (int) 1 or -1, unlike math.sign() which returns 0 if the number is 0.
atan2(y, x)
Derives an angle in radians from the XY coordinate.
Parameters:
y (float) : (float) Y coordinate.
x (float) : (float) X coordinate.
Returns: (float) Between -π and π.
clamp(number, min, max)
Ensures a value is between the `min` and `max` thresholds.
Parameters:
number (float) : (float) The number to clamp.
min (float) : (float) The minimum threshold (0 by default).
max (float) : (float) The maximum threshold (1 by default).
Returns: (float) Between `min` and `max`.
remove_gamma(value)
Removes gamma from normalized sRGB channel values.
Parameters:
value (float) : (float) The normalized channel value .
Returns: (float) Channel value with gamma removed.
add_gama(value)
Adds gamma into normalized linear RGB channel values.
Parameters:
value (float) : (float) The normalized channel value .
Returns: (float) Channel value with gamma added.
rgb_to_xyz(Color)
Extracts XYZ-D65 channels from sRGB colors.
Parameters:
Color (color) : (color) The sRGB color to process.
Returns: (float tuple)
xyz_to_rgb(x, y, z)
Converts XYZ-D65 channels to sRGB channels.
Parameters:
x (float) : (float) The X channel value.
y (float) : (float) The Y channel value.
z (float) : (float) The Z channel value.
Returns: (int tuple)
rgb_to_oklab(Color)
Extracts OKLAB-D65 channels from sRGB colors.
Parameters:
Color (color) : (color) The sRGB color to process.
Returns: (float tuple)
oklab_to_rgb(l, a, b)
Converts OKLAB-D65 channels to sRGB channels.
Parameters:
l (float) : (float) The L channel value.
a (float) : (float) The A channel value.
b (float) : (float) The B channel value.
Returns: (int tuple)
rgb_to_oklch(Color)
Extracts OKLCH channels from sRGB colors.
Parameters:
Color (color) : (color) The sRGB color to process.
Returns: (float tuple)
oklch_to_rgb(l, c, h)
Converts OKLCH channels to sRGB channels.
Parameters:
l (float) : (float) The L channel value.
c (float) : (float) The C channel value.
h (float) : (float) The H channel value.
Returns: (float tuple)
hues(l1, h1, l2, h2, dist)
Ensures the hue angles are set correctly for linearly interpolating OKLCH.
Parameters:
l1 (float) : (float) The first L channel value.
h1 (float) : (float) The first H channel value.
l2 (float) : (float) The second L channel value.
h2 (float) : (float) The second H channel value.
dist (string) : (string) The preferred angular distance to use. Options: `min` or `max` (`min` by default).
Returns: (float tuple)
lerp(a, b, t)
Linearly interpolates between two values.
Parameters:
a (float) : (float) The starting point (first value).
b (float) : (float) The ending point (second value).
t (float) : (float) The interpolation factor .
Returns: (float) Between `a` and `b`.
smoothstep(t, precise)
A non-linear (smooth) interpolation between 0 and 1.
Parameters:
t (float) : (float) The interpolation factor .
precise (bool) : (bool) Sets if the calc should be precise or efficient (`true` by default).
Returns: (float) Between 0 and 1.
ease(t, n, v, x1, y1, x2, y2)
A customizable non-linear interpolation between 0 and 1.
Parameters:
t (float) : (float) The interpolation factor .
n (float) : (float) The degree of ease (1 by default).
v (string) : (string) The easing variant type: `in-out`, `in`, or `out` (`in-out` by default).
x1 (float) : (float) Optional X coordinate of starting point (0 by default).
y1 (float) : (float) Optional Y coordinate of starting point (0 by default).
x2 (float) : (float) Optional X coordinate of ending point (1 by default).
y2 (float) : (float) Optional Y coordinate of ending point (1 by default).
Returns: (float) Between 0 and 1.
mix(color1, color2, blend, space, dist)
Linearly interpolates between two colors.
Parameters:
color1 (color) : (color) The first color.
color2 (color) : (color) The second color.
blend (float) : (float) The interpolation factor .
space (string) : (string) The color space to use for interpolating. Options: `rgb`, `oklab`, and `oklch` (`rgb` by default).
dist (string) : (string) The anglular distance to use for the hue change when the color space is set to `oklch`. Options: `min` and `max` (`min` by default).
Returns: (color) Blend of `color1` and `color2`.
