Aroon Histogram + CMO [ChuckBanger]This is a combination of Aroon and Chande Momentum Oscillator . I made a histogram of Aroon , aqua line is Chande Momentum and the orange line are a simple moving average of Chande Momentum as a signal line.
One strategy you can use this for is to buy or sell when the signal line crosses the CM line or you can buy and sell when CM line is highest or lowest
You should also study how the indicators work separately:
Aroon Oscillator
www.investopedia.com
Chande Momentum Oscillator
www.investopedia.com
Momentum Indicator (MOM)
Volume ⨃ αMomentum 🦝🦾First attempt playing around with mixing volume and momentum... I find it to be nonsense, but putting it up for the moment.

∆MomentumStratUsing the intersection of momentum and its first DV to predict inflection points in price.

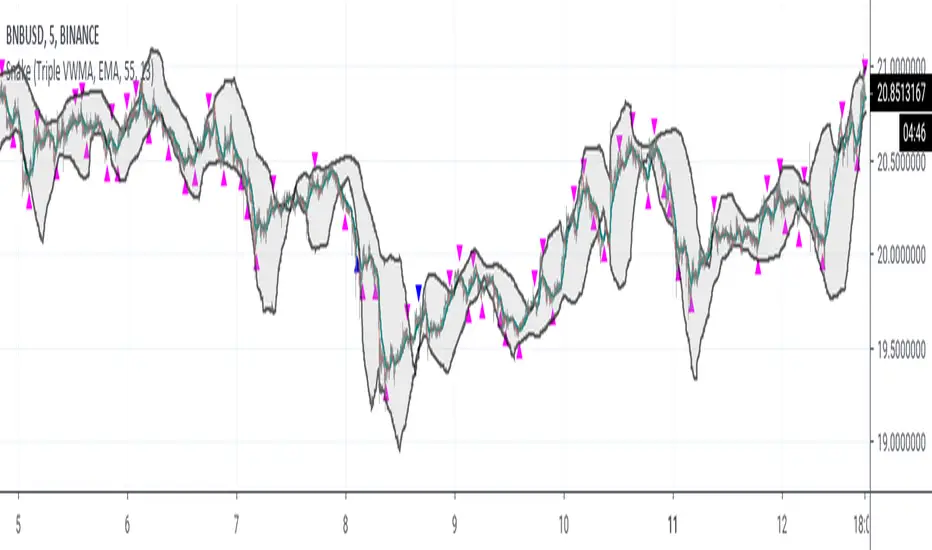
SnakeWhile moving averages are a good way to visualize price action, they are, in general, very poor indicators to trade against. Usually, the lowest prices occur before the cross over of multiple moving averages, while the best profits occur just before the crossunders of the moving averages.
This study captures the buy signals before the cross overs and sells just prior to the cross unders, when prices are lowest and highest respectively.
This is accomplished by treating the moving average as a "snake", specifically looking for the "head" of the snake to turn upwards when buying is most opportunistic. Note the the body must still be trending downward.
For selling, the "snake's head" must be turning down while the body is trending up.
This script uses blue arrows, pointing up, at the bottom, to indicate a buy signal, sending an alert of BUY ASSET.
Blue arrows, point down, at the top, represent sell signals with an alert of SELL ASSET.
The gray bar or strip is momentum. The snake's head must be above momentum for a sell, and below for a buy. This study does NOT work well with stable coins.
The longer the momentum, the more likely weak signals will be weeded out, but also presents less opportunities for buys.
The longer the length of the snake, the more likely cascading down turns will be ignored, but requires a longer trend to identify buy signals.
MomBSThis script is a momemtum buy/sell indicator that works very well on sideways markets, particularly trading stablecoins against each other or against fiat. Trading stablecoins is only profitable when your exchange fees are roughly no more then 0.2%, and is one of the best ways to mitigate risk in your portfolio.
This indicator also works very well on stocks and ETFs on 1 day candlestick charts.
It has clear visual references where buys and sells should take place. Blue arrows underneath, pointing up, are buy signals and and the alert condition of BUY ASSET.
There are also clear references of blue arrows pointing down, above the candlestick , to indicate a sell signal. The alert condition of SELL ASSET.

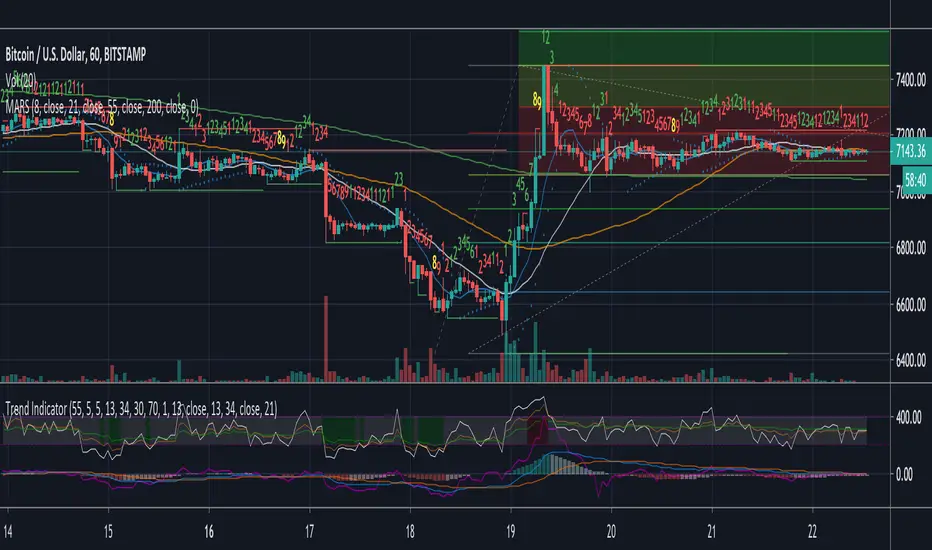
Trend Indicator
A Simple indicator combining 3 of the most popular Oscillators RSI, MacD and Momentum to help see reversals or the continuation of a trend. Designed with the COINBASE:BTCUSD chart in mind but there's not reason it shouldn't work on any other asset.
The indicator has two main parts:
- The gray area at the top between the purple dotted lines is 3 RSI's in one (5, 13, 34) These have been moved up from the RSI's original position to avoid cluttering the MacD and make the lines easier to read. Just like with the regular RSI the lower dotted line indicates oversold and the top dotted line indicates an overbought condition.
To identify this more easily the background changes to green when the middle (13 period) RSI is oversold and red when it's overbought.
*Note* On some very small timeframes the position may need to be adjusted in order to make them easier to see.
This section of the indicator is designed to give early warning signs of markets reversing by the faster white line with confirmation from the orange and green lines.
- The bottom section of the indicator has two parts. The first is a modified MacD which is slightly longer term than the original. This is to act as confirmation or entry/take profit points on divergence or if either of the lines within the MacD crossover or the histogram goes from one color to the other. The histogram is also helpful for trend-following as it lets you gauge if the momentum is gaining or losing strength.
The last part of the indicator is simply a momentum line to indicate in which direction the momentum is heading. It's designed as a confirmation of the other indicators and shouldn't be used on it's own.
All individual indicators that make up the trend indicator have been tweaked slightly to use numbers from the fibonacci sequence rather than the originals.
This indicator is best used in combination with volume and moving averages.
- Look for reversals on low volume near a moving average or key historical point.
- Look for breakouts on high volume if the oscillators line up.
Derivative Oscillator Arrows [Salty]Values above zero are considered bullish, and larger arrows print when the cross over occurs in the bullish area.
Values below zero are considered bearish, and larger arrows print when the cross under occurs in the bearish area.

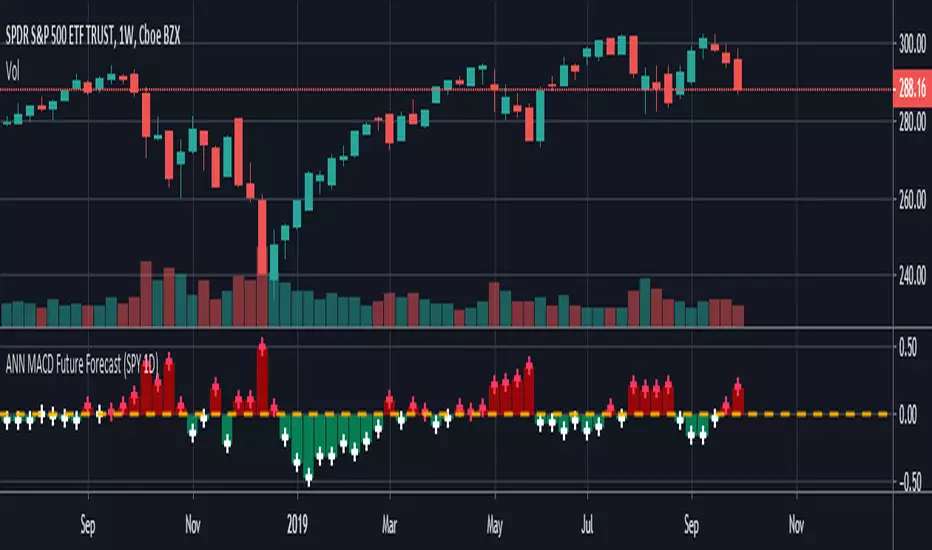
ANN MACD Future Forecast (SPY 1D) NOTE : Deep learning was conducted in a narrow sample set for testing purposes. So this script is Experimental .
This system is based on the following article and is inspired by an external program:
hackernoon.com
None of the artificial neural networks in Tradingview work and are not based on completely correct logic. Unlike others in this system:
IMPORTANT NOTE: If the tangent activation function is used, the input data must also have tangent values (compared to the previous values of 1 bar).
Inputs were prepared according to this judgment.
1. The tangent function which is the activation function is written correctly. (The tangent function in the article: ActivationFunctionTanh (v) => (1 - exp (-2 * v)) / (1 + exp (-2 * v)))
2. Missing bias parts in the formulas were added.
3. The output function is taken from the next day (historical), so that the next bar can be predicted, which is the truth.
4.The forecast value of the next bar is subtracted from the current bar change and the market direction is determined.
5.When the future forecast and the current close are added together, the resulting data is called seed.
The seed carries data both from the present and from yesterday and from the future.
6.And this seed was subjected to the MACD method.
Thus, due to exponential averages, more importance will be given to recent developments and
The acceleration situations will show us the direction.
However, a short position should be taken for crossover and a long position for crossunder .
Because the predicted values work in reverse.Even though we use the same period (9,12,26) it is much faster!
7. There is no future code that can cause Repaint.
However, the color after closing should be checked.
The system is completely correct.
However, a very narrow sample was selected.
100 data: Tangent diffs ; volume change, bollinger bands values changes (Upband , Midband , Lowband) and LazyBear's Squeeze Momentum Indicator (SQZMOM_LB) change and the next bar data (historical) price change were put into the deep learning test.
IMPORTANT NOTE : The larger the sample set and the more effective dependent variables, the higher the hit rate of the deep learning test!
EDIT : This code is open source under the MIT License. If you have any improvements or corrections to suggest, please send me a pull request via the github repository github.com
Stay tuned. Best regards!
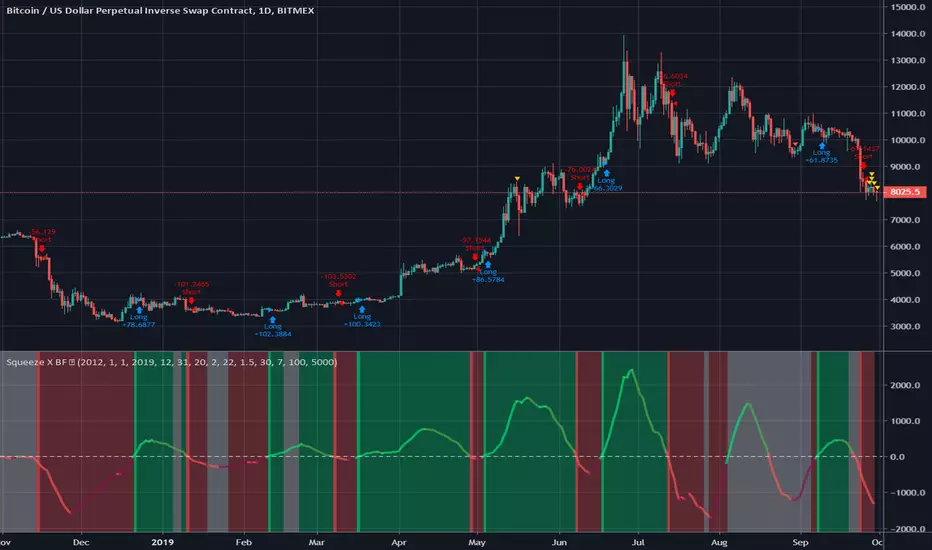
Squeeze X BF 🚀Credit to LazyBear and Kiasaki for code used in this indicator.
Squeeze Momentum indicator illustrates when a momentum squeeze is happening by calculating when Bollinger Bands are within a Keltner Channel.
This simple strategy is based on when the momentum is crossing positive or negative.
INSTRUCTIONS
Green = Long
Red = Short
White = No Trade
derivative oscillator cuMinor modification to Everget's implementation of Constance Brown's Derivative Oscillator.
Toggles for DOSC Columns, Line, Circles
Signal line toggle
Color change
Misc. Comments + Source attribution

Momentum 4 Ways Smoothed [Salty]This is an enhance version of Momentum 4 Ways that shows 4 ways to calculate momentum and display each one along with their combined average value.
This study was created to compare 4 different momentum values against their combined average using different display styles to allow the user to experiment with different views of momentum.
- Added the ability to smooth the Average Momentum value. Default Smoothing value is 5.
- Added the ability to use different average calculations. Default is WMA.
- Added the ability to select the number of momentum values to average (1-4). Default is 4.
- Added the ability to use VWAP instead of price as the input.
The Smoothed Average Momentum line is color coded so that it is green when it is moving in the bullish direction and red when it is moving in the bearish direction.

Function : Know Sure Thing ! (KST)Firstly : Know Sure Thing, or KST , is a momentum oscillator developed by Martin Pring to make rate-of-change readings easier for traders to interpret. In a 1992 Stocks and Commodities article, Mr. Pring referred to the indicator as "Summed Rate of Change ( KST )," but the KST term stuck with technical analysts. The indicator is relatively common among technical analysts preferring momentum oscillators to make decisions.
References : Investopedia (www.investopedia.com )
Let's start :
Simply :
KST : Above point 0 means long position (positive zone), below point 0 (negative zone) means short position.
I liked this indicator more than RSI because we can evaluate the breaking points of the channels we draw on the indicator according to the regions.
Plus area (positive area), breaking the channel upwards may indicate a very strong rise, and minus area (negative area) the channel downwards may indicate a very strong fall.
As a person who is very keen to identify major trends in advance, I like the KST indicator to approach the target quickly and simply. I also find it very successful in terms of divergences.
CAUTION : This indicator has been written before many times on TV. I have no effort on it. I saved loads only for variable periods. But I have enough experience to say that you are successful in trends with KST . Nevertheless, do not use it alone, as other promoters may benefit.
For example , I divided the standard periods into 4 as in the script. With a correct adaptive period, it has the potential to contribute greatly to accurate moves! You can use with mutable variable periods. Abundant trend lines can be drawn on the indicator and divergences between price and indicator can be sought. Best regards!

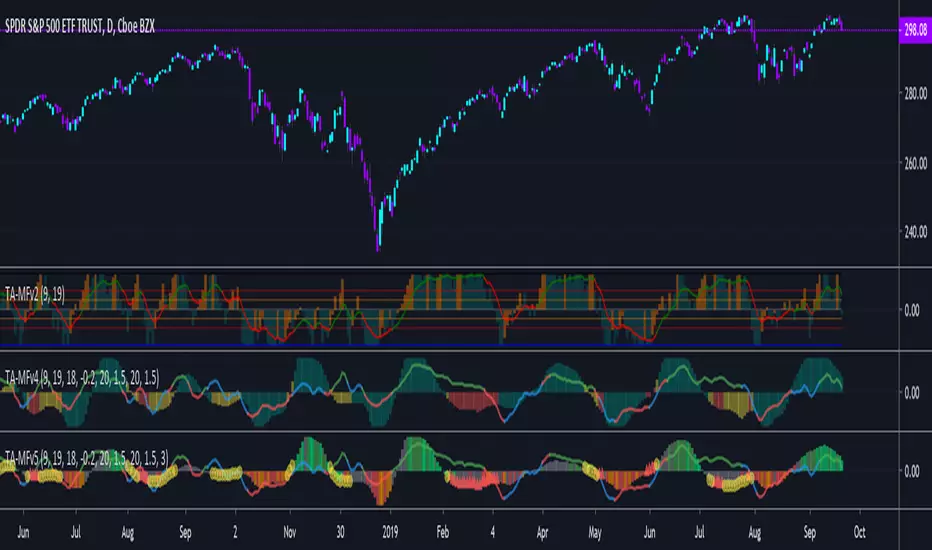
TA-Money Flow-Version5This is the MACD of a stochastic OBV movement indicator, Squeeze Momentum Indicator, and addition coloring for Market Direction Indicator . It is good (right) to work with both price and volume.
In this version we've moved the divergence highlighting to symbols at the ends of the histograms. Same coloring scheme as previous, yellow is divergence of either OBV or SQZ , red is both divergence. In the previous version we added in the "squeeze on - blue" highlighting to show follow through of divergence (or just squeeze/stall). We also added in another old script, but colors so well, Lazybears (Market Direction Indicator, linked below). Also incorporated a 3 color or 5 color scheme from the MDI script as a bool. It works great on any time frame, but you need to have volume data. Not sure where I originally got this (stoch-OBV, somewhere off Tradingview several years ago, thanks to the person who shared), Squeeze/MDI is Lazybear, links below.
Enjoy.
Version 5:
Moved divergence highlighting to symbols on histogram
Added coloring based on MDI
TA-Money-Flow-Version4
TA-Money-Flow-Version3
TA-Money-Flow-Version2
Squeeze-Momentum-Indicator-LazyBear
Market-Direction-Indicator-LazyBear
NCTA Cycle FinderCycle Finder
The NCTA Cycle Finder is one of three technical indicators that are part of the Profit Flow Analytics.
New Cycle Trading and Analytics is a group of traders creating market analytics for traders. The objective is to take complex combinations of multiple technical pattern indicators and present to the trader a simple, single entry signal.
The NCTA Cycle Finder is designed to identify the beginning of new, trending cycles. It is excellent in short 1, 3, and 5 minute timeframes for futures traders and short term options traders. Longer timeframes such as the 5, 10, and 30 minute timeframes work well for options traders.
This indicator consists of a simple, single entry indicator designed to provide an entry very close to the shift on the intra-day cycle. It provides a warning that a cycle shift may be coming by printing a grey bar. Bars above the zero line imply a possible new long cycle developing. Grey bars below the zero line imply a possible new short cycle is developing.
Once the indicator has confirmed a new cycle is developing, a dark blue or red bar will print. Dark blue above the zero line is the trader’s signal to go long. A dark red signal below the zero line is the traders signal to go short. The indicator is designed to filter out false signals and provide the trader with an optimum timing of capturing an entry/exit very close to the beginning / ending of a cycle.
Using the NCTA Cycle Finder, the Profit Flow Oscillator, and Trend Consensus indicators together, offers traders an opportunity to lock in profits and enter the same trending cycle more than one time. This is an excellent opportunity to open trend continuation trades. The NCTA Cycle Finder is excellent when used across more than one timeframe to confirm alignment. For example, monitoring the 5 minute signals and confirming alignment with the 1 minute chart improves the probability of entering a profitable trade.
HOW TO USE: Use the grey bar prints to be ready for a signal and the possible direction. Go long when a blue bar appears and go short when a red bar appears. The print of these signals very closely identify the beginning of a new cycle
The NCTA Cycle Finder, which is part of the Profit Flow Analytics set of indicators, is traded in a live trading room every market day, hosted by our friends at Options Money Maker.
To learn more about the NCTA Cycle Finder and the other two indicators, which are part of Profit Flow Analytics, use the following link:
www.newcycletrading.com
NQZ2019
SP:SPX

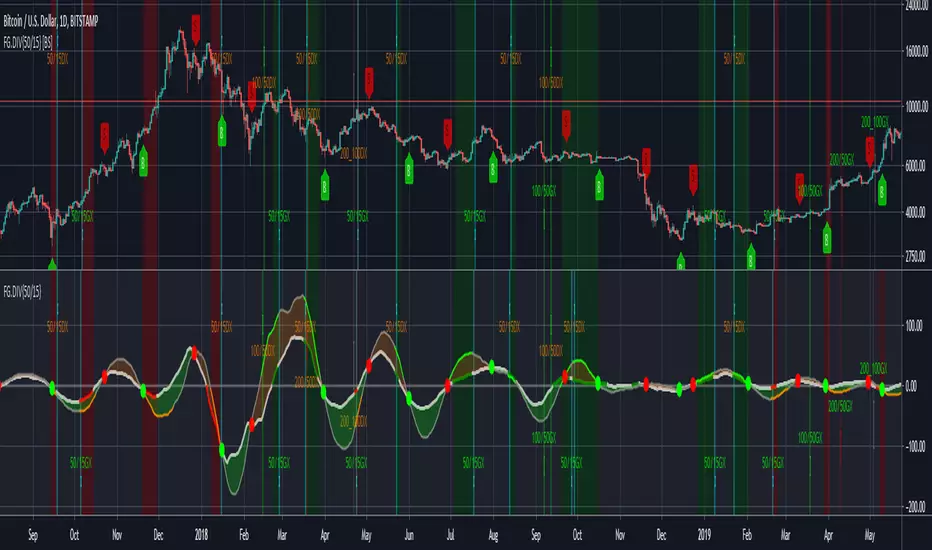
FG-DIVERGENCE V4 {50/15-Series} [Buy/Sell]This script is derived from the FUSIONGAPS V4 {50/15-Series} to generate buy/sell signals.
~ * ~ * ~ * ~ * ~ * ~ * ~ * ~ * ~ * ~ * ~ * ~ * ~ * ~ * ~ * ~ * ~ * ~ * ~ * ~ * ~
Note:
In no way is this intended as a financial/investment/trading advice. You are responsible for your own investment decisions and trades.
Please exercise your own judgement for your own trades base on your own risk-aversion level and goals as an investor or a trader. The use of OTHER indicators and analysis in conjunction (tailored to your own style of investing/trading) will help improve confidence of your analysis, for you to determine your own trade decisions.
~ * ~ * ~ * ~ * ~ * ~ * ~ * ~ * ~ * ~ * ~ * ~ * ~ * ~ * ~ * ~ * ~ * ~ * ~ * ~ * ~
Please check out my other indicators sets and series, e.g.
LIVIDITIUM (dynamic levels),
AEONDRIFT (multi-levels standard deviation bands),
FUSIONGAPS (MA based oscillators),
MAJESTIC (Momentum/Acceleration/Jerk Oscillators),
PRISM (pSAR based oscillator, with RSI/StochRSI as well as Momentum/Acceleration/Jerk indicators),
PDF (parabolic SAR /w HighLow Trends Indicator/Bar-color-marking + Dynamic Fib Retrace and Extension Level)
and more to come.
Constructive feedback and suggestions are welcome.
~ JuniAiko
(=^~^=)v~
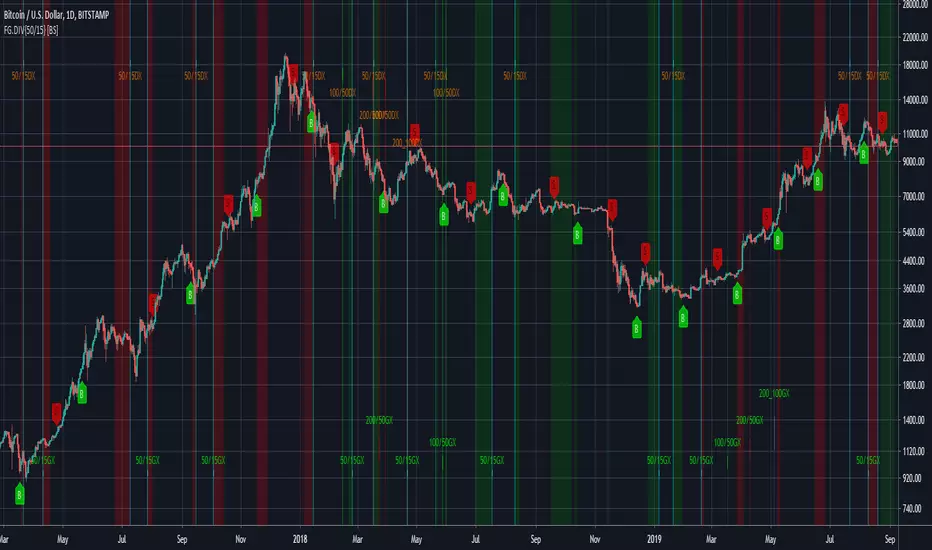
FG-DIVERGENCE V4 {50/15-Series}This script is derived from the FUSIONGAPS V4 {50/15-Series} to generate buy/sell signals.
Green Dot = Buy Signal
Red Dot = Sell Signal
~ * ~ * ~ * ~ * ~ * ~ * ~ * ~ * ~ * ~ * ~ * ~ * ~ * ~ * ~ * ~ * ~ * ~ * ~ * ~ * ~
Note:
In no way is this intended as a financial/investment/trading advice. You are responsible for your own investment decisions and trades.
Please exercise your own judgement for your own trades base on your own risk-aversion level and goals as an investor or a trader. The use of OTHER indicators and analysis in conjunction (tailored to your own style of investing/trading) will help improve confidence of your analysis, for you to determine your own trade decisions.
~ * ~ * ~ * ~ * ~ * ~ * ~ * ~ * ~ * ~ * ~ * ~ * ~ * ~ * ~ * ~ * ~ * ~ * ~ * ~ * ~
Please check out my other indicators sets and series, e.g.
LIVIDITIUM (dynamic levels),
AEONDRIFT (multi-levels standard deviation bands),
FUSIONGAPS (MA based oscillators),
MAJESTIC (Momentum/Acceleration/Jerk Oscillators),
PRISM (pSAR based oscillator, with RSI/StochRSI as well as Momentum/Acceleration/Jerk indicators),
PDF (parabolic SAR /w HighLow Trends Indicator/Bar-color-marking + Dynamic Fib Retrace and Extension Level)
and more to come.
Constructive feedback and suggestions are welcome.
~ JuniAiko
(=^~^=)v~
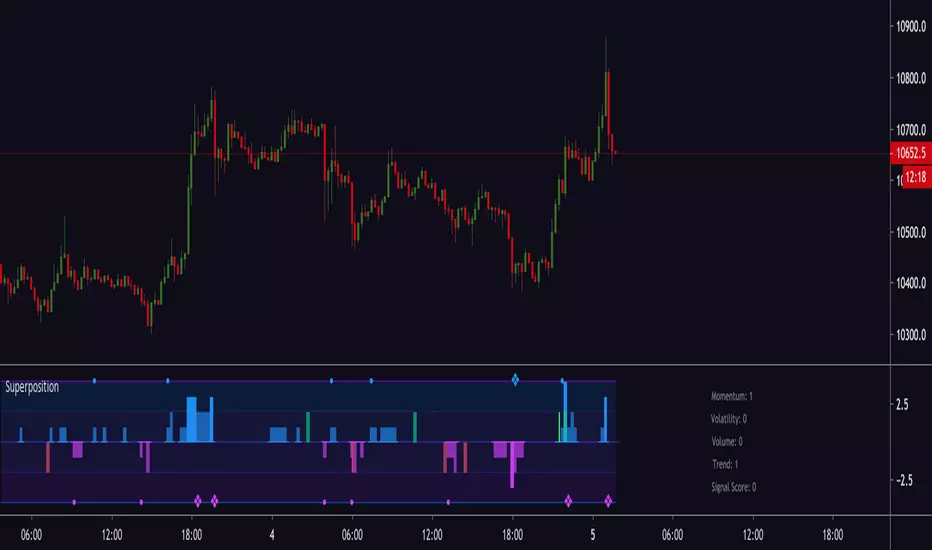
Magick SuperpositionExperimental histogram based on multi indicator signals.
Generates a score based on:
Trend
Volatility
Momentum
Price and volume changes
Candlestick patterns
and many more.
Can be used to detect top and bottoms, reversals, trend, best moments to enter a trade and more.
Invite-only.
Trial available.
CoinExpert OscillatorCombined Oscillator with amazingly accurate Buy/Sell signals and alerts.
Includes warnings for possible tops, possible bottoms , etc.
Also contains many perfectly refined indicator s ( VWAP , MFI, MOM, EMA distance) that help serve making the right decisions .
Combined with CoinExpert Overlay and CoinExpert Trend it is possibly the best trading tool up to now .
This is not an indicator, this is a WINdicator!
For access and prices, add me on Discord, Amnesio#0001 or message me here, on Tradingview.

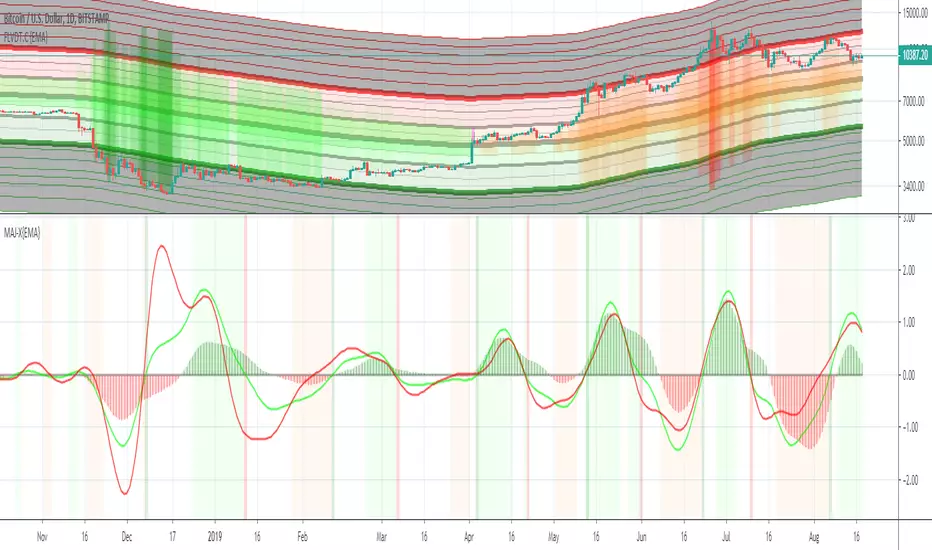
MAJESTIC-X {EMA}The MAJESTIC (MAJ) is a set of M omentum/ A cceleration/ J erk oscillators.
This "X" edition comes with optimized time-frames to be used as a companion with the Fast LIVIDITIUM Channel (FLVDT.C).
The option to switch to custom time-frames is also available in this version.
The filled-histogram is the Momentum oscillator
The lime colored line is the Acceleration oscillator
The red colored line is the Jerk oscillator
The analysis candles-range have been optimized for the following time-frames:
monthly (1M) = 1
3W = 1
2W = 2
weekly (1W) = 4
5D = 6
4D = 8
3D = 10
2D = 15
daily (1D) = 30
240 hr = 80
Note: In no way is the MAJESTIC oscillator intended as a financial/investment/trading advice. You are responsible for your own investment decisions and trades.
Please exercise your own judgement for your own trades base on your own risk-aversion level and goals as an investor or a trader. The use of OTHER indicators and analysis in conjunction (tailored to your own style of investing/trading) will help improve confidence of your analysis, for you to determine your own trade decisions.
~JuniAiko
(=^~^=)v~
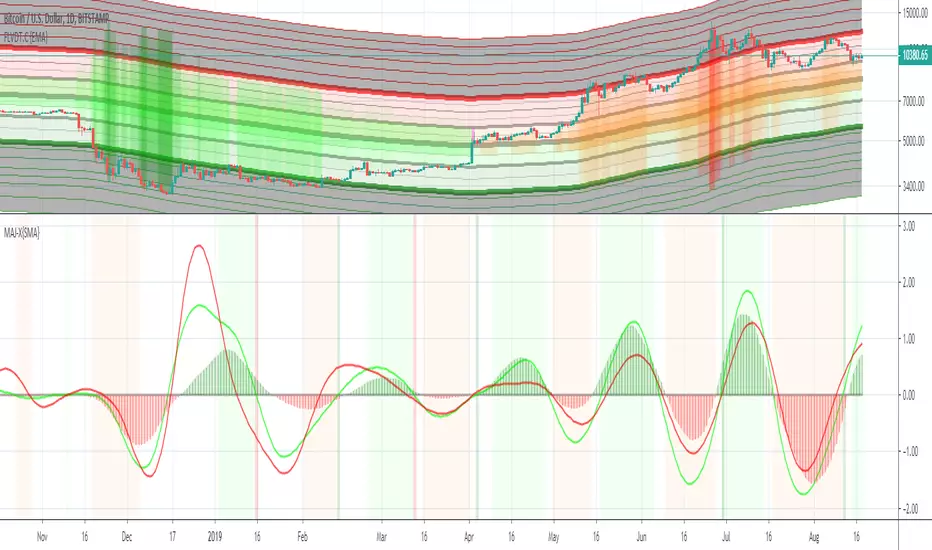
MAJESTIC-X {SMA}The MAJESTIC (MAJ) is a set of M omentum/ A cceleration/ J erk oscillators.
This "X" edition comes with optimized time-frames to be used as a companion with the Fast LIVIDITIUM Channel (FLVDT.C).
The option to switch to custom time-frames is also available in this version.
The filled-histogram is the Momentum oscillator
The lime colored line is the Acceleration oscillator
The red colored line is the Jerk oscillator
The analysis candles-range have been optimized for the following time-frames:
monthly (1M) = 1
3W = 1
2W = 2
weekly (1W) = 4
5D = 6
4D = 8
3D = 10
2D = 15
daily (1D) = 30
240 hr = 80
Note: In no way is the MAJESTIC oscillator intended as a financial/investment/trading advice. You are responsible for your own investment decisions and trades.
Please exercise your own judgement for your own trades base on your own risk-aversion level and goals as an investor or a trader. The use of OTHER indicators and analysis in conjunction (tailored to your own style of investing/trading) will help improve confidence of your analysis, for you to determine your own trade decisions.
~JuniAiko
(=^~^=)v~
Momentum 4 Ways [Salty]This script provides the ability to see 4 momentum values at once and a combined average of all 4 values. The user can see how fast momentum values are affecting the slow momentum values when all values are combined. Also, if the combined average value is greater than zero then momentum is considered bullish. Otherwise, values below zero are considered bearish.

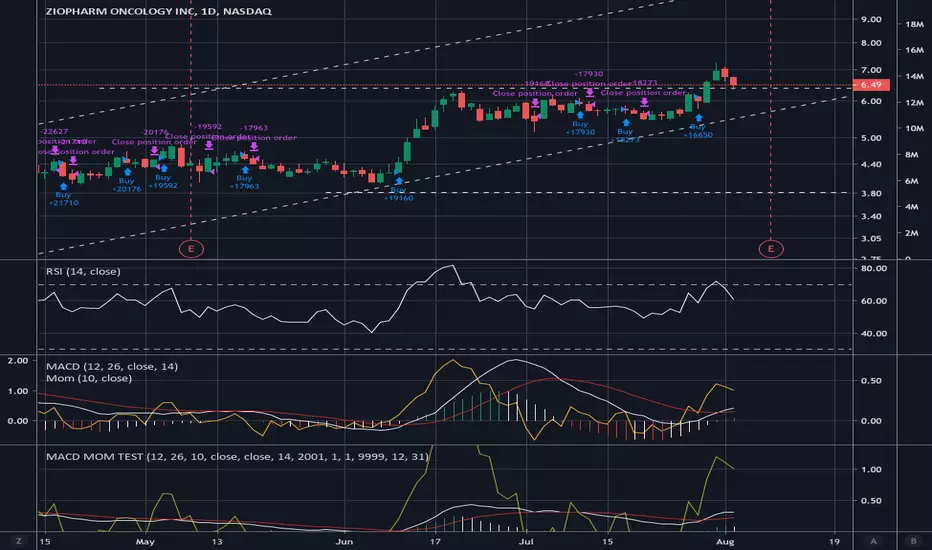
MACD MOMENTUM STRATEGYHey,
First of I'm not so familiar with Pine Editor, yet.
But a do need some help with a trick thing I*ve been working on.
As you can see I*ve merge the MACD and the MOMENTUM indicators in the same "chart" this have been working pretty well for me as a trading strategy. But now a chat tho create a real strategy with Pine Editor based on the same data. The thing is that I can't seem tho get the MOMENTUM indicator to and the MACD indicator in the same (different) scale in my strategy as when I merge them.
I suspect this got something to do with my chose of source för the MOMENTUM indicator, but I'm not 100.
I would be grateful for all kinds of feedback and tips for a solutions on this.
Thanks.