Market Structure Confluence [AlgoAlpha]OVERVIEW
This script is called "Market Structure Confluence" and it combines classic market structure analysis with a dynamic volatility-based band system to detect shifts in trend and momentum more reliably. It tracks key swing points (higher highs, higher lows, lower highs, lower lows) to define the trend, then overlays a basis and ATR-smoothed volatility bands to catch rejection signals and highlight potential inflection points in the market.
CONCEPTS
Market structure is the foundation of price action trading, focusing on the relationship between successive highs and lows to understand trend conditions. Break of Structure (BOS) and Change of Character (CHoCH) events are important because they signal when a market might be shifting direction. This script enhances traditional structure by integrating volatility bands, which act like dynamic support/resistance zones based on ATR, allowing it to capture momentum surges and rejections beyond just structural shifts.
FEATURES
Swing Detection: It detects and labels Higher Highs (HH), Higher Lows (HL), Lower Highs (LH), and Lower Lows (LL) based on user-defined time horizons, helping traders quickly spot the trend direction.
BOS and CHoCH Lines: When a previous swing point is broken, the script automatically plots a Break of Structure (BOS) line. If the break represents a major trend reversal (a CHoCH), it is marked differently to separate simple breakouts from real trend changes.
Rejection Signals: Special arrows plot when price pierces a band and then pulls back, suggesting a potential trap move or rejection signal in the direction of the new structure.
Alerts: Built-in alerts for structure breaks, CHoCHs, swing points, rejections at bands, and trend flips make it easy to automate setups without manually watching the chart.
USAGE
Set your preferred swing detection size depending on your timeframe and trading style — smaller numbers for intraday, larger numbers for swing trading. Choose whether you want BOS/CHoCH confirmed by candle closes or by wick breaks. Use the volatility band settings to fine-tune how tightly or loosely the bands hug the price, adjusting sensitivity based on market conditions. When a BOS or CHoCH occurs, or when a rejection happens at the bands, the script will highlight it clearly and optionally trigger alerts. Watch for combinations where both structure breaks and volatility band rejections happen together — those are high-quality trade signals. This setup works best when used with basic trend filtering and higher timeframe confirmation.
Indicators and strategies

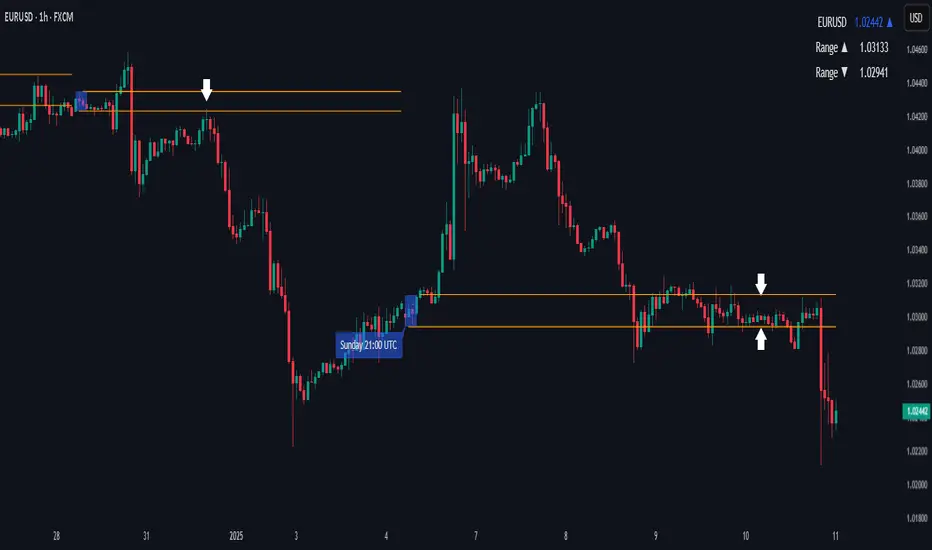
Weekly Open Range [BigBeluga]
A precision weekly range tracker that captures early market positioning from the first moments of the trading week.
By dynamically measuring the highest and lowest points from the first three candles after the Sunday 21:00 UTC open, the indicator builds a reactive support and resistance framework for the week ahead.
It also visualizes the active range with a dynamic box and provides live updates of the current price movement against the established range boundaries.
🔵 KEY FEATURES
Automatically marks the weekly open range starting at Sunday 21:00 UTC .
Identify maximum high and minimum low from the first 3 candles after the weekly open.
if isWeeklyOpen or isWeeklyOpen or isWeeklyOpen or isWeeklyOpen
h = math.max(high, range_box.get_top())
l = math.min(low, range_box.get_bottom())
Draws two horizontal lines from the range extremes, acting as dynamic support/resistance zones throughout the week.
Visualizes the range with a semi-transparent box for clear zone identification.
Includes a compact dashboard panel with:
- Symbol and current price with bullish or bearish bar indication with ▲ / ▼
- Current weekly high/low range values
🔵 USAGE
Treat the high and low of the range as support/resistance zones for the week.
Combine with volume analysis or liquidity tools for entry confirmation .
Refresh your key levels every week as the indicator resets each Sunday night .
Works great alongside Smart Money Concepts (ICT) strategies and weekly planning.
Weekly Open Range gives traders a reliable structure to anchor their week. With clear range mapping, breakout signals, and intuitive visuals, it becomes a valuable part of any strategic trading approach—especially when precision timing around liquidity zones is key.
PowerHouse SwiftEdge AI v2.10 with Custom Filters & AI AnalysisPowerHouse SwiftEdge AI v2.10 with Custom Filters & AI Analysis
Overview
PowerHouse SwiftEdge AI v2.10 is an advanced TradingView Pine Script indicator designed to identify high-probability trading setups by combining pivot-based structure analysis, multi-timeframe trend detection, and adaptive AI-driven signal filtering. The script integrates Change of Character (CHoCH) and Break of Structure (BOS) signals with customizable momentum, volume, breakout, and trend filters to enhance trade precision. Additionally, it offers an optional AI Market Analysis module that predicts future price trends across multiple timeframes, providing traders with a comprehensive market outlook.
The script is highly customizable, allowing users to tailor inputs to their trading style, whether for scalping, swing trading, or long-term strategies. It is suitable for all asset classes, including stocks, forex, crypto, and commodities, and performs optimally on timeframes ranging from 1-minute to daily charts.
Key Features
Pivot-Based Signal Generation:
Identifies pivot highs and lows to detect CHoCH (reversal patterns) and BOS (continuation patterns).
Signals are plotted as "Buy" or "Sell" labels with optional "Get Ready" pre-signals to prepare traders for potential setups.
Take-profit (TP) levels are automatically calculated based on user-defined points, with optional TP box visualization.
Multi-Timeframe Trend Analysis:
Analyzes trends across seven timeframes (1M, 5M, 15M, 30M, 1H, 4H, D) using EMA and VWAP to determine bullish, bearish, or neutral conditions.
Displays a futuristic AI-Trend Matrix dashboard showing trend direction, strength, and confidence levels for quick decision-making.
Customizable Signal Filters:
Momentum Filter: Ensures signals align with significant price changes, adjusted dynamically using ATR-based volatility.
Higher Timeframe Trend Filter: Requires signals to align with the trend of a user-selected higher timeframe (e.g., 1H).
Lower Timeframe Trend Filter: Prevents signals that conflict with the trend of a user-selected lower timeframe (e.g., 5M).
Volume Filter: Optionally requires above-average volume to confirm signals.
Breakout Filter: Optionally requires price to break previous highs/lows for signal validation.
Repeated Signal Restriction: Prevents consecutive signals in the same trend direction until the trend changes on a user-defined timeframe.
AI-Driven Adaptivity:
Incorporates Cumulative Volume Delta (CVD) to assess buying/selling pressure and classify market volatility (Low, Medium, High).
Uses ATR to dynamically adjust momentum thresholds, ensuring signals adapt to current market conditions.
Optional AI Market Analysis module predicts trends across multiple timeframes by combining trend, momentum, and volatility scores.
Visual Elements:
Plots CHoCH and BOS levels as horizontal lines with distinct colors (aqua for CHoCH sell, lime for CHoCH buy, fuchsia for BOS sell, teal for BOS buy).
Draws dynamic support and resistance trendlines based on short and long-term price action, colored by trend strength.
Displays TP levels and pivot highs/lows for easy reference.
How It Works
The script combines several technical analysis concepts to create a robust trading system:
Market Structure Analysis:
Pivot highs and lows are identified using a user-defined lookback period (Pivot Length).
CHoCH occurs when price crosses below a pivot high (bearish reversal) or above a pivot low (bullish reversal).
BOS occurs when price breaks a previous pivot low (bearish continuation) or pivot high (bullish continuation).
Trend and Momentum Integration:
Trends are determined by comparing price to EMA and VWAP on multiple timeframes.
Momentum is calculated as the percentage price change, with thresholds adjusted by ATR to account for volatility.
"Get Ready" signals appear when momentum approaches the threshold, preparing traders for potential CHoCH or BOS signals.
Signal Filtering:
Filters ensure signals align with user-defined criteria (e.g., trend direction, volume, breakouts).
The Restrict Repeated Signals option prevents over-signaling by requiring a trend change on a specified timeframe before generating a new signal in the same direction.
AI Market Analysis:
The optional AI module calculates a score for each timeframe based on trend direction, momentum, and volatility (ATR compared to its SMA).
Scores are translated into predictions (▲ for bullish, ▼ for bearish, — for neutral), displayed in a dedicated table.
CVD and Volatility Context:
CVD tracks buying vs. selling pressure by accumulating volume based on price direction.
Volatility is classified using CVD magnitude, influencing the script’s visual cues and signal sensitivity.
Why This Combination?
The integration of pivot-based structure analysis, multi-timeframe trend filtering, and AI-driven adaptivity addresses common trading challenges:
Precision: CHoCH and BOS signals focus on key market turning points, reducing noise from minor price fluctuations.
Context: Multi-timeframe analysis ensures trades align with broader market trends, improving win rates.
Adaptivity: ATR and CVD adjustments make the script responsive to changing market conditions, avoiding static thresholds that fail in volatile or quiet markets.
Customization: Extensive input options allow traders to adapt the script to their preferred markets, timeframes, and risk profiles.
Predictive Insight: The AI Market Analysis module provides forward-looking trend predictions, helping traders anticipate market moves.
This combination creates a self-contained system that balances responsiveness with reliability, making it suitable for both novice and experienced traders.
How to Use
Add to Chart:
Apply the indicator to your TradingView chart for any asset and timeframe.
Recommended timeframes: 5M to 1H for scalping/day trading, 4H to D for swing trading.
Configure Inputs:
Pivot Length: Adjust (default 5) to control sensitivity to pivot highs/lows. Lower values for faster signals, higher for stronger confirmations.
Momentum Threshold: Set the minimum price change (default 0.01%) for signals. Increase for stricter conditions.
Take Profit Points: Define TP distance (default 10 points). Adjust based on asset volatility.
Signal Filters: Enable/disable filters (momentum, trend, volume, breakout) to match your strategy.
Higher/Lower Timeframe: Select timeframes for trend alignment (e.g., 1H for higher, 5M for lower).
AI Market Analysis: Enable for predictive trend insights across timeframes.
Get Ready Signals: Enable to see pre-signals for potential setups.
Interpret Signals:
Buy/Sell Labels: Act on green "Buy" or red "Sell" labels, confirming with TP levels and trend direction.
Get Ready Labels: Yellow "Get Ready BUY" or orange "Get Ready SELL" indicate potential setups; prepare but wait for confirmation.
CHoCH/BOS Lines: Use aqua/lime (CHoCH) and fuchsia/teal (BOS) lines as key support/resistance levels.
AI-Trend Matrix: Check the top-right dashboard for trend strength (%), confidence (%), and timeframe-specific trends.
AI Market Analysis Table: If enabled, view predictions (▲/▼/—) for each timeframe to anticipate market direction.
Trading Tips:
Combine signals with other indicators (e.g., RSI, MACD) for additional confirmation.
Use higher timeframe trend alignment for higher-probability trades.
Adjust TP and signal distance based on asset volatility and trading style.
Monitor the AI-Trend Matrix for trend strength; values above 50% or below -50% indicate strong directional bias.
Originality
PowerHouse SwiftEdge AI v2.10 stands out due to its unique blend of:
Adaptive Signal Generation: ATR-based momentum thresholds and CVD-driven volatility context ensure signals remain relevant across market conditions.
Multi-Timeframe Synergy: The script’s ability to filter signals based on both higher and lower timeframe trends provides a rare balance of precision and context.
AI-Powered Insights: The AI Market Analysis module offers predictive capabilities not commonly found in traditional indicators, simulating institutional-grade analysis.
Visual Clarity: The futuristic dashboard and color-coded trendlines make complex data accessible, enhancing usability for all trader levels.
Unlike standalone pivot or trend indicators, this script integrates multiple layers of analysis into a cohesive system, reducing false signals and providing actionable insights without requiring external tools or research.
Limitations
False Signals: No indicator is foolproof; signals may fail in choppy or low-volume markets. Use filters to mitigate.
Timeframe Sensitivity: Performance varies by timeframe and asset. Test settings thoroughly.
AI Predictions: The AI Market Analysis is based on historical data and simplified scoring; it’s not a guaranteed forecast.
Resource Usage: Enabling all filters and AI analysis may slow performance on lower-end devices.

Quantum UT BOT by MrCryptoBTCQuantum UT BOT by MrCryptoBTC – Precision Signal Engine (Not For Sale - FREE)
How it Works:
The Quantum UT BOT is a smart, optimized version of the classic UT BOT indicator by Yo_adriiiiaan.
It has been meticulously modified by MrCryptoBTC with a Key Value of 0.5 and an ATR Period of 7, making it faster, more responsive, and more accurate in detecting market shifts.
The system uses Adaptive ATR-based triggers to generate Buy (LONG) and Sell (SHORT) signals with Exit points, helping traders catch trends earlier and lock in profits intelligently.
Description:
Quantum UT BOT is an evolution of the original UT BOT, now tuned for higher precision, faster entries, and smarter exits.
By adjusting the core parameters (Key Value 0.5, ATR Period 7), MrCryptoBTC has transformed the UT BOT into a next-generation signal engine suitable for scalpers, intraday, and swing traders.
The Buy and Sell signals generated by the Quantum UT BOT are clear, early, and reliable — offering a major advantage in volatile markets like Gold, Crypto, and Forex.
It is highly recommended to use the Quantum UT BOT together with the STO * Smart Trend Oscillator for a complete smart trading system, providing confirmation and trend filtering for maximum accuracy.
Main Features:
* Fast Buy/Sell Detection – reacts quickly to market changes
* Clear Exit Signals – helps secure profits and reduce drawdowns
* Smart Trend Filtering – ATR-adaptive for dynamic conditions
* Works on All Timeframes – from 1-minute scalping to daily swings
* Perfect Companion to STO * Smart Trend Oscillator
✅ Created by: MrCryptoBTC
✅ Perfect for: Scalpers, Intraday Traders, Swing Traders
✅ Markets: Gold, Crypto, Forex, Indices


Deviation Symmetry Breaker ~ C H I P ADeviation Symmetry Breaker ~ C H I P A is a custom trend breakout tool designed to detect directional shifts through raw deviation asymmetry around a median price baseline.
It uses:
A user-selectable price source (Close, High, Low, etc.)
Dual median smoothing to stabilize trend foundation without introducing moving average lag
Raw positive and negative deviation tracking for pure momentum extraction
Dynamic upper and lower breakout bands scaled by standard deviation
Independent band multipliers to fine-tune breakout sensitivity
This setup highlights powerful breakouts when price meaningfully separates from its balanced median behavior — helping traders capture early trend movements, volatility expansions, and structural shifts with minimal smoothing and no hidden moving averages.
Candle coloring responds directly to breakout status, using vibrant electric blue and red for immediate visual clarity on the chart.

[blackcat] L2 EMA NexusOVERVIEW
The L2 EMA Nexus is a comprehensive trading indicator that utilizes a three-tiered Exponential Moving Average (EMA) system to identify potential trading opportunities. This script combines technical analysis with robust risk management features to help traders make informed decisions.
KEY FEATURES
• Triple EMA Analysis:
Customizable source inputs for each EMA
Adjustable length parameters (3, 8, 21 periods)
Dynamic color coding based on trend direction
Real-time price action monitoring
• Advanced Entry Signals:
High-low price action verification
EMA cross-overs and cross-unders
Multi-timeframe trend confirmation
Dynamic position sizing limits
• Risk Management:
Configurable Take Profit levels
Flexible Stop Loss settings
Optional TP/SL activation
Clear visual indicators for levels
HOW TO USE
Setup Initial Parameters:
Configure EMA lengths for your timeframe
Set Take Profit percentage (default 25%)
Define Stop Loss percentage (default 2.5%)
Adjust pyramiding limit as needed
Enable/Disable Features:
Toggle TP/SL settings based on strategy
Customize alert conditions
Modify visual labels for clarity
Monitor Trading Signals:
Watch for buy/sell labels
Track TP/SL levels
Monitor position status
TRADE MANAGEMENT
• Entry Conditions:
Long Entry: Higher high with rising EMA1 and stable EMA3
Short Entry: Lower low with falling EMA1 and stable EMA2
• Exit Conditions:
Take Profit: Price reaches defined percentage above/below entry
Stop Loss: Price reaches defined percentage below/above entry
• Position Control:
Limited to specified number of positions
Automatic position tracking
Clear visual indication of current trades
TECHNICAL DETAILS
• EMA Calculation:
Uses Exponential Moving Average for trend following
Color-coded based on 2-bar trend direction
Multiple timeframe compatibility
• Label System:
Clear buy/sell markers
Take Profit and Stop Loss indicators
Real-time position status updates
• Alert Configuration:
Customizable alert messages
Multiple alert conditions
Option to enable/disable specific alerts
LIMITATIONS
⚠️ Important Considerations:
Results may vary across different market conditions
Historical performance does not guarantee future results
Always backtest strategy before live trading
Consider complementing with additional analysis tools
BEST PRACTICES
• Recommended Timeframes:
Daily charts for long-term strategies
4-hour charts for swing trading
1-hour charts for short-term trading
• Risk Management Tips:
Start with small position sizes
Always use TP/SL in live trading
Monitor market volatility before entering trades
TROUBLESHOOTING
• Common Issues:
Ensure proper chart resolution
Verify alert conditions are enabled
Check for conflicting indicators
• Performance Optimization:
Use appropriate timeframe for your strategy
Adjust indicator parameters based on market conditions
Monitor for potential overfitting

[blackcat] L1 Dynamic EdgeOVERVIEW
📈 The L1 Dynamic Edge is a sophisticated trend-following indicator designed to empower traders with a comprehensive view of market dynamics and precise buy/sell signals. By leveraging multiple Exponential Moving Averages (EMAs) and advanced signal processing, this indicator aims to capture the essence of price momentum and provide actionable insights across various financial instruments and timeframes.
🔑 Key Features:
Fully customizable EMA settings
Multi-dimensional trend analysis using high, low, and midpoint EMAs
Intuitive color-coded trend visualization
Accurate buy/sell signals with visual confirmation
Flexible alert system for real-time notifications
Seamless integration with TradingView's charting tools
FEATURES
📉 Advanced Trend Detection:
Utilizes three distinct EMAs (high, low, and midpoint) for a holistic view of market trends
Employs sophisticated logic to determine rising and falling trends
🌟 Dynamic Visualization:
Automatically adjusts the color of EMA plots based on detected trend direction
Fills the area between high and low EMAs for enhanced visual clarity
📈 Precision Signal Generation:
Identifies potential trend reversals using a combination of price action and EMA behavior
Generates clear buy/sell signals based on trend changes
📊 Comprehensive Chart Integration:
Displays buy/sell signals as easily identifiable shapes on the chart
Adds descriptive labels to signal bars for quick reference
🔔 Customizable Alert System:
Provides alert conditions for both buy and sell signals
Allows users to stay informed about potential trading opportunities even when away from the chart
🛠️ User-Friendly Interface:
Simple input parameters for easy customization
Clean and uncluttered chart appearance without overwhelming the user
🌐 Versatile Application:
Adaptable to various financial instruments, including stocks, forex, commodities, and cryptocurrencies
Effective across different timeframes, from short-term scalping to long-term investing
HOW TO USE
✨ Adding the Indicator:
Open your TradingView chart
Click on "Add Indicator" at the top of the screen
Search for " L1 Dynamic Edge" and add it to your chart
🔧 Customizing Settings:
Adjust the EMA length in the input panel to suit your trading style and preferences
Experiment with different values to find what works best for your specific strategy
🕵️♂️ Analyzing Trends:
Observe the color of the EMA bands to quickly assess the overall market sentiment
Note how the filling between the high and low EMAs responds to price movements
📈 Identifying Opportunities:
Watch for buy/sell signals indicated by triangles and labels on the chart
Consider these signals as potential entry/exit points for your trades
🎯 Implementing Strategies:
Combine the indicator's signals with your own analysis and risk management techniques
Use the provided alerts to stay informed about new trading opportunities
🚨 Setting Up Alerts:
Configure alert conditions for buy and sell signals
Choose your preferred notification method (email, SMS, push notifications, etc. )
📊 Fine-Tuning Your Approach:
Regularly review and analyze the indicator's performance
Adjust the EMA length and other parameters as needed to adapt to changing market conditions
LIMITATIONS
Like any technical indicator, the L1 Dynamic Edge should not be used as a standalone trading system
Its effectiveness may be limited during periods of extreme volatility or in highly ranging markets
The indicator's performance will vary depending on the specific instrument and timeframe being analyzed
New traders might need some time to fully understand and effectively utilize all features of the indicator
NOTES
This script utilizes Pine Script version 5 for optimal performance and compatibility with TradingView's latest features
The default EMA length is set to 3, which provides a balance between responsiveness and noise reduction
The indicator's color scheme has been carefully chosen to ensure maximum visibility while maintaining a clean chart appearance
For best results, consider combining this indicator with other forms of technical and fundamental analysis
Regular backtesting and forward testing are crucial to optimize the indicator's settings for your specific trading style and market conditions
THANKS
We extend our deepest gratitude to the vibrant TradingView community for their invaluable feedback, suggestions, and support throughout the development process of the L1 Dynamic Edge indicator. Special thanks to all the dedicated traders who took the time to test and refine this tool, helping us create a more robust and user-friendly experience for everyone.

EMA Crossover with Signalswhen the 8 ema line crosses above the 50 ema, a buy signal is initiated. Will not paint again for 24 hours. Should a candle touch the 20 ema line to the downside, a orange X will appear - helps for raising your stop-loss or closing your order.

KOLBASKA AIKOLBASKA AI VANGA
regression channel
Pivot Levels
FIBA
Price Movement Prediction
TNX DIONIS

Buy Sell Indicator PROIt uses Average True Range (ATR) to dynamically calculate a trailing stop level that follows price action and adapts to market volatility.
The indicator:
Plots a dynamic trailing stop line on the chart.
Colors the trailing stop line:
Green when in an uptrend (long position),
Red when in a downtrend (short position),
Blue when neutral.
Plots Buy/Sell labels based on when the price crosses above or below the trailing stop line.
Colors candles green or red depending on whether the price is above or below the trailing stop.
It gives alerts for potential Buy and Sell opportunities automatically.
🧠 How It Works (Logic)
ATR Calculation:
It calculates the ATR (Average True Range) over a chosen period (default: 10 bars).
ATR measures market volatility — bigger ATR = bigger stop distance.
Trailing Stop Calculation:
When the price moves up, the trailing stop also moves up.
When the price moves down, the trailing stop moves down.
If price crosses the trailing stop, the trend is considered reversed.
Buy/Sell Signals:
Buy when the price crosses above the trailing stop line.
Sell when the price crosses below the trailing stop line.
EMA Crossover (Optional Flexibility):
By default, the EMA is set to 1 (basically just the close price).
But if you change the EMA period input, it can use a smoothed moving average to trigger Buy/Sell, making signals cleaner.
📈 How To Use It
Add the Indicator to your chart (make sure it's updated to the v5 version I posted earlier).
Adjust the Settings:
Key Value (Sensitivity):
A higher Key Value = wider trailing stop = fewer but more reliable signals.
A lower Key Value = tighter trailing stop = more frequent signals but possibly more noise.
ATR Period:
Higher period = slower reactions (good for higher timeframes).
Lower period = faster reactions (good for scalping or low timeframes).
EMA Period:
1 by default. Increasing it will smooth the entry signals.
Interpret the Chart:
Trailing Stop Line:
If price is above the line and the line is green → market is bullish.
If price is below the line and the line is red → market is bearish.
Buy/Sell Labels:
Entry signals are plotted with clear Buy and Sell tags.
Candle Colors:
Candles turn green when price > trailing stop.
Candles turn red when price < trailing stop.
Set Alerts:
Create a TradingView alert on the Buy and Sell conditions.
You will get automatic alerts when a new signal is detected.

[blackcat] L3 Hull SeekerOVERVIEW
The L3 Hull Seeker is a comprehensive trading indicator that combines Hull Moving Average (HMA) analysis with robust position management and risk control features. This script is designed to help traders identify potential entry and exit points while maintaining strict risk management protocols.
KEY FEATURES
• Hull MA Analysis:
Advanced Hull Moving Average calculations
Separate Hull MA lines for Close and Open prices
Visual color coding for trend direction
Customizable length parameter for flexibility
• Position Tracking:
Real-time monitoring of long and short positions
Maximum position limit control
Clear position status indicators on chart
• Risk Management System:
User-defined Take Profit percentage
User-defined Stop Loss percentage
Optional activation of TP/SL features
Dynamic label markers for important levels
• Alert System:
Buy/Sell entry alerts
Take Profit/Stop Loss exit alerts
Position status changes
HOW TO USE
Setup Initial Parameters:
Hull MA Length: Adjust based on your trading timeframe
Take Profit Percentage: Set according to your risk tolerance
Stop Loss Percentage: Define your maximum acceptable loss
Enable/Disable Features:
Toggle Take Profit/Stop Loss options as needed
Adjust alert conditions for your trading style
Monitor Trading Signals:
Watch for crossover/crossunder signals
Track position status through labels
Monitor entry and exit alerts
Manage Risk:
Use TP/SL features to control position size
Monitor pyramiding limits
Review position status regularly
TRADE MANAGEMENT
• Entry Conditions:
Long Entry: HullMA_close crosses above HullMA_open
Short Entry: HullMA_close crosses below HullMA_open
• Exit Conditions:
Take Profit: Price reaches defined percentage above/below entry
Stop Loss: Price reaches defined percentage below/above entry
• Position Control:
Limited to one position at a time
Automatic position tracking
Clear visual indication of current trades
TECHNICAL DETAILS
• Hull MA Calculation:
Uses WMA (Weighted Moving Average) for precise calculations
Optimized for trend-following strategies
Smoothed Hull MA lines for better readability
• Label System:
Clear buy/sell markers
Take Profit and Stop Loss indicators
Real-time position status updates
• Alert Configuration:
Customizable alert messages
Multiple alert conditions
Option to enable/disable specific alerts
LIMITATIONS
⚠️ Important Considerations:
Results may vary across different market conditions
Historical performance does not guarantee future results
Always backtest strategy before live trading
Consider complementing with additional analysis tools
BEST PRACTICES
• Recommended Timeframes:
Daily charts for long-term strategies
4-hour charts for swing trading
1-hour charts for short-term trading
• Risk Management Tips:
Start with small position sizes
Always use TP/SL in live trading
Monitor market volatility before entering trades
TROUBLESHOOTING
• Common Issues:
Ensure proper chart resolution
Verify alert conditions are enabled
Check for conflicting indicators
• Performance Optimization:
Use appropriate timeframe for your strategy
Adjust indicator parameters based on market conditions
Monitor for potential overfitting

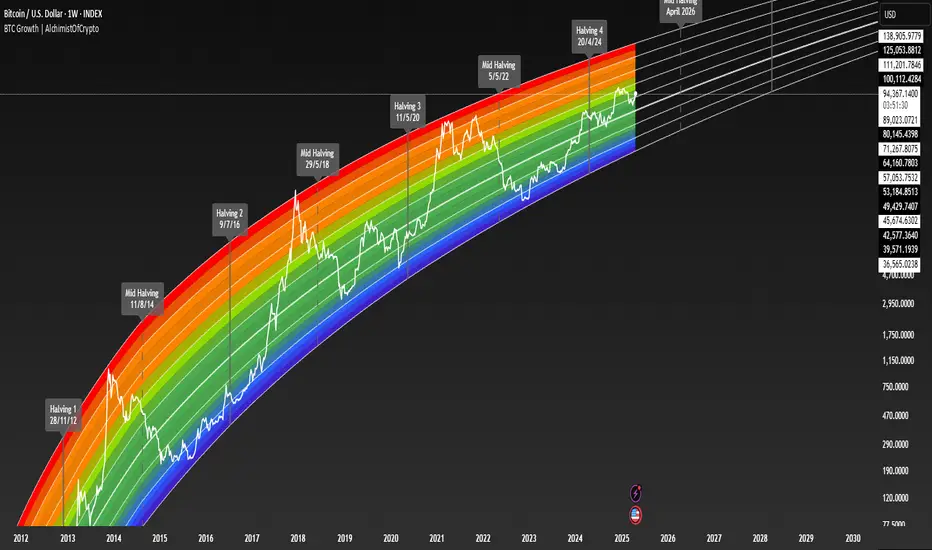
BTC Growth | AlchimistOfCrypto🌈 BTC Regression Bands & Halvings – Unveiling Bitcoin's Logarithmic Growth Fields 🌈
"The Bitcoin Regression Bands, engineered through advanced logarithmic mathematics, visualizes the probabilistic distribution of Bitcoin's price evolution within a multi-cycle growth paradigm. This indicator employs principles from hyperbolic regression where decay coefficients create mathematical boundaries that define Bitcoin's long-term value progression. Our implementation features algorithmically enhanced rainbow visualization derived from extensive cycle analysis, creating a dynamic representation of Bitcoin's logarithmic growth with adaptive color gradients that highlight critical halving-based phase transitions in the asset's monetary evolution."
📊 Professional Trading Application
The Bitcoin Regression Bands transcends traditional price prediction models with a sophisticated multi-band illumination system that reveals the underlying structure of Bitcoin's monetary evolution. Scientifically calibrated across multiple halving cycles and featuring seamless rainbow visualization, it enables investors to perceive Bitcoin's position within its macro growth trajectory with unprecedented clarity.
- Visual Theming 🎨
Scientifically designed rainbow gradient optimized for cycle pattern recognition:
- Violet-Blue: Lower value accumulation zones with highest mathematical growth potential
- Green: Fair value equilibrium zone representing the regression mean
- Yellow-Orange: Moderate overvaluation regions indicating potential resistance
- Red: Statistical extreme zones indicating mathematical cycle peaks
- Halving Visualization 🔍
- Precise cycle boundaries demarcating Bitcoin's fundamental supply shock events
- Adaptive band spacing based on mathematical cycle progression
- Multiple sub-cycle markers revealing the probabilistic nature of Bitcoin's trajectory
🚀 How to Use
1. Identify Macro Position ⏰: Locate Bitcoin's current price relative to the regression bands
2. Understand Cycle Context 🎚️: Note position within the current halving cycle for time-based analysis
3. Assess Mathematical Value 🌈: Determine potential over/undervaluation based on band location
4. Adjust Investment Strategy 🔎: Modulate position sizing based on mathematical value assessment
5. Identify Cycle Phases ✅: Monitor band transitions to detect accumulation and distribution zones
6. Invest with Precision 🛡️: Utilize lower bands for strategic accumulation, upper bands for strategic reduction
7. Manage Risk Dynamically 🔐: Scale investment allocations based on mathematical cycle positioning
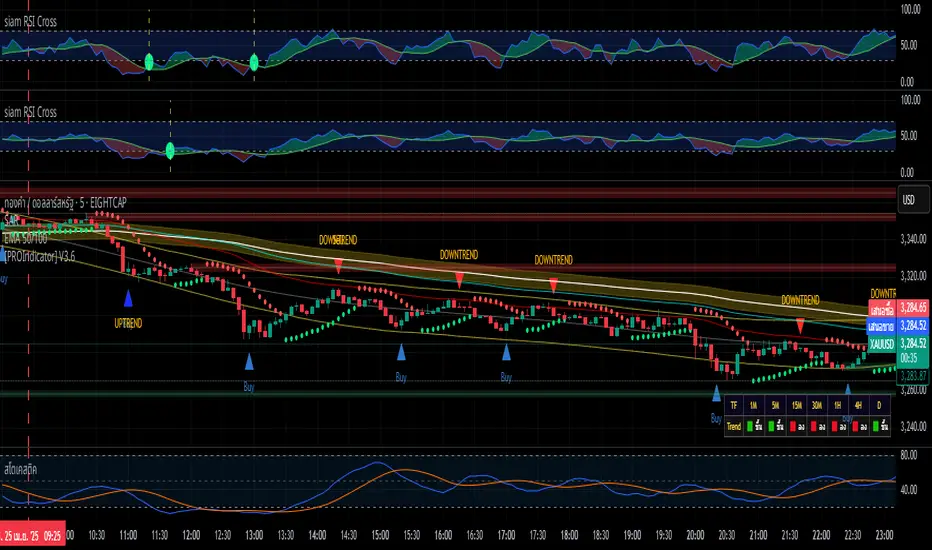
siam RSI Crossอินดิเคเตอร์ "Siam RSI Cross" ช่วยระบุจุดตัดระหว่าง RSI และ SMA ในโซน overbought (เหนือ 70) และ oversold (ใต้ 30)
- เส้นปะสีเหลืองและจุดสีแดง: RSI ตัดขึ้นใต้ระดับ 30 (โซน oversold)
- เส้นปะสีขาวและจุดสีเขียว: RSI ตัดลงเหนือระดับ 70 (โซน overbought)
- ปรับแต่งได้: ความยาว RSI (MA 1) และ SMA (MA 2)
- รองรับการแจ้งเตือนสำหรับสัญญาณซื้อ/ขาย
สรุปการทำงานของสคริปต์:
1. วัตถุประสงค์หลัก:
อินดิเคเตอร์นี้ใช้ RSI (Relative Strength Index) และ SMA (Simple Moving Average) ของ RSI เพื่อระบุจุดตัด (crossover และ crossunder) ในโซน overbought (เหนือ 70) และ oversold (ใต้ 30)
แสดงสัญญาณด้วย:
เส้นปะแนวตั้ง: เพื่อระบุจุดตัดในโซนที่กำหนด
จุดสี: เพื่อเน้นจุดตัดให้ชัดเจนยิ่งขึ้น
การแจ้งเตือน: เพื่อให้ผู้ใช้ตั้งค่าแจ้งเตือนใน TradingView ได้
2. องค์ประกอบของอินดิเคเตอร์:
เส้น RSI: คำนวณจาก ta.rsi(close, len1) โดย len1 (ค่าเริ่มต้น 34) เป็นความยาวที่ผู้ใช้กำหนดได้ แสดงเป็นเส้นสีน้ำเงิน
เส้น SMA ของ RSI: คำนวณจาก ta.sma(sh, len2) โดย len2 (ค่าเริ่มต้น 68) เป็นความยาวที่ผู้ใช้กำหนดได้ แสดงเป็นเส้นสีเขียว
เส้นแนวนอน: ที่ระดับ 30 (Oversold) และ 70 (Overbought) เป็นเส้นสีเทาแบบปะ
การเติมสีระหว่างเส้น 30 และ 70: ใช้สีน้ำเงินโปร่งใส (opacity 80)
การเติมสีระหว่าง RSI และ SMA:
สีเขียวอ่อน (lime) เมื่อ RSI > SMA
สีแดงเมื่อ RSI < SMA
3. เงื่อนไขและการแสดงสัญญาณ:
RSI ตัดขึ้น (Crossover) ใต้เส้น 30:
เงื่อนไข: RSI ตัดขึ้นผ่าน SMA (ta.crossover(sh, ln)) และ RSI < 30 (sh < 30)
เส้นปะแนวตั้งสีเหลือง: วาดจากระดับ 0 ถึง 100 ในหน้าต่าง RSI ด้วย line.new
จุดสีแดง: วาดที่ระดับ RSI (sh) ตรงจุดตัด ด้วย plotshape (รูปวงกลม, ขนาดเล็ก)
RSI ตัดลง (Crossunder) เหนือเส้น 70:
เงื่อนไข: RSI ตัดลงผ่าน SMA (ta.crossunder(sh, ln)) และ RSI > 70 (sh > 70 and sh > 70)
เส้นปะแนวตั้งสีขาว: วาดจากระดับ 0 ถึง 100 ในหน้าต่าง RSI ด้วย line.new
จุดสีเขียว: วาดที่ระดับ RSI (sh) ตรงจุดตัด ด้วย plotshape (รูปวงกลม, ขนาดเล็ก)
หมายเหตุ: เงื่อนไข sh > 70 and sh > 70 ช่วยให้แน่ใจว่าการตัดลงเกิดในโซน overbought และป้องกันการตรวจจับที่ผิดพลาด
4. การแจ้งเตือน (Alert Conditions):
สัญญาณซื้อทั่วไป: เมื่อ RSI ตัดขึ้นผ่าน SMA (ta.crossover(sh, ln)) ชื่อ: "Buy", ข้อความ: "RSI Cross. Buy Signal"
สัญญาณขายทั่วไป: เมื่อ RSI ตัดลงผ่าน SMA (ta.crossunder(sh, ln)) ชื่อ: "Sell", ข้อความ: "RSI Cross. Sell Signal"
สัญญาณตัดขึ้นใต้ 30: ชื่อ: "Buy Cross Below 30", ข้อความ: "RSI Cross Up Below 30"
สัญญาณตัดลงเหนือ 70: ชื่อ: "Sell Cross Above 70", ข้อความ: "RSI Cross Down Above 70"
ผู้ใช้สามารถตั้งค่าการแจ้งเตือนใน TradingView โดยเลือกเงื่อนไขเหล่านี้
5. การตั้งค่าที่ผู้ใช้ปรับได้:
len1: ความยาวของ RSI (ค่าเริ่มต้น: 34) ปรับได้ผ่านอินพุต "MA 1"
len2: ความยาวของ SMA (ค่าเริ่มต้น: 68) ปรับได้ผ่านอินพุต "MA 2"
6. การแสดงผล:
อินดิเคเตอร์แสดงในหน้าต่างแยก (ไม่ทับบนชาร์ตราคา) เนื่องจาก overlay=false
เส้นแนวตั้งและจุดสีทั้งหมดปรากฏในหน้าต่าง RSI โดย:
เส้นปะแนวตั้งครอบคลุมช่วง 0 ถึง 100
จุดสีแดงและสีเขียวอยู่ที่ระดับ RSI ตรงจุดตัด
Summary of the Script's Functionality:
1. Main Objective:
The indicator uses the Relative Strength Index (RSI) and a Simple Moving Average (SMA) of the RSI to identify crossover and crossunder points in the overbought (above 70) and oversold (below 30) zones.
It displays signals using:
Dashed vertical lines: To mark crossover/crossunder points in the specified zones.
Colored dots: To highlight the crossover/crossunder points more clearly.
Alerts: To allow users to set up notifications in TradingView.
2. Components of the Indicator:
RSI Line: Calculated using ta.rsi(close, len1), where len1 (default: 34) is a user-defined length, displayed as a blue line.
SMA of RSI: Calculated using ta.sma(sh, len2), where len2 (default: 68) is a user-defined length, displayed as a green line.
Horizontal Lines: At levels 30 (Oversold) and 70 (Overbought), shown as dashed gray lines.
Fill Between 30 and 70: Filled with a translucent blue color (opacity 80).
Fill Between RSI and SMA:
Light green (lime) when RSI > SMA.
Red when RSI < SMA.
3. Conditions and Signal Display:
RSI Crossover Below 30:
Condition: RSI crosses above SMA (ta.crossover(sh, ln)) and RSI < 30 (sh < 30).
Yellow Dashed Vertical Line: Drawn from level 0 to 100 in the RSI window using line.new.
Red Dot: Plotted at the RSI level (sh) at the crossover point using plotshape (circle shape, small size).
RSI Crossunder Above 70:
Condition: RSI crosses below SMA (ta.crossunder(sh, ln)) and RSI > 70 (sh > 70 and sh > 70).
White Dashed Vertical Line: Drawn from level 0 to 100 in the RSI window using line.new.
Green Dot: Plotted at the RSI level (sh) at the crossunder point using plotshape (circle shape, small size).
Note: The condition sh > 70 and sh > 70 ensures that the crossunder occurs in the overbought zone and prevents false detections.
4. Alert Conditions:
General Buy Signal: When RSI crosses above SMA (ta.crossover(sh, ln)), Name: "Buy", Message: "RSI Cross. Buy Signal".
General Sell Signal: When RSI crosses below SMA (ta.crossunder(sh, ln)), Name: "Sell", Message: "RSI Cross. Sell Signal".
Crossover Below 30 Signal: Name: "Buy Cross Below 30", Message: "RSI Cross Up Below 30".
Crossunder Above 70 Signal: Name: "Sell Cross Above 70", Message: "RSI Cross Down Above 70".
Users can set up alerts in TradingView by selecting these conditions.
5. User-Adjustable Settings:
len1: RSI length (default: 34), adjustable via the "MA 1" input.
len2: SMA length (default: 68), adjustable via the "MA 2" input.
6. Display:
The indicator is displayed in a separate window (not overlaid on the price chart) due to overlay=false.
All vertical lines and colored dots appear in the RSI window:
Dashed vertical lines span from 0 to 100.
Red and green dots are placed at the RSI level at the crossover/crossunder points.

Daily & Weekly Level (Think_Analyst)New Indicator used for mapping of previous day and week high's and low, it will dynamic move marking with chart

TDI - Traders Dynamic Index [Goldminds] - Signals on Chartthis indicator is based off of the tdi. signal triggers once there is a 1 minute shift or bos after a higher time frame tdi hook or break of bands. just follow higher time frame order flow. i only use this for gold

ALTIN.S1 mi 🤔 BİST mi 🤔
// © kadriyamacli
//@version=5
indicator("ALTIN.S1 mi 🤔 BİST mi 🤔 ", overlay=true)

RSI Full Forecast [Titans_Invest]RSI Full Forecast
Get ready to experience the ultimate evolution of RSI-based indicators – the RSI Full Forecast, a boosted and even smarter version of the already powerful: RSI Forecast
Now featuring over 40 additional entry conditions (forecasts), this indicator redefines the way you view the market.
AI-Powered RSI Forecasting:
Using advanced linear regression with the least squares method – a solid foundation for machine learning - the RSI Full Forecast enables you to predict future RSI behavior with impressive accuracy.
But that’s not all: this new version also lets you monitor future crossovers between the RSI and the MA RSI, delivering early and strategic signals that go far beyond traditional analysis.
You’ll be able to monitor future crossovers up to 20 bars ahead, giving you an even broader and more precise view of market movements.
See the Future, Now:
• Track upcoming RSI & RSI MA crossovers in advance.
• Identify potential reversal zones before price reacts.
• Uncover statistical behavior patterns that would normally go unnoticed.
40+ Intelligent Conditions:
The new layer of conditions is designed to detect multiple high-probability scenarios based on historical patterns and predictive modeling. Each additional forecast is a window into the price's future, powered by robust mathematics and advanced algorithmic logic.
Full Customization:
All parameters can be tailored to fit your strategy – from smoothing periods to prediction sensitivity. You have complete control to turn raw data into smart decisions.
Innovative, Accurate, Unique:
This isn’t just an upgrade. It’s a quantum leap in technical analysis.
RSI Full Forecast is the first of its kind: an indicator that blends statistical analysis, machine learning, and visual design to create a true real-time predictive system.
⯁ SCIENTIFIC BASIS LINEAR REGRESSION
Linear Regression is a fundamental method of statistics and machine learning, used to model the relationship between a dependent variable y and one or more independent variables 𝑥.
The general formula for a simple linear regression is given by:
y = β₀ + β₁x + ε
β₁ = Σ((xᵢ - x̄)(yᵢ - ȳ)) / Σ((xᵢ - x̄)²)
β₀ = ȳ - β₁x̄
Where:
y = is the predicted variable (e.g. future value of RSI)
x = is the explanatory variable (e.g. time or bar index)
β0 = is the intercept (value of 𝑦 when 𝑥 = 0)
𝛽1 = is the slope of the line (rate of change)
ε = is the random error term
The goal is to estimate the coefficients 𝛽0 and 𝛽1 so as to minimize the sum of the squared errors — the so-called Random Error Method Least Squares.
⯁ LEAST SQUARES ESTIMATION
To minimize the error between predicted and observed values, we use the following formulas:
β₁ = /
β₀ = ȳ - β₁x̄
Where:
∑ = sum
x̄ = mean of x
ȳ = mean of y
x_i, y_i = individual values of the variables.
Where:
x_i and y_i are the means of the independent and dependent variables, respectively.
i ranges from 1 to n, the number of observations.
These equations guarantee the best linear unbiased estimator, according to the Gauss-Markov theorem, assuming homoscedasticity and linearity.
⯁ LINEAR REGRESSION IN MACHINE LEARNING
Linear regression is one of the cornerstones of supervised learning. Its simplicity and ability to generate accurate quantitative predictions make it essential in AI systems, predictive algorithms, time series analysis, and automated trading strategies.
By applying this model to the RSI, you are literally putting artificial intelligence at the heart of a classic indicator, bringing a new dimension to technical analysis.
⯁ VISUAL INTERPRETATION
Imagine an RSI time series like this:
Time →
RSI →
The regression line will smooth these values and extend them n periods into the future, creating a predicted trajectory based on the historical moment. This line becomes the predicted RSI, which can be crossed with the actual RSI to generate more intelligent signals.
⯁ SUMMARY OF SCIENTIFIC CONCEPTS USED
Linear Regression Models the relationship between variables using a straight line.
Least Squares Minimizes the sum of squared errors between prediction and reality.
Time Series Forecasting Estimates future values based on historical data.
Supervised Learning Trains models to predict outputs from known inputs.
Statistical Smoothing Reduces noise and reveals underlying trends.
⯁ WHY THIS INDICATOR IS REVOLUTIONARY
Scientifically-based: Based on statistical theory and mathematical inference.
Unprecedented: First public RSI with least squares predictive modeling.
Intelligent: Built with machine learning logic.
Practical: Generates forward-thinking signals.
Customizable: Flexible for any trading strategy.
⯁ CONCLUSION
By combining RSI with linear regression, this indicator allows a trader to predict market momentum, not just follow it.
RSI Full Forecast is not just an indicator — it is a scientific breakthrough in technical analysis technology.
⯁ Example of simple linear regression, which has one independent variable:
⯁ In linear regression, observations ( red ) are considered to be the result of random deviations ( green ) from an underlying relationship ( blue ) between a dependent variable ( y ) and an independent variable ( x ).
⯁ Visualizing heteroscedasticity in a scatterplot against 100 random fitted values using Matlab:
⯁ The data sets in the Anscombe's quartet are designed to have approximately the same linear regression line (as well as nearly identical means, standard deviations, and correlations) but are graphically very different. This illustrates the pitfalls of relying solely on a fitted model to understand the relationship between variables.
⯁ The result of fitting a set of data points with a quadratic function:
_________________________________________________
🔮 Linear Regression: PineScript Technical Parameters 🔮
_________________________________________________
Forecast Types:
• Flat: Assumes prices will remain the same.
• Linreg: Makes a 'Linear Regression' forecast for n periods.
Technical Information:
ta.linreg (built-in function)
Linear regression curve. A line that best fits the specified prices over a user-defined time period. It is calculated using the least squares method. The result of this function is calculated using the formula: linreg = intercept + slope * (length - 1 - offset), where intercept and slope are the values calculated using the least squares method on the source series.
Syntax:
• Function: ta.linreg()
Parameters:
• source: Source price series.
• length: Number of bars (period).
• offset: Offset.
• return: Linear regression curve.
This function has been cleverly applied to the RSI, making it capable of projecting future values based on past statistical trends.
______________________________________________________
______________________________________________________
⯁ WHAT IS THE RSI❓
The Relative Strength Index (RSI) is a technical analysis indicator developed by J. Welles Wilder. It measures the magnitude of recent price movements to evaluate overbought or oversold conditions in a market. The RSI is an oscillator that ranges from 0 to 100 and is commonly used to identify potential reversal points, as well as the strength of a trend.
⯁ HOW TO USE THE RSI❓
The RSI is calculated based on average gains and losses over a specified period (usually 14 periods). It is plotted on a scale from 0 to 100 and includes three main zones:
• Overbought: When the RSI is above 70, indicating that the asset may be overbought.
• Oversold: When the RSI is below 30, indicating that the asset may be oversold.
• Neutral Zone: Between 30 and 70, where there is no clear signal of overbought or oversold conditions.
______________________________________________________
______________________________________________________
⯁ ENTRY CONDITIONS
The conditions below are fully flexible and allow for complete customization of the signal.
______________________________________________________
______________________________________________________
🔹 CONDITIONS TO BUY 📈
______________________________________________________
• Signal Validity: The signal will remain valid for X bars .
• Signal Sequence: Configurable as AND or OR .
📈 RSI Conditions:
🔹 RSI > Upper
🔹 RSI < Upper
🔹 RSI > Lower
🔹 RSI < Lower
🔹 RSI > Middle
🔹 RSI < Middle
🔹 RSI > MA
🔹 RSI < MA
📈 MA Conditions:
🔹 MA > Upper
🔹 MA < Upper
🔹 MA > Lower
🔹 MA < Lower
📈 Crossovers:
🔹 RSI (Crossover) Upper
🔹 RSI (Crossunder) Upper
🔹 RSI (Crossover) Lower
🔹 RSI (Crossunder) Lower
🔹 RSI (Crossover) Middle
🔹 RSI (Crossunder) Middle
🔹 RSI (Crossover) MA
🔹 RSI (Crossunder) MA
🔹 MA (Crossover) Upper
🔹 MA (Crossunder) Upper
🔹 MA (Crossover) Lower
🔹 MA (Crossunder) Lower
📈 RSI Divergences:
🔹 RSI Divergence Bull
🔹 RSI Divergence Bear
📈 RSI Forecast:
🔹 RSI (Crossover) MA Forecast
🔹 RSI (Crossunder) MA Forecast
🔹 RSI Forecast 1 > MA Forecast 1
🔹 RSI Forecast 1 < MA Forecast 1
🔹 RSI Forecast 2 > MA Forecast 2
🔹 RSI Forecast 2 < MA Forecast 2
🔹 RSI Forecast 3 > MA Forecast 3
🔹 RSI Forecast 3 < MA Forecast 3
🔹 RSI Forecast 4 > MA Forecast 4
🔹 RSI Forecast 4 < MA Forecast 4
🔹 RSI Forecast 5 > MA Forecast 5
🔹 RSI Forecast 5 < MA Forecast 5
🔹 RSI Forecast 6 > MA Forecast 6
🔹 RSI Forecast 6 < MA Forecast 6
🔹 RSI Forecast 7 > MA Forecast 7
🔹 RSI Forecast 7 < MA Forecast 7
🔹 RSI Forecast 8 > MA Forecast 8
🔹 RSI Forecast 8 < MA Forecast 8
🔹 RSI Forecast 9 > MA Forecast 9
🔹 RSI Forecast 9 < MA Forecast 9
🔹 RSI Forecast 10 > MA Forecast 10
🔹 RSI Forecast 10 < MA Forecast 10
🔹 RSI Forecast 11 > MA Forecast 11
🔹 RSI Forecast 11 < MA Forecast 11
🔹 RSI Forecast 12 > MA Forecast 12
🔹 RSI Forecast 12 < MA Forecast 12
🔹 RSI Forecast 13 > MA Forecast 13
🔹 RSI Forecast 13 < MA Forecast 13
🔹 RSI Forecast 14 > MA Forecast 14
🔹 RSI Forecast 14 < MA Forecast 14
🔹 RSI Forecast 15 > MA Forecast 15
🔹 RSI Forecast 15 < MA Forecast 15
🔹 RSI Forecast 16 > MA Forecast 16
🔹 RSI Forecast 16 < MA Forecast 16
🔹 RSI Forecast 17 > MA Forecast 17
🔹 RSI Forecast 17 < MA Forecast 17
🔹 RSI Forecast 18 > MA Forecast 18
🔹 RSI Forecast 18 < MA Forecast 18
🔹 RSI Forecast 19 > MA Forecast 19
🔹 RSI Forecast 19 < MA Forecast 19
🔹 RSI Forecast 20 > MA Forecast 20
🔹 RSI Forecast 20 < MA Forecast 20
______________________________________________________
______________________________________________________
🔸 CONDITIONS TO SELL 📉
______________________________________________________
• Signal Validity: The signal will remain valid for X bars .
• Signal Sequence: Configurable as AND or OR .
📉 RSI Conditions:
🔸 RSI > Upper
🔸 RSI < Upper
🔸 RSI > Lower
🔸 RSI < Lower
🔸 RSI > Middle
🔸 RSI < Middle
🔸 RSI > MA
🔸 RSI < MA
📉 MA Conditions:
🔸 MA > Upper
🔸 MA < Upper
🔸 MA > Lower
🔸 MA < Lower
📉 Crossovers:
🔸 RSI (Crossover) Upper
🔸 RSI (Crossunder) Upper
🔸 RSI (Crossover) Lower
🔸 RSI (Crossunder) Lower
🔸 RSI (Crossover) Middle
🔸 RSI (Crossunder) Middle
🔸 RSI (Crossover) MA
🔸 RSI (Crossunder) MA
🔸 MA (Crossover) Upper
🔸 MA (Crossunder) Upper
🔸 MA (Crossover) Lower
🔸 MA (Crossunder) Lower
📉 RSI Divergences:
🔸 RSI Divergence Bull
🔸 RSI Divergence Bear
📉 RSI Forecast:
🔸 RSI (Crossover) MA Forecast
🔸 RSI (Crossunder) MA Forecast
🔸 RSI Forecast 1 > MA Forecast 1
🔸 RSI Forecast 1 < MA Forecast 1
🔸 RSI Forecast 2 > MA Forecast 2
🔸 RSI Forecast 2 < MA Forecast 2
🔸 RSI Forecast 3 > MA Forecast 3
🔸 RSI Forecast 3 < MA Forecast 3
🔸 RSI Forecast 4 > MA Forecast 4
🔸 RSI Forecast 4 < MA Forecast 4
🔸 RSI Forecast 5 > MA Forecast 5
🔸 RSI Forecast 5 < MA Forecast 5
🔸 RSI Forecast 6 > MA Forecast 6
🔸 RSI Forecast 6 < MA Forecast 6
🔸 RSI Forecast 7 > MA Forecast 7
🔸 RSI Forecast 7 < MA Forecast 7
🔸 RSI Forecast 8 > MA Forecast 8
🔸 RSI Forecast 8 < MA Forecast 8
🔸 RSI Forecast 9 > MA Forecast 9
🔸 RSI Forecast 9 < MA Forecast 9
🔸 RSI Forecast 10 > MA Forecast 10
🔸 RSI Forecast 10 < MA Forecast 10
🔸 RSI Forecast 11 > MA Forecast 11
🔸 RSI Forecast 11 < MA Forecast 11
🔸 RSI Forecast 12 > MA Forecast 12
🔸 RSI Forecast 12 < MA Forecast 12
🔸 RSI Forecast 13 > MA Forecast 13
🔸 RSI Forecast 13 < MA Forecast 13
🔸 RSI Forecast 14 > MA Forecast 14
🔸 RSI Forecast 14 < MA Forecast 14
🔸 RSI Forecast 15 > MA Forecast 15
🔸 RSI Forecast 15 < MA Forecast 15
🔸 RSI Forecast 16 > MA Forecast 16
🔸 RSI Forecast 16 < MA Forecast 16
🔸 RSI Forecast 17 > MA Forecast 17
🔸 RSI Forecast 17 < MA Forecast 17
🔸 RSI Forecast 18 > MA Forecast 18
🔸 RSI Forecast 18 < MA Forecast 18
🔸 RSI Forecast 19 > MA Forecast 19
🔸 RSI Forecast 19 < MA Forecast 19
🔸 RSI Forecast 20 > MA Forecast 20
🔸 RSI Forecast 20 < MA Forecast 20
______________________________________________________
______________________________________________________
🤖 AUTOMATION 🤖
• You can automate the BUY and SELL signals of this indicator.
______________________________________________________
______________________________________________________
⯁ UNIQUE FEATURES
______________________________________________________
Linear Regression: (Forecast)
Signal Validity: The signal will remain valid for X bars
Signal Sequence: Configurable as AND/OR
Condition Table: BUY/SELL
Condition Labels: BUY/SELL
Plot Labels in the Graph Above: BUY/SELL
Automate and Monitor Signals/Alerts: BUY/SELL
Linear Regression (Forecast)
Signal Validity: The signal will remain valid for X bars
Signal Sequence: Configurable as AND/OR
Condition Table: BUY/SELL
Condition Labels: BUY/SELL
Plot Labels in the Graph Above: BUY/SELL
Automate and Monitor Signals/Alerts: BUY/SELL
______________________________________________________
📜 SCRIPT : RSI Full Forecast
🎴 Art by : @Titans_Invest & @DiFlip
👨💻 Dev by : @Titans_Invest & @DiFlip
🎑 Titans Invest — The Wizards Without Gloves 🧤
✨ Enjoy!
______________________________________________________
o Mission 🗺
• Inspire Traders to manifest Magic in the Market.
o Vision 𐓏
• To elevate collective Energy 𐓷𐓏

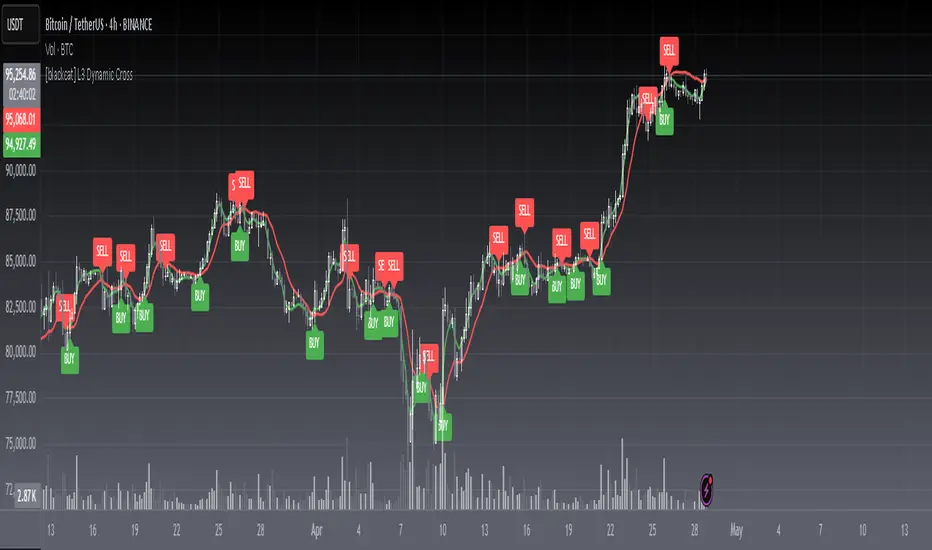
[blackcat] L3 Dynamic CrossOVERVIEW
The L3 Dynamic Cross indicator is a powerful tool designed to assist traders in identifying potential buy and sell opportunities through the use of dynamic moving averages. This versatile script offers a wide range of customizable options, allowing users to tailor the moving averages to their specific needs and preferences. By providing clear visual cues and generating precise crossover signals, it helps traders make informed decisions about market trends and potential entry/exit points 📈💹.
FEATURES
Multiple Moving Average Types:
Simple Moving Average (SMA): Provides a straightforward average of prices over a specified period.
Exponential Moving Average (EMA): Gives more weight to recent prices, making it responsive to new information.
Weighted Moving Average (WMA): Assigns weights to all prices within the look-back period, giving more importance to recent prices.
Volume Weighted Moving Average (VWMA): Incorporates volume data to provide a more accurate representation of price movements.
Smoothed Moving Average (SMMA): Averages out fluctuations to create a smoother trend line.
Double Exponential Moving Average (DEMA): Reduces lag by applying two layers of exponential smoothing.
Triple Exponential Moving Average (TEMA): Further reduces lag with three layers of exponential smoothing.
Hull Moving Average (HullMA): Combines weighted moving averages to minimize lag and noise.
Super Smoother Moving Average (SSMA): Uses a sophisticated algorithm to smooth out price data while preserving trend direction.
Zero-Lag Exponential Moving Average (ZEMA): Eliminates lag entirely by adjusting the calculation method.
Triangular Moving Average (TMA): Applies a double smoothing process to reduce volatility and enhance trend identification.
Customizable Parameters:
Length: Adjust the period for both fast and slow moving averages to match your trading style.
Source: Select different price sources such as close, open, high, or low for more nuanced analysis.
Visual Representation:
Fast MA: Displayed as a green line representing shorter-term trends.
Slow MA: Shown as a red line indicating longer-term trends.
Crossover Signals:
Generate buy ('BUY') and sell ('SELL') labels based on crossover events between the fast and slow moving averages 🏷️.
Clear visual cues help traders quickly identify potential entry and exit points.
Alert Functionality:
Receive real-time notifications when crossover conditions are met, ensuring timely action 🔔.
Customizable alert messages for personalized trading strategies.
Advanced Trade Management:
Support for pyramiding levels allows traders to manage multiple positions effectively.
Fine-tune your risk management by setting the number of allowed trades per signal.
HOW TO USE
Adding the Indicator:
Open your TradingView chart and go to the indicators list.
Search for L3 Dynamic Cross and add it to your chart.
Configuring Settings:
Choose your desired Moving Average Type from the dropdown menu.
Adjust the Fast MA Length and Slow MA Length according to your trading timeframe.
Select appropriate Price Sources for both fast and slow moving averages.
Monitoring Signals:
Observe the plotted lines on the chart to track short-term and long-term trends.
Look for buy and sell labels that indicate potential trade opportunities.
Setting Up Alerts:
Enable alerts based on crossover conditions to receive instant notifications.
Customize alert messages to suit your trading plan.
Managing Positions:
Utilize the pyramiding feature to handle multiple entries and exits efficiently.
Keep track of your position sizes relative to the defined pyramiding levels.
Combining with Other Tools:
Integrate this indicator with other technical analysis tools for confirmation.
Use additional filters like volume, RSI, or MACD to enhance decision-making accuracy.
LIMITATIONS
Market Conditions: The effectiveness of the indicator may vary in highly volatile or sideways markets. Be cautious during periods of low liquidity or sudden price spikes 🌪️.
Parameter Sensitivity: Different moving average types and lengths can produce varying results. Experiment with settings to find what works best for your asset class and timeframe.
False Signals: Like any technical indicator, false signals can occur. Always confirm signals with other forms of analysis before executing trades.
NOTES
Historical Data: Ensure you have enough historical data loaded into your chart for accurate moving average calculations.
Backtesting: Thoroughly backtest the indicator on various assets and timeframes using demo accounts before deploying it in live trading environments 🔍.
Customization: Feel free to adjust colors, line widths, and label styles to better fit your chart aesthetics and personal preferences.
EXAMPLE STRATEGIES
Trend Following: Use the indicator to ride trends by entering positions when the fast MA crosses above/below the slow MA and exiting when the opposite occurs.
Mean Reversion: Identify overbought/oversold conditions by combining the indicator with oscillators like RSI or Stochastic. Enter counter-trend positions when the moving averages diverge significantly from the mean.
Scalping: Apply tight moving average settings to capture small, quick profits in intraday trading. Combine with volume indicators to filter out weak signals.
Simple Gold Reversal Detector V2 PRO + EMA + Volume + RSI + WickSimple Gold Reversal Detector V2 PRO is a reversal spotter tool designed for XAUUSD (Gold) on 5-min to 15-min timeframes.
It uses candlestick behavior, volume confirmation, trend filtering, and momentum exhaustion to detect high-probability turning points in the market. It is built to filter out weak setups and focus on meaningful reversals.
It is not a trend follower and will not catch every reversal. It may give false signals in heavy news or spiky sessions. You still need to manage trades accordingly.
REMEBER THAT THIS IS REVERSAL DETECTOR meaning don't enter immediately on trades. WAIT FOR PULLBACK and PRICE ACTION to avoid fakeout . It may give you 100-200-300 pips. might give you also false indication.
Features of the indicator:
Full control of what you want to filter out
Built-in EMA 20/200 (you can cut out your existing ema for other indicator slot)
You can adjust Period for Reversal, Volume Moving Average Length and RSI Length that will give result depending on your preference.
🔵 Strict Volume Spike (1.5x)
If ON:
Only accept reversal signals if the current candle's volume is at least 1.5× higher than the average volume.
Purpose: To catch only strong moves supported by big market activity (high participation).
🔵 Strict Wick Size Required
If ON:
Only accept reversal signals if the candle's wick (top or bottom) is larger than the body.
Purpose: To filter signals based on rejection wicks, showing strong rejection from certain prices.
🔵 Strict EMA 200 Trend Filter
If ON:
Only BUY if price is above EMA 200.
Only SELL if price is below EMA 200.
Purpose: To align trades with the big trend for safety (trend-following bias).
🔵 Strict Body Size (30%)
If ON: Accept candles only if their body size is 30% or smaller compared to the entire candle range (high to low).
Purpose: To make sure the reversal candle is small and exhausted, typical behavior before reversals.
🔵 Strict RSI Range (40/60)
If ON:
Only BUY if RSI is below 40 (oversold area).
Only SELL if RSI is above 60 (overbought area).
Purpose: To catch reversals when the market is technically overextended.
Lookback Period for Reversal 20
Check last 20 candles to determine highest high or lowest low (for detecting reversal zones).
Volume Moving Average Length 20
Smooth volume over 20 candles to detect if a candle's volume is "spiking" compared to normal.
RSI Length 14
Standard RSI period; used to measure momentum over last 14 candles for overbought/oversold.

Liquidity Trap Reversal Pro (Radar v2)Liquidity Trap Reversal Pro (Radar v2) is a non-repainting indicator designed to detect hidden liquidity traps at key swing highs and lows. It combines wick analysis, volume spike detection, and optional trend and exhaustion filters to identify high-probability reversal setups.
🔷 Features:
Non-Repainting: Pivots confirmed after lookback period, no future leaking.
Volume Spike Detection: Filters traps that occur during major liquidity events.
EMA Trend Filter (Optional): Focus on traps aligned with the prevailing trend.
Higher Timeframe Trend Filter (Optional): Confirm traps using a higher timeframe EMA bias.
Exhaustion Guard (Optional): Prevents traps after overextended moves based on ATR stretch.
Clean Visuals: Distinct plots for raw trap points vs confirmed traps.
Alerts Included: Set alerts for confirmed high/low liquidity traps.
📚 How to Use:
Watch for Trap Signals:
A Trap High signal suggests a potential bearish reversal.
A Trap Low signal suggests a potential bullish reversal.
Use Confirmed Signals for Best Entries:
Confirmed traps fire only after price moves opposite to the trap direction, adding reliability.
Use Trend Filters to Improve Accuracy:
In an uptrend (price above EMA), prefer Trap Lows (buy setups).
In a downtrend (price below EMA), prefer Trap Highs (sell setups).
Use the Exhaustion Guard to Avoid Bad Trades:
This filter blocks signals when price has moved too far from trend, helping avoid late entries.
Recommended Settings:
Best used on 15-minute, 1-hour, or 4-hour charts.
Trend filter ON for trending markets.
Exhaustion guard ON for volatile or stretched markets.
📈 Important Notes:
This script does not repaint once a pivot is confirmed.
Alerts trigger only on confirmed trap signals.
Always combine signals with sound risk management and trading strategy.
Disclaimer:
This script is for educational purposes only. It is not investment advice or a guarantee of results. Always do your own research before trading.

Zonas Psicológicas Cercanas .XX500Te pinta líneas en el gráfico en las zonas psicológicas 500 más cercanas al precio actual.

August Pump PredictorAugust Pump Predictor is an indicator designed to forecast massive price movements.
