N-Degree Moment-Based Adaptive Detection🙏🏻 N-Degree Moment-Based Adaptive Detection (NDMBAD) method is a generalization of MBAD since the horizontal line fit passing through the data's mean can be simply treated as zero-degree polynomial regression. We can extend the MBAD logic to higher-degree polynomial regression.
I don't think I need to talk a lot about the thing there; the logic is really the same as in MBAD, just hit the link above and read if you want. The only difference is now we can gather cumulants not only from the horizontal mean fit (degree = 0) but also from higher-order polynomial regression fit, including linear regression (degree = 1).
Why?
Simply because residuals from the 0-degree model don't contain trend information, and while in some cases that's exactly what you need, in other cases, you want to model your trend explicitly. Imagine your underlying process trends in a steady manner, and you want to control the extreme deviations from the process's core. If you're going to use 0-degree, you'll be treating this beautiful steady trend as a residual itself, which "constantly deviates from the process mean." It doesn't make much sense.
How?
First, if you set the length to 0, you will end up with the function incrementally applied to all your data starting from bar_index 0. This can be called the expanding window mode. That's the functionality I include in all my scripts lately (where it makes sense). As I said in the MBAD description, choosing length is a matter of doing business & applied use of my work, but I think I'm open to talk about it.
I don't see much sense in using degree > 1 though (still in research on it). If you have dem curves, you can use Fourier transform -> spectral filtering / harmonic regression (regression with Fourier terms). The job of a degree > 0 is to model the direction in data, and degree 1 gets it done. In mean reversion strategies, it means that you don't wanna put 0-degree polynomial regression (i.e., the mean) on non-stationary trending data in moving window mode because, this way, your residuals will be contaminated with the trend component.
By the way, you can send thanks to @aaron294c , he said like mane MBAD is dope, and it's gonna really complement his work, so I decided to drop NDMBAD now, gonna be more useful since it covers more types of data.
I wanned to call it N-Order Moment Adaptive Detection because it abbreviates to NOMAD, which sounds cool and suits me well, because when I perform as a fire dancer, nomad style is one of my outfits. Burning Man stuff vibe, you know. But the problem is degree and order really mean two different things in the polynomial context, so gotta stay right & precise—that's the priority.
∞
Regressions

Automatic Fibonacci Levels with EMAAutomatic Fibonacci Levels with EMA
Description:
This script automatically calculates and displays Fibonacci retracement levels based on the highest and lowest prices over a dynamic lookback period. The Fibonacci levels are recalculated on every bar to adapt to price changes, providing an ongoing analysis of key support and resistance areas.
The Fibonacci levels are dynamically colored to reflect the trend direction, determined by the position of the price relative to the Exponential Moving Average (EMA). When the market is in an uptrend (price above EMA), Fibonacci levels are displayed in green, and in a downtrend (price below EMA), they are shown in red. This color coding helps traders quickly identify the current market direction.
Key Features:
Dynamic Fibonacci Levels: Automatically adjusts Fibonacci retracement levels based on recent price action, recalculated with each new bar.
EMA Trend Confirmation: The trend is confirmed by the position of the price relative to the 20-period EMA. Fibonacci levels are color-coded to reflect this trend.
Customizable Lookback Period: Adjust the base lookback period (default 50) and scale it according to your preferred timeframe for more or less sensitivity to recent price action.
Flexible Fibonacci Duration: The Fibonacci levels remain on the chart for a customizable duration (default 2 bars), allowing for visual clarity while adapting to new price action.
Timeframe Scaling: The script automatically adjusts the lookback period based on a scaling factor, making it suitable for different timeframes.
How to Use:
Use the Fibonacci levels to identify potential support and resistance zones based on the market's current price range.
Combine the trend color coding with your own strategy to enhance decision-making, whether for long or short entries.
Adjust the Lookback Period and Fibonacci Duration based on your trading style and timeframe preferences.
This script provides an automatic and customizable way to visualize Fibonacci retracements in a dynamic manner, helping traders make informed decisions based on trend direction and key price levels.
Note: As with any trading tool, always use proper risk management and test the script before using it in live trading.
SynthesisDeFi - Anchored TWAPA simple Anchored TWAP created by Oliver Fujimori
Key Concept
TWAP is calculated by taking the average of multiple asset prices at regular time intervals across a set period. By averaging out these prices, TWAP helps smooth out short-term fluctuations, providing a more stable price representation over time.
Advantages of TWAP
Simplicity: The TWAP calculation is straightforward and computationally light, making it practical for on-chain calculations in DeFi.
Protection Against Flash Loan Attacks: By averaging prices over time, TWAP offers some protection against temporary price manipulations commonly seen with flash loans.
Uses and Benefits of TWAP
Reducing Market Impact for Large Orders: TWAP is used as a strategy for executing large orders by breaking them into smaller parts over a period, ensuring that the average execution price is close to the TWAP value, reducing the risk of price manipulation.
Minimizing Slippage: In DeFi, TWAP provides a stable price reference by averaging prices over time, making it less susceptible to sudden price changes (slippage) that can occur in highly volatile markets.
Protection Against Manipulation: TWAP prices are less vulnerable to flash loan attacks and sudden price spikes since they rely on multiple price points over a period rather than a single spot price.

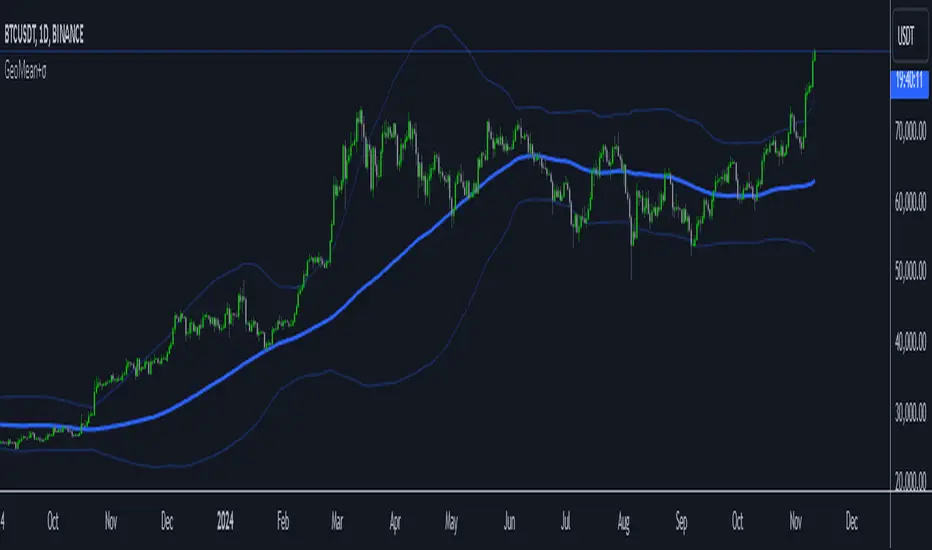
GeoMean+The Geometric Moving Average (GMA) with Sigma Bands is a technical indicator that combines trend following and volatility measurement. The blue center line represents the GMA, while the upper and lower bands (light blue) show price volatility using standard deviations (sigma). Traders can use this indicator for both trend following and mean reversion strategies. For trend following, enter long when price crosses above the GMA and short when it crosses below, using the bands as profit targets. For mean reversion, look for buying opportunities when price touches the lower band and selling opportunities at the upper band, with the GMA as your profit target. The indicator includes alerts for band touches and crosses, providing real-time notifications with symbol, timeframe, current price, and band level information. The default 100-period setting works well for daily charts, but can be adjusted shorter (20-50) for intraday trading or longer (200+) for position trading. Wider bands indicate higher volatility (use smaller positions), while narrower bands suggest lower volatility (larger positions possible). For best results, confirm signals with volume and avoid trading against strong trends. Stop losses can be placed beyond the touched band or at the GMA line, depending on your risk tolerance.
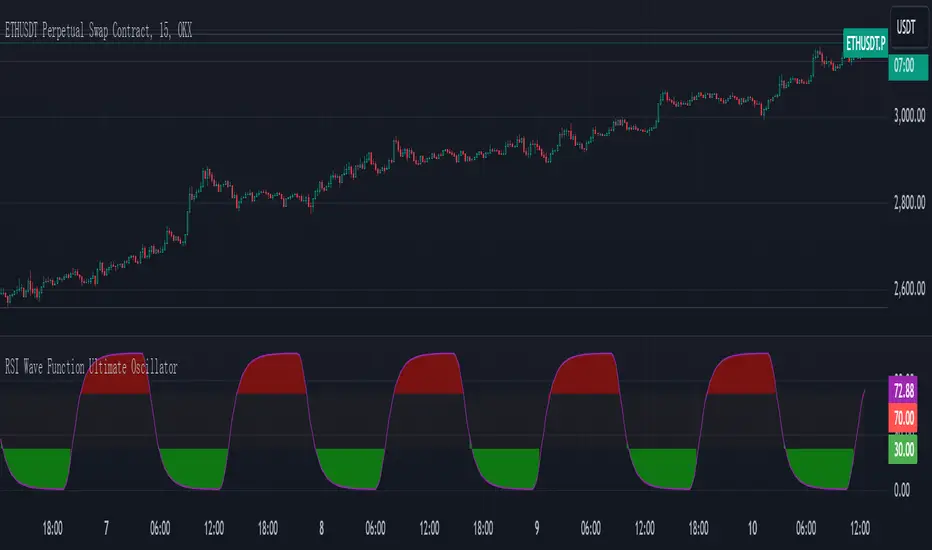
RSI Wave Function Ultimate OscillatorEnglish Explanation of the "RSI Wave Function Ultimate Oscillator" Pine Script Code
Understanding the Code
Purpose:
This Pine Script code creates a custom indicator that combines the Relative Strength Index (RSI) with a wave function to potentially provide more nuanced insights into market dynamics.
Key Components:
* Wave Function: This is a custom calculation that introduces a sinusoidal wave component to the price data. The frequency parameter controls the speed of the oscillation, and the decay factor determines how quickly the influence of past prices diminishes.
* Smoothed Signal: The wave function is applied to the closing price to create a smoothed signal, which is essentially a price series modulated by a sine wave.
* RSI: The traditional RSI is then calculated on this smoothed signal, providing a measure of the speed and change of price movements relative to recent price changes.
Calculation Steps:
* Wave Function Calculation:
* A sinusoidal wave is generated based on the bar index and the frequency parameter.
* The wave is combined with the closing price using a weighted average, where the decay factor determines the weight given to previous values.
* RSI Calculation:
* The RSI is calculated on the smoothed signal using a standard RSI formula.
* Plotting:
* The RSI values are plotted on a chart, along with horizontal lines at 70 and 30 to indicate overbought and oversold conditions.
* The area between the RSI line and the overbought/oversold lines is filled with color to visually represent the market condition.
Interpretation and Usage
* Wave Function: The wave function introduces cyclical patterns into the price data, which can help identify potential turning points or momentum shifts.
* RSI: The RSI provides a measure of the speed and change of price movements relative to recent price changes. When applied to the smoothed signal, it can help identify overbought and oversold conditions, as well as potential divergences between price and momentum.
* Combined Indicator: The combination of the wave function and RSI aims to provide a more sensitive and potentially earlier indication of market reversals.
* Signals:
* Crossovers: Crossovers of the RSI line above or below the overbought/oversold lines can be used to generate buy or sell signals.
* Divergences: Divergences between the price and the RSI can indicate a weakening trend.
* Oscillations: The amplitude and frequency of the oscillations in the RSI can provide insights into the strength and duration of market trends.
How it Reflects Market Volatility
* Amplified Volatility: The wave function can amplify the volatility of the price data, making it easier to identify potential turning points.
* Smoothing: The decay factor helps to smooth out short-term fluctuations, allowing the indicator to focus on longer-term trends.
* Sensitivity: The combination of the wave function and RSI can make the indicator more sensitive to changes in market momentum.
In essence, this custom indicator attempts to enhance traditional RSI analysis by incorporating a cyclical component that can potentially provide earlier signals of market reversals.
Note: The effectiveness of this indicator will depend on various factors, including the specific market, time frame, and the chosen values for the frequency and decay parameters. It is recommended to conduct thorough backtesting and optimize the parameters to suit your specific trading strategy.
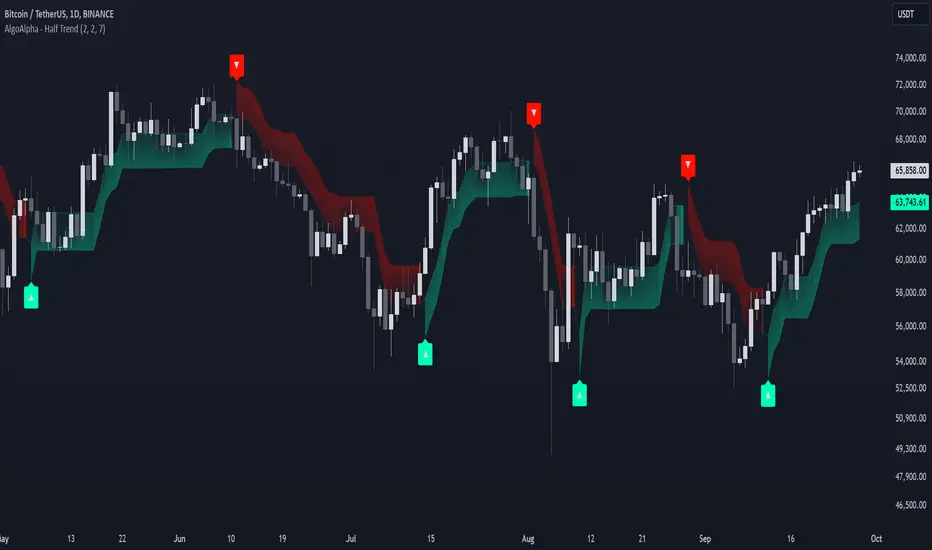
Half Trend Regression [AlgoAlpha]Introducing the Half Trend Regression indicator by AlgoAlpha, a cutting-edge tool designed to provide traders with precise trend detection and reversal signals. This indicator uniquely combines linear regression analysis with ATR-based channel offsets to deliver a dynamic view of market trends. Ideal for traders looking to integrate statistical methods into their analysis to improve trade timing and decision-making.
Key Features
🎨 Customizable Appearance : Adjust colors for bullish (green) and bearish (red) trends to match your charting preferences.
🔧 Flexible Parameters : Configure amplitude, channel deviation, and linear regression length to tailor the indicator to different time frames and trading styles.
📈 Dynamic Trend Line : Utilizes linear regression of high, low, and close prices to calculate a trend line that adapts to market movements.
🚀 Trend Direction Signals : Provides clear visual signals for potential trend reversals with plotted arrows on the chart.
📊 Adaptive Channels : Incorporates ATR-based channel offsets to account for market volatility and highlight potential support and resistance zones.
🔔 Alerts : Set up alerts for bullish or bearish trend changes to stay informed of market shifts in real-time.
How to Use
🛠 Add the Indicator : Add the Half Trend Regression indicator to your chart from the TradingView library. Access the settings to customize parameters such as amplitude, channel deviation, and linear regression length to suit your trading strategy.
📊 Analyze the Trend : Observe the plotted trend line and the filled areas under it. A green fill indicates a bullish trend, while a red fill indicates a bearish trend.
🔔 Set Alerts : Use the built-in alert conditions to receive notifications when a trend reversal is detected, allowing you to react promptly to market changes.
How It Works
The Half Trend Regression indicator calculates linear regression lines for the high, low, and close prices over a specified period to determine the general direction of the market. It then computes moving averages and identifies the highest and lowest points within these regression lines to establish a dynamic trend line. The trend direction is determined by comparing the moving averages and previous price levels, updating as new data becomes available. To account for market volatility, the indicator calculates channels above and below the trend line, offset by a multiple of half the Average True Range (ATR). These channels help visualize potential support and resistance zones. The area under the trend line is filled with color corresponding to the current trend direction—green for bullish and red for bearish. When the trend direction changes, the indicator plots arrows on the chart to signal a potential reversal, and alerts can be set up to notify you. By integrating linear regression and ATR-based channels, the indicator provides a comprehensive view of market trends and potential reversal points, aiding traders in making informed decisions.
Enhance your trading strategy with the Half Trend Regression indicator by AlgoAlpha and gain a statistical edge in the markets! 🌟📊
Linear Regression Channel UltimateKey Features and Benefits
Logarithmic scale option for improved analysis of long-term trends and volatile markets
Activity-based profiling using either touch count or volume data
Customizable channel width and number of profile fills
Adjustable number of most active levels displayed
Highly configurable visual settings for optimal chart readability
Why Logarithmic Scale Matters
The logarithmic scale option is a game-changer for analyzing assets with exponential growth or high volatility. Unlike linear scales, log scales represent percentage changes consistently across the price range. This allows for:
Better visualization of long-term trends
More accurate comparison of price movements across different price levels
Improved analysis of volatile assets or markets experiencing rapid growth
How It Works
The indicator calculates a linear regression line based on the specified period
Upper and lower channel lines are drawn at a customizable distance from the regression line
The space between the channel lines is divided into a user-defined number of levels
For each level, the indicator tracks either:
- The number of times price touches the level (touch count method)
- The total volume traded when price is at the level (volume method)
The most active levels are highlighted based on this activity data
Understanding Touch Count vs Volume
Touch count method: Useful for identifying key support/resistance levels based on price action alone
Volume method: Provides insight into levels where the most trading activity occurs, potentially indicating stronger support/resistance
Practical Applications
Trend identification and strength assessment
Support and resistance level discovery
Entry and exit point optimization
Volume profile analysis for improved market structure understanding
This Linear Regression Channel indicator combines powerful statistical analysis with flexible visualization options, making it an invaluable tool for traders and analysts across various timeframes and markets. Its unique features, especially the logarithmic scale and activity profiling, provide deeper insights into market behavior and potential turning points.

Alpine Predictive BandsAlpine Predictive Bands - ADX & Trend Projection is an advanced indicator crafted to estimate potential price zones and trend strength by integrating dynamic support/resistance bands, ADX-based confidence scoring, and linear regression-based price projections. Designed for adaptive trend analysis, this tool combines multi-timeframe ADX insights, volume metrics, and trend alignment for improved confidence in trend direction and reliability.
Key Calculations and Components:
Linear Regression for Price Projection:
Purpose: Provides a trend-based projection line to illustrate potential price direction.
Calculation: The Linear Regression Centerline (LRC) is calculated over a user-defined lookbackPeriod. The slope, representing the rate of price movement, is extended forward using predictionLength. This projected path only appears when the confidence score is 70% or higher, revealing a white dotted line to highlight high-confidence trends.
Adaptive Prediction Bands:
Purpose: ATR-based bands offer dynamic support/resistance zones by adjusting to volatility.
Calculation: Bands are calculated using the Average True Range (ATR) over the lookbackPeriod, multiplied by a volatilityMultiplier to adjust the width. These shaded bands expand during higher volatility, guiding traders in identifying flexible support/resistance zones.
Confidence Score (ADX, Volume, and Trend Alignment):
Purpose: Reflects the reliability of trend projections by combining ADX, volume status, and EMA alignment across multiple timeframes.
ADX Component: ADX values from the current timeframe and two higher timeframes assess trend strength on a broader scale. Strong ADX readings across timeframes boost the confidence score.
Volume Component: Volume strength is marked as “High” or “Low” based on a moving average, signaling trend participation.
Trend Alignment: EMA alignment across timeframes indicates “Bullish” or “Bearish” trends, confirming overall trend direction.
Calculation: ADX, volume, and trend alignment integrate to produce a confidence score from 0% to 100%. When the score exceeds 70%, the white projection line is activated, underscoring high-confidence trend continuations.
User Guide
Projection Line: The white dotted line, which appears only when the confidence score is 70% or higher, highlights a high-confidence trend.
Prediction Bands: Adaptive bands provide potential support/resistance zones, expanding with market volatility to help traders visualize price ranges.
Confidence Score: A high score indicates a stronger, more reliable trend and can support trend-following strategies.
Settings
Prediction Length: Determines the forward length of the projection.
Lookback Period: Sets the data range for calculating regression and ATR.
Volatility Multiplier: Adjusts the width of bands to match volatility levels.
Disclaimer: This indicator is for educational purposes and does not guarantee future price outcomes. Additional analysis is recommended, as trading carries inherent risks.

Linear Regression Zscore | QuantumResearch Linear Regression Z-Score Indicator by Rocheur
The Linear Regression Z-Score Indicator developed by Rocheur is a robust technical analysis tool that combines valuation through Z-score analysis with trend detection . This indicator is designed to provide traders with a comprehensive understanding of both price extremities and trend strength. It is highly customizable, allowing users to adjust visual and calculation settings to suit their specific trading styles and asset classes.
1. Visual Settings
The indicator offers flexibility in how it displays its outputs through customizable visual settings. Users can choose from a variety of color modes that modify the appearance of the bullish and bearish signals. Additionally, there are two key visual modes :
Valuation Mode : Highlights price movements based on the Z-score, using a color gradient to show the magnitude of price deviation from its mean.
Trend Mode : Displays the overall market trend, coloring bullish trends in one color (typically green) and bearish trends in another (usually red).
These visual options allow traders to tailor the indicator to match their charting preferences, making it easier to interpret key signals quickly.
2. Indicator Settings
Users can modify key calculation parameters to fit their trading needs:
Length : This setting defines the lookback period used for calculating the linear regression line, which reflects the overall market trend. A longer length provides a smoother trendline, whereas a shorter length makes the indicator more responsive to price changes.
Offset : The offset shifts the calculation by a specified number of bars, which can help traders in certain backtesting scenarios.
These settings ensure that the indicator is adaptable to different trading strategies, whether you prefer short-term or long-term market analysis.
3. Threshold Settings
The indicator allows users to set upper and lower thresholds that help define overbought and oversold conditions:
Upper Threshold : When the Z-score exceeds this level, it indicates that the price may be overbought, signaling a potential reversal or selling opportunity.
Lower Threshold : If the Z-score falls below this value, it indicates that the price may be oversold, signaling a possible buying opportunity.
These thresholds can be customized depending on the asset’s volatility, providing flexibility to traders based on their risk tolerance and market conditions.
4. Z-Score Calculation
The heart of the indicator is its calculation of the Z-score , a measure of price deviation from its mean, adjusted for volatility. This Z-score is derived from three key components:
Linear Regression : The indicator uses a linear regression line to assess the overall trend in the market over a specific period.
Mean : The use of a moving average smooths the linear regression line, calculating the average price over a longer period. This ensures that the Z-score is calculated relative to the asset's historical average.
Standard Deviation : The standard deviation measures price volatility, allowing the indicator to adjust for the magnitude of price swings relative to the trend.
The resulting Z-score shows how far the price has moved from its mean in terms of standard deviations. A positive Z-score indicates that the price is above the mean, while a negative Z-score shows that the price is below the mean. This provides traders with insights into whether an asset is overbought or oversold.
5. Scoring System
The indicator employs a simple scoring mechanism to determine whether the market is in a bullish or bearish state:
Bullish Trend : When the Z-score is above the upper threshold, the indicator assigns a score of 1, signaling a potential buying opportunity.
Bearish Trend : When the Z-score falls below the lower threshold, the score is set to -1, indicating a potential selling opportunity.
This scoring system helps simplify trend detection by categorizing market conditions into clear bullish or bearish states, making it easier for traders to follow trends.
6. Plotting and Visualization
The indicator uses dynamic color gradients to visualize the Z-score and its corresponding trend on the chart:
Gradient Visualization : When the Z-score is positive (above zero), the color gradient moves from neutral to bright, indicating the strength of the trend. Similarly, when the Z-score is negative, the color gradient shifts from neutral to darker tones, highlighting bearish trends.
Trend Color Coding : In Trend Mode , the bars are colored based on the score. If the score is positive (bullish), the bars are colored in one shade (usually green). If the score is negative (bearish), the bars take on a different shade (typically red).
This color-based visualization simplifies interpreting market movements, allowing traders to quickly identify whether the market is trending up or down.
7. Range Highlights and Visual Aids
To aid in analysis, the indicator includes range highlights at key Z-score levels:
Highlighted Zones : The indicator highlights specific Z-score ranges (such as +1.5 and -1.5), which indicate strong overbought or oversold conditions. These zones help traders visually grasp when the price is reaching an extreme, signaling potential reversal points.
These visual aids ensure that traders can quickly detect critical price levels and make more informed trading decisions.
8. Strategic Value and Advantages
The Linear Regression Z-Score Indicator offers several strategic advantages for traders:
Combines Valuation and Trend Detection : The dual functionality of this indicator makes it a powerful tool for identifying both overbought/oversold conditions and trend direction. This combination allows traders to assess the market holistically and make better-timed trades.
Precision in Detecting Market Extremes : The Z-score calculation provides a clear measure of how far the price has moved from its historical average, giving traders a precise tool for detecting price extremes and potential turning points.
Adaptability Across Markets : This indicator works across multiple asset classes and timeframes, making it suitable for stocks, forex, commodities, and cryptocurrencies. Whether you are a day trader, swing trader, or long-term investor, this tool can be tailored to your strategy.
Customizable for Risk Profiles : The ability to adjust thresholds, length, and visual settings means that traders can fine-tune the indicator to align with their risk tolerance and market conditions.
Enhanced Trend-Following : In strong trending markets, this indicator helps traders stay aligned with the broader market movement. The scoring system ensures that traders don’t exit trades too early by filtering out minor price fluctuations and focusing on sustained trends.
Note:
Backtests are based on past results and are not indicative of future performance.
Conclusion
The Linear Regression Z-Score Indicator by Rocheur is a versatile, powerful tool that provides both valuation insights and trend detection in one package. Its customization options make it suitable for a wide range of trading strategies and market conditions. The indicator’s dynamic color visualization and scoring system simplify market analysis, helping traders make informed decisions in real-time. By integrating valuation extremes with trend direction, this indicator enhances a trader’s ability to identify optimal entry and exit points, making it a valuable addition to any trading toolkit.

Chande Momentum Oscillator StrategyThe Chande Momentum Oscillator (CMO) Trading Strategy is based on the momentum oscillator developed by Tushar Chande in 1994. The CMO measures the momentum of a security by calculating the difference between the sum of recent gains and losses over a defined period. The indicator offers a means to identify overbought and oversold conditions, making it suitable for developing mean-reversion trading strategies (Chande, 1997).
Strategy Overview:
Calculation of the Chande Momentum Oscillator (CMO):
The CMO formula considers both positive and negative price changes over a defined period (commonly set to 9 days) and computes the net momentum as a percentage.
The formula is as follows:
CMO=100×(Sum of Gains−Sum of Losses)(Sum of Gains+Sum of Losses)
CMO=100×(Sum of Gains+Sum of Losses)(Sum of Gains−Sum of Losses)
This approach distinguishes the CMO from other oscillators like the RSI by using both price gains and losses in the numerator, providing a more symmetrical measurement of momentum (Chande, 1997).
Entry Condition:
The strategy opens a long position when the CMO value falls below -50, signaling an oversold condition where the price may revert to the mean. Research in mean-reversion, such as by Poterba and Summers (1988), supports this approach, highlighting that prices often revert after sharp movements due to overreaction in the markets.
Exit Conditions:
The strategy closes the long position when:
The CMO rises above 50, indicating that the price may have become overbought and may not provide further upside potential.
Alternatively, the position is closed 5 days after the buy signal is triggered, regardless of the CMO value, to ensure a timely exit even if the momentum signal does not reach the predefined level.
This exit strategy aligns with the concept of time-based exits, reducing the risk of prolonged exposure to adverse price movements (Fama, 1970).
Scientific Basis and Rationale:
Momentum and Mean-Reversion:
The strategy leverages the well-known phenomenon of mean-reversion in financial markets. According to research by Jegadeesh and Titman (1993), prices tend to revert to their mean over short periods following strong movements, creating opportunities for traders to profit from temporary deviations.
The CMO captures this mean-reversion behavior by monitoring extreme price conditions. When the CMO reaches oversold levels (below -50), it signals potential buying opportunities, whereas crossing overbought levels (above 50) indicates conditions for selling.
Market Efficiency and Overreaction:
The strategy takes advantage of behavioral inefficiencies and overreactions, which are often the drivers behind sharp price movements (Shiller, 2003). By identifying these extreme conditions with the CMO, the strategy aims to capitalize on the market’s tendency to correct itself when price deviations become too large.
Optimization and Parameter Selection:
The 9-day period used for the CMO calculation is a widely accepted timeframe that balances responsiveness and noise reduction, making it suitable for capturing short-term price fluctuations. Studies in technical analysis suggest that oscillators optimized over such periods are effective in detecting reversals (Murphy, 1999).
Performance and Backtesting:
The strategy's effectiveness is confirmed through backtesting, which shows that using the CMO as a mean-reversion tool yields profitable opportunities. The use of time-based exits alongside momentum-based signals enhances the reliability of the strategy by ensuring that trades are closed even when the momentum signal alone does not materialize.
Conclusion:
The Chande Momentum Oscillator Trading Strategy combines the principles of momentum measurement and mean-reversion to identify and capitalize on short-term price fluctuations. By using a widely tested oscillator like the CMO and integrating a systematic exit approach, the strategy effectively addresses both entry and exit conditions, providing a robust method for trading in diverse market environments.
References:
Chande, T. S. (1997). The New Technical Trader: Boost Your Profit by Plugging into the Latest Indicators. John Wiley & Sons.
Fama, E. F. (1970). Efficient Capital Markets: A Review of Theory and Empirical Work. The Journal of Finance, 25(2), 383-417.
Jegadeesh, N., & Titman, S. (1993). Returns to Buying Winners and Selling Losers: Implications for Stock Market Efficiency. The Journal of Finance, 48(1), 65-91.
Murphy, J. J. (1999). Technical Analysis of the Financial Markets: A Comprehensive Guide to Trading Methods and Applications. New York Institute of Finance.
Poterba, J. M., & Summers, L. H. (1988). Mean Reversion in Stock Prices: Evidence and Implications. Journal of Financial Economics, 22(1), 27-59.
Shiller, R. J. (2003). From Efficient Markets Theory to Behavioral Finance. Journal of Economic Perspectives, 17(1), 83-104.

Ultimate Oscillator Trading StrategyThe Ultimate Oscillator Trading Strategy implemented in Pine Script™ is based on the Ultimate Oscillator (UO), a momentum indicator developed by Larry Williams in 1976. The UO is designed to measure price momentum over multiple timeframes, providing a more comprehensive view of market conditions by considering short-term, medium-term, and long-term trends simultaneously. This strategy applies the UO as a mean-reversion tool, seeking to capitalize on temporary deviations from the mean price level in the asset’s movement (Williams, 1976).
Strategy Overview:
Calculation of the Ultimate Oscillator (UO):
The UO combines price action over three different periods (short-term, medium-term, and long-term) to generate a weighted momentum measure. The default settings used in this strategy are:
Short-term: 6 periods (adjustable between 2 and 10).
Medium-term: 14 periods (adjustable between 6 and 14).
Long-term: 20 periods (adjustable between 10 and 20).
The UO is calculated as a weighted average of buying pressure and true range across these periods. The weights are designed to give more emphasis to short-term momentum, reflecting the short-term mean-reversion behavior observed in financial markets (Murphy, 1999).
Entry Conditions:
A long position is opened when the UO value falls below 30, indicating that the asset is potentially oversold. The value of 30 is a common threshold that suggests the price may have deviated significantly from its mean and could be due for a reversal, consistent with mean-reversion theory (Jegadeesh & Titman, 1993).
Exit Conditions:
The long position is closed when the current close price exceeds the previous day’s high. This rule captures the reversal and price recovery, providing a defined point to take profits.
The use of previous highs as exit points aligns with breakout and momentum strategies, as it indicates sufficient strength for a price recovery (Fama, 1970).
Scientific Basis and Rationale:
Momentum and Mean-Reversion:
The strategy leverages two well-established phenomena in financial markets: momentum and mean-reversion. Momentum, identified in earlier studies like those by Jegadeesh and Titman (1993), describes the tendency of assets to continue in their direction of movement over short periods. Mean-reversion, as discussed by Poterba and Summers (1988), indicates that asset prices tend to revert to their mean over time after short-term deviations. This dual approach aims to buy assets when they are temporarily oversold and capitalize on their return to the mean.
Multi-timeframe Analysis:
The UO’s incorporation of multiple timeframes (short, medium, and long) provides a holistic view of momentum, unlike single-period oscillators such as the RSI. By combining data across different timeframes, the UO offers a more robust signal and reduces the risk of false entries often associated with single-period momentum indicators (Murphy, 1999).
Trading and Market Efficiency:
Studies in behavioral finance, such as those by Shiller (2003), show that short-term inefficiencies and behavioral biases can lead to overreactions in the market, resulting in price deviations. This strategy seeks to exploit these temporary inefficiencies, using the UO as a signal to identify potential entry points when the market sentiment may have overly pushed the price away from its average.
Strategy Performance:
Backtests of this strategy show promising results, with profit factors exceeding 2.5 when the default settings are optimized. These results are consistent with other studies on short-term trading strategies that capitalize on mean-reversion patterns (Jegadeesh & Titman, 1993). The use of a dynamic, multi-period indicator like the UO enhances the strategy’s adaptability, making it effective across different market conditions and timeframes.
Conclusion:
The Ultimate Oscillator Trading Strategy effectively combines momentum and mean-reversion principles to trade on temporary market inefficiencies. By utilizing multiple periods in its calculation, the UO provides a more reliable and comprehensive measure of momentum, reducing the likelihood of false signals and increasing the profitability of trades. This aligns with modern financial research, showing that strategies based on mean-reversion and multi-timeframe analysis can be effective in capturing short-term price movements.
References:
Fama, E. F. (1970). Efficient Capital Markets: A Review of Theory and Empirical Work. The Journal of Finance, 25(2), 383-417.
Jegadeesh, N., & Titman, S. (1993). Returns to Buying Winners and Selling Losers: Implications for Stock Market Efficiency. The Journal of Finance, 48(1), 65-91.
Murphy, J. J. (1999). Technical Analysis of the Financial Markets: A Comprehensive Guide to Trading Methods and Applications. New York Institute of Finance.
Poterba, J. M., & Summers, L. H. (1988). Mean Reversion in Stock Prices: Evidence and Implications. Journal of Financial Economics, 22(1), 27-59.
Shiller, R. J. (2003). From Efficient Markets Theory to Behavioral Finance. Journal of Economic Perspectives, 17(1), 83-104.
Williams, L. (1976). Ultimate Oscillator. Market research and technical trading analysis.

CoffeeShopCrytpo Dynamic PPIIn the financial world, the Producer Price Index (PPI) is often used to measure how domestic products are performing over time, indicating the health of the market. Domestic products refer to goods and services that are produced within a specific country’s borders. However, in this indicator, we’ve taken that idea and applied it directly to financial assets, allowing traders to see how an asset is performing relative to its own base value over a given period of time.
Here, the asset’s base value is represented as 100%. When the asset performs above 100%, it's considered to be in a buyer's market—indicating strength and demand. Conversely, if the value dips below 100%, it's operating below its base value, signaling a potential seller's market.
Why This Matters:
This indicator not only converts an asset’s performance into a PPI-style calculation, but it also visualizes price movements as price candles. This dual perspective is crucial, because even if the asset’s performance is over 100%, the closing price might still fall below that threshold—adding nuance to your understanding of market conditions.
Key Features of the Indicator:
Bullish and Bearish Convergence Levels: These levels show whether the market leans bullish or bearish. If the Bullish Convergence level is higher than the Bearish one, the market is bullish, and vice versa. Importantly, these levels can signal shifts in market strength, regardless of where the PPI candles are positioned.
If Bullish Convergence is rising below Bearish, the bearish market is weakening and bullish pressure is growing. Conversely, if Bearish Convergence is falling above Bullish, the bearish side is losing ground.
Market Strength Visualizations:
Strong Bullish Market: Bullish Convergence is higher than Bearish, and it’s still rising.
Strong Bearish Market: Bearish Convergence is above Bullish, and it's climbing.
Weak Bullish Market: Bullish Convergence is above Bearish, but the PPI closes below Bullish Convergence.
Weak Bearish Market: Bearish Convergence is above Bullish, but the PPI closes above Bullish Convergence
Pullbacks:
Bullish Pullback: In a strong bullish market, the PPI shows lower closes below the Bullish Convergence.
Bearish Pullback: In a strong bearish market, the PPI shows higher closes above the Bullish Convergence.
Divergences:
Higher Price, Lower or Flat PPI: This indicates that while the asset’s price is rising, its underlying performance (relative to the PPI’s 100% base level) is not keeping up. Essentially, the asset is reaching new price highs, but its strength or "efficiency" of growth is weakening.
The PPI is designed to show the "return" of an asset's performance relative to its historical movement, so when it lags behind price, it suggests that the price rise may not be sustainable.
When you observe the first high of the PPI level above the bullish convergence level, followed by a second high of the PPI below the bullish convergence level in a bullish market, this creates a divergence.
Example of Divergence in image:
1. First High of PPI Above the Bullish Convergence Level:
This suggests strong bullish momentum. The asset’s performance, as measured by the PPI, is in line with or even outperforming price expectations, indicating the market is experiencing a robust bullish trend. The fact that the PPI level is above the bullish convergence line means that the asset is operating well above its base performance (above 100%) and bullish momentum is clearly dominant.
2. Second High of PPI Below the Bullish Convergence Level:
This marks a potential weakening of the bullish momentum. Although the market is still in a bullish state (since bullish convergence remains above bearish), the PPI failing to reach the bullish convergence level suggests that the asset’s performance is not keeping pace with price action or is underperforming relative to its earlier high.
The fact that this occurs while the market is still bullish (bullish convergence is greater than bearish) can signal a possible pullback or a temporary consolidation phase within the larger bullish trend.
What does a divergence mean:
Momentum Weakening: The second high of the PPI being below the bullish convergence line suggests that while prices may still be increasing, the strength behind the move is fading. The asset is not performing as strongly as it did during the first high, and the market’s confidence or momentum might be softening.
Potential Bullish Pullback: This could indicate that a pullback or correction within the larger bullish trend is underway. Traders might be taking profits, or buyers could be losing enthusiasm, causing the asset to stall temporarily. However, because the overall market remains bullish, this doesn’t necessarily mean a full reversal—just a cooling off period.
Caution in New Long Positions: If you see this divergence, it could be a sign to be more cautious about opening new long positions. It suggests that the asset may need to consolidate or correct before resuming its upward trend, and it’s worth waiting for confirmation of renewed momentum before jumping back in.
ATR Settings
Youll notice there are two ATR settings. One for short term and one for long term.
These values are based on your preferential strategy for what you consider to be long and short term.
The final ATR values are calculated against eachother and applied to the Volatility Label at the end of price.
This label shows you the current ATR as well as the previous candle ATR.
Why this is important:
If the short term ATR is greater than the long term ATR, then volatility is rising in the short term greater than the long term.
This gives your label a value greater than 1.0. This means the short term trend is about to move.
If the long term ATR is greater than the short term ATR, there is no volatility in the short term and only long term exists.
This gives you a value of less than 1.0. This means no volatility or ranging market in the short term.

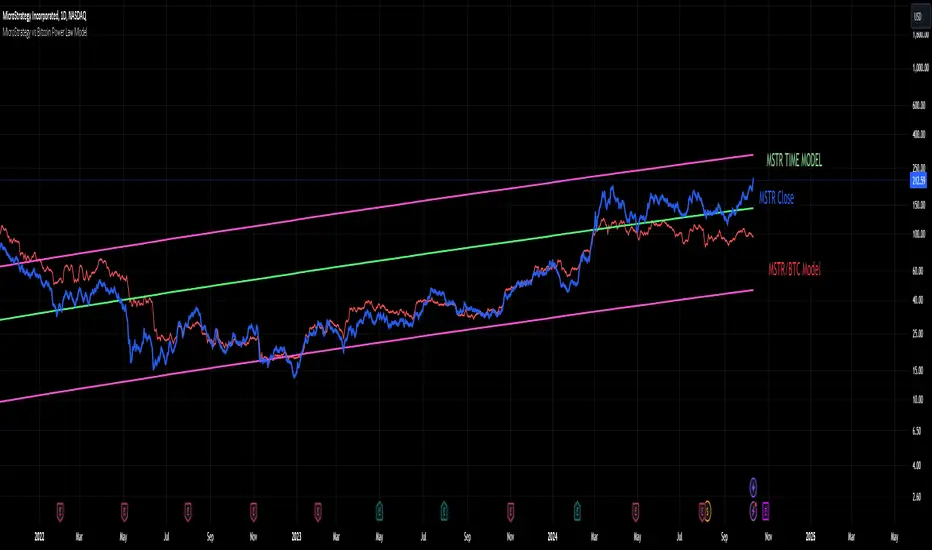
MicroStrategy vs Bitcoin Power Law Model
This indicator provides a powerful tool for investors by modeling the relationship between MicroStrategy (MSTR) and Bitcoin (BTC) based on an observed power law correlation since August 2020, when MSTR adopted Bitcoin as its core investment strategy. The primary objective of the indicator is to identify areas where MSTR is overvalued or undervalued relative to BTC, offering investors crucial insights for making informed decisions.
Step-by-Step Creation Process:
Data Collection:
The indicator begins by gathering historical price data for both MSTR and BTC starting from August 2020. This period is significant as it marks MSTR’s strategic shift toward Bitcoin acquisition.
Power Law Analysis:
A power law relationship between MSTR and BTC is computed using a power of 1.3. This relationship models the price behavior of MSTR relative to BTC, providing a framework to track where MSTR’s price deviates from its expected value based on BTC's movements.
MSTR Price Model:
The MSTR price model based on this power law is then plotted against the actual price of MSTR. This allows investors to visualize areas where MSTR is potentially overvalued or undervalued relative to BTC.
Overvaluation is highlighted when the actual MSTR price exceeds the power law-based price, while undervaluation is noted when it falls below.
Time-Based Power Law Model:
Additionally, the indicator integrates a time-based model for MSTR, which shows that MSTR follows its own power law over time with a higher slope than BTC (7.2 vs. 5.8). This comparison provides further context, showing how MSTR's growth rate differs from BTC’s over time.
Oscillator Inclusion:
To complement the price models, an oscillator is added, which tracks the difference between the MSTR power law and the BTC power law. This oscillator helps visualize and quantify the divergence between the two, offering a clearer picture of periods where MSTR is performing above or below expectations compared to BTC.
Indicator Usefulness:
Overvaluation and Undervaluation Detection: By comparing MSTR’s current price against its expected power law-based price, investors can easily identify potential entry and exit points. When MSTR is overvalued relative to BTC, it may signal an opportunity to sell or reduce exposure. Conversely, undervaluation may suggest a buying opportunity.
Time-Based Growth Comparisons: The time-based power law model shows how MSTR has been growing relative to Bitcoin over time. This helps investors understand whether MSTR is outperforming or underperforming BTC in the long run.
Divergence Oscillator: The oscillator provides an intuitive way to gauge whether MSTR is significantly diverging from BTC’s growth trajectory, offering an additional signal to guide investment decisions.
Projections to the future
Projections of the MSTR power law to 500 days ahead is also included.
Why is this Indicator Useful for Investors?
This indicator offers a comprehensive view of how MSTR’s price behavior correlates with Bitcoin. By leveraging the power law relationship, it provides insight into whether MSTR is priced appropriately relative to BTC, which is especially valuable for those with exposure to both assets. The oscillator further refines this analysis by highlighting periods of divergence, offering potential trading opportunities based on relative value.
Volume-Supported Linear Regression Trend TableThe "Volume-Supported Linear Regression Trend Table" (VSLRT Table) script helps traders identify buy and sell opportunities by analyzing price trends and volume dynamics across multiple timeframes. It uses linear regression to calculate the trend direction and volume strength, visually representing this data with color-coded signals on the chart and in a table. Green signals indicate buying opportunities, while red signals suggest selling, with volume acting as confirmation of trend strength. Traders can use these signals for both short and long positions, with additional risk management and multi-timeframe validation to enhance the strategy.
------------------------------------------------------------------------------
To use the "Volume-Supported Linear Regression Trend Table" (VSLRT Table) script in a trading strategy, you would incorporate it into your decision-making process to identify potential buy and sell opportunities based on the trend and volume dynamics. Here’s how you could apply it for trading:
1. Understanding the Key Elements:
Trend Direction (Slope of Price): The script uses linear regression to assess the trend direction of the price. If the price slope is positive, the asset is likely in an uptrend; if it's negative, the asset is in a downtrend.
Volume-Backed Signals: The buy or sell signal is not only based on the price trend but also on volume. Volume is crucial in validating the strength of a trend; large volume often indicates strong interest in a direction.
2. Interpreting the Table and Signals:
The table displayed at the bottom-right of your TradingView chart gives you a clear overview of the trends across different timeframes:
Trend Colors:
Green hues (e.g., ccol11, ccol12, etc.): Indicate a buying trend supported by volume.
Red hues (e.g., ccol21, ccol22, etc.): Indicate a selling trend supported by volume.
Gray: Indicates weak or unclear trends where no decisive direction is present.
Buy/Sell Signals:
The script plots triangles on the chart:
Upward triangle below the bar signals a potential buy.
Downward triangle above the bar signals a potential sell.
3. Building a Trading Strategy:
Here’s how you can incorporate the script’s information into a trading strategy:
Buy Signal (Long Entry):
Look for green triangles (indicating a buy signal) below a bar.
Confirm that the trend color in the table for the relevant timeframe is green, which shows that the buy signal is supported by strong volume.
Ensure that the price is in an uptrend (positive slope) and that volume is increasing on upward moves, as this indicates buying interest.
Execute a long position when these conditions align.
Sell Signal (Short Entry):
Look for red triangles (indicating a sell signal) above a bar.
Confirm that the trend color in the table for the relevant timeframe is red, which shows that the sell signal is supported by strong volume.
Ensure that the price is in a downtrend (negative slope) and that volume is increasing on downward moves, indicating selling pressure.
Execute a short position when these conditions align.
Exiting the Trade:
Exit a long position when a sell signal (red triangle) appears, or when the trend color in the table shifts to red.
Exit a short position when a buy signal (green triangle) appears, or when the trend color in the table shifts to green.
4. Multi-Timeframe Confirmation:
The script provides trends across multiple timeframes (tf1, tf2, tf3), which can help in validating your trade:
Short-Term Trading: Use shorter timeframes (e.g., 3, 5 minutes) for intraday trades. If both short and medium timeframes align in trend direction (e.g., both showing green), it strengthens the signal.
Longer-Term Trading: If you are trading on a higher timeframe (e.g., daily or weekly), confirm that the lower timeframes align with your intended trade direction.
5. Adding Risk Management:
Stop-Loss: Place stop-losses below recent lows (for long trades) or above recent highs (for short trades) to minimize risk.
Take Profit: Consider taking profit at key support/resistance levels or based on a fixed risk-to-reward ratio (e.g., 2:1).
Example Strategy Flow:
For Long (Buy) Trade:
Signal: A green triangle appears below a candle (Buy signal).
Trend Confirmation: Check that the color in the table for your selected timeframe is green, confirming the trend is supported by volume.
Execute Long: Enter a long trade if the price is trending upward (positive price slope).
Exit Long: Exit when a red triangle appears above a candle (Sell signal) or if the trend color shifts to red in the table.
For Short (Sell) Trade:
Signal: A red triangle appears above a candle (Sell signal).
Trend Confirmation: Check that the color in the table for your selected timeframe is red, confirming the trend is supported by volume.
Execute Short: Enter a short trade if the price is trending downward (negative price slope).
Exit Short: Exit when a green triangle appears below a candle (Buy signal) or if the trend color shifts to green in the table.
6. Fine-Tuning:
Backtesting: Before trading live, use TradingView’s backtesting features to test the strategy on historical data and optimize the settings (e.g., length of linear regression, timeframe).
Combine with Other Indicators: Use this strategy alongside other technical indicators (e.g., RSI, MACD) for better confirmation.
In summary, the script helps identify trends with volume support, giving more confidence in buy/sell decisions. Combining these signals with risk management and multi-timeframe analysis can create a solid trading strategy.

Linear Regression ChannelLinear Regression Channel Indicator
Overview:
The Linear Regression Channel Indicator is a versatile tool designed for TradingView to help traders visualize price trends and potential reversal points. By calculating and plotting linear regression channels, bands, and future projections, this indicator provides comprehensive insights into market dynamics. It can highlight overbought and oversold conditions, identify trend direction, and offer visual cues for future price movements.
Key Features:
Linear Regression Bands:
Input: Plot Linear Regression Bands
Description: Draws bands based on linear regression calculations, representing overbought and oversold levels.
Customizable Parameters:
Length: Defines the look-back period for the regression calculation.
Deviation: Determines the width of the bands based on standard deviations.
Linear Regression Channel:
Input: Plot Linear Regression Channel
Description: Plots a channel using linear regression to visualize the main trend.
Customizable Parameters:
Channel Length: Defines the look-back period for the channel calculation.
Deviation: Determines the channel's width.
Future Projection Channel:
Input: Plot Future Projection of Linear Regression
Description: Projects a linear regression channel into the future, aiding in forecasting potential price movements.
Customizable Parameters:
Length: Defines the look-back period for the projection calculation.
Deviation: Determines the width of the projected channel.
Arrow Direction Indicator:
Input: Plot Arrow Direction
Description: Displays directional arrows based on future projection, indicating expected price movement direction.
Color-Coded Price Bars:
Description: Colors the price bars based on their position within the regression bands or channel, providing a heatmap-like visualization.
Dynamic Visualization:
Colors: Uses a gradient color scheme to highlight different conditions, such as uptrend, downtrend, and mid-levels.
Labels and Markers: Plots visual markers for significant price levels and conditions, enhancing interpretability.
Usage Notes
Setting the Length:
Adjust the look-back period (Length) to suit the timeframe you are analyzing. Shorter lengths are responsive to recent price changes, while longer lengths provide a broader view of the trend.
Interpreting Bands and Channels:
The bands and channels help identify overbought and oversold conditions. Price moving above the upper band or channel suggests overbought conditions, while moving below the lower band or channel indicates oversold conditions.
Using the Future Projection:
Enable the future projection channel to anticipate potential price movements. This can be particularly useful for setting target prices or stop-loss levels based on expected trends.
Arrow Direction Indicator:
Use the arrow direction indicator to quickly grasp the expected price movement direction. An upward arrow indicates a potential uptrend, while a downward arrow suggests a potential downtrend.
Color-Coded Price Bars:
The color of the price bars changes based on their relative position within the regression bands or channel. This heatmap visualization helps quickly identify bullish, bearish, and neutral conditions.
Dynamic Adjustments:
The indicator dynamically adjusts its visual elements based on user settings and market conditions, ensuring that the most relevant information is always displayed.
Visual Alerts:
Pay attention to the labels and markers on the chart indicating significant events, such as crossovers and breakouts. These visual alerts help in making informed trading decisions.
The Linear Regression Channel Indicator is a powerful tool for traders looking to enhance their technical analysis. By offering multiple regression-based visualizations and customizable parameters, it helps identify key market conditions, trends, and potential reversal points. Whether you are a day trader or a long-term investor, this indicator can provide valuable insights to improve your trading strategy.

Leading Indicator by Parag RautBreakdown of the Leading Indicator:
Linear Regression (LRC):
A linear regression line is used to estimate the current trend direction. When the price is above or below the regression line, it indicates whether the price is deviating from its mean, signaling potential reversals.
Rate of Change (ROC):
ROC measures the momentum of the price over a set period. By using thresholds (positive or negative), we predict that the price will continue in the same direction if momentum is strong enough.
Leading Indicator Calculation:
We calculate the difference between the price and the linear regression line. This is normalized using the standard deviation of price over the same period, giving us a leading signal based on price divergence from the mean trend.
The leading indicator is used to forecast changes in price behavior by identifying when the price is either stretched too far from the mean (indicating a potential reversal) or showing strong momentum in a particular direction (predicting trend continuation).
Buy and Sell Signals:
Buy Signal: Generated when ROC is above a threshold and the leading indicator shows the price is above the regression line.
Sell Signal: Generated when ROC is below a negative threshold and the leading indicator shows the price is below the regression line.
Visual Representation:
The indicator oscillates around zero. Values above zero signal potential upward price movements, while values below zero signal potential downward movements.
Background colors highlight potential buy (green) and sell (red) areas based on our conditions.
How It Works as a Leading Indicator:
This indicator attempts to predict price movements before they happen by combining the trend (via linear regression) and momentum (via ROC).
When the price significantly diverges from the trendline and momentum supports a continuation, it signals a potential entry point (either buy or sell).
It is leading in that it anticipates price movement before it becomes fully apparent in the market.
Next Steps:
You can adjust the length of the linear regression and ROC to fine-tune the indicator’s sensitivity to your trading style.
This can be combined with other indicators or used as part of a larger strategy

Aurous - Horizontal Rays Define Pip Size:
Since 1 pip for XAUUSD is usually considered as 0.1, the pip Size is set to 0.1. A 50-pip interval is therefore 50 * 0.1 = 5.0.
Nearest Pip Level Calculation:
We find the nearest 50-pip level based on the current price of XAUUSD. The formula nearestPipLevel = round(close / pipInterval) * pipInterval rounds the current price to the nearest multiple of the 50-pip interval.
Loop for Multiple Lines:
We use a loop that runs from -20 to 20 to plot horizontal ray lines 50 pips above and below the current price. The range (-20 to 20) ensures there are enough lines plotted both above and below the price.
Horizontal Ray Lines:
The line.new function is used to draw the horizontal rays, extending to the right.
Plot Current Price:
We also plot the closing price with a blue line to make it easier to track the price against the horizontal rays.

Connors RSI with Down GapThe Connors RSI with Down Gap indicator is a technical tool designed to support Larry Connors' Terror Gap Strategy, which is part of his broader framework outlined in the book "Buy the Fear, Sell the Greed: 7 Behavioral Quant Strategies for Traders." This specific indicator integrates the ConnorsRSI calculation with a focus on detecting down gaps in price, providing insights into moments when panic selling may occur.
The ConnorsRSI
ConnorsRSI is a composite indicator developed by Larry Connors that combines three core components:
RSI: A short-term relative strength index measuring the speed and magnitude of price changes.
Streak RSI: Tracks consecutive up or down closes to assess momentum.
Percent Rank: Evaluates how the current close ranks in relation to past prices.
When combined, these three elements provide a nuanced view of short-term overbought or oversold conditions. ConnorsRSI readings below a certain threshold (commonly 30 or lower) suggest that the asset has been heavily sold, indicating potential exhaustion of selling pressure.
Behavioral Finance Insights
The Terror Gap Strategy is grounded in principles from behavioral finance, which studies how psychological factors affect market participants' decision-making. Specifically, the indicator exploits the fear and irrational behavior that often arise when traders face persistent losses, especially after a down gap. According to behavioral finance theories like prospect theory (Kahneman & Tversky, 1979), people tend to overreact to losses, leading to panic selling. This creates opportunities for contrarian traders who understand the psychology behind these market movements.
The ConnorsRSI with Down Gap indicator works because it identifies:
Overextended selling through the ConnorsRSI, where persistent price declines result in low RSI values (indicating panic).
Gap down days, where the opening price is below the previous day’s close, typically amplifying the sense of loss and fear for traders already in losing positions.
Why This Indicator Works
The psychology of losses makes traders more prone to selling during periods of fear, especially when confronted with a gap down after sustained price declines. This indicator, by combining ConnorsRSI with down gaps, offers a quantitative way to spot these moments of panic. Traders can take advantage of these signals to enter positions when the market is in a state of fear, often when there is potential for a reversion to the mean.
Indicator Mechanics
In the current implementation:
The ConnorsRSI is calculated using three components: a short-term RSI, streak RSI, and percent rank.
When the ConnorsRSI drops below a user-defined lower threshold, the indicator highlights oversold conditions.
If there is a down gap (open price lower than the previous close) and the ConnorsRSI is below the threshold, a label is displayed, signaling a potential opportunity to buy.
Practical Use and Application
For traders looking to implement the Terror Gap Strategy, this indicator provides a clear visual cue (via background coloring and labels) when conditions are ripe for a contrarian trade. It can be particularly useful for traders who thrive on taking advantage of fear-driven sell-offs.
However, to fully understand and apply this strategy effectively, it is recommended to purchase Larry Connors' book "Buy the Fear, Sell the Greed." The book provides detailed explanations of how to execute the strategy with precision, including insights into exit conditions, scaling into positions, and managing risk.
Conclusion
The ConnorsRSI with Down Gap indicator combines quantitative analysis with behavioral finance principles to exploit fear-driven market behavior. By utilizing this tool within a disciplined trading strategy, traders can potentially profit from temporary market inefficiencies caused by panic selling.
References
Kahneman, D., & Tversky, A. (1979). Prospect theory: An analysis of decision under risk. Econometrica, 47(2), 263-291.
Connors, L. (2013). Buy the Fear, Sell the Greed: 7 Behavioral Quant Strategies for Traders.
This indicator can be a valuable asset, but understanding its proper use within a broader strategy framework is essential. Purchasing Connors' book is a recommended step toward mastering the approach.

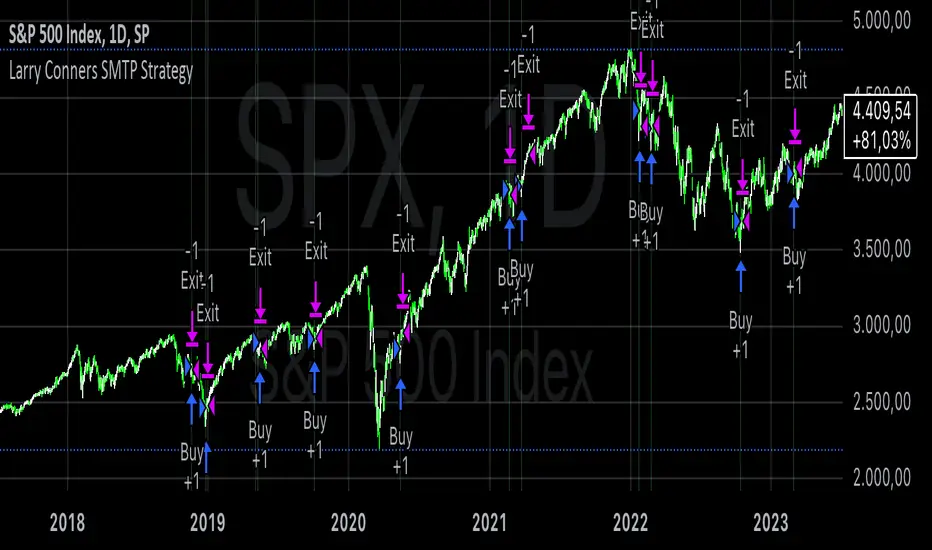
Larry Conners SMTP StrategyThe Spent Market Trading Pattern is a strategy developed by Larry Connors, typically used for short-term mean reversion trading. This strategy takes advantage of the exhaustion in market momentum by entering trades when the market is perceived as "spent" after extended trends or extreme moves, expecting a short-term reversal. Connors uses indicators like RSI (Relative Strength Index) and price action patterns to identify these opportunities.
Key Elements of the Strategy:
Overbought/Oversold Conditions: The strategy looks for extreme overbought or oversold conditions, often indicated by low RSI values (below 30 for oversold and above 70 for overbought).
Mean Reversion: Connors believed that markets, especially in short-term scenarios, tend to revert to the mean after periods of strong momentum. The "spent" market is assumed to have expended its energy, making a reversal likely.
Entry Signals:
In an uptrend, a stock or market index making a significant number of consecutive up days (e.g., 5-7 consecutive days with higher closes) indicates overbought conditions.
In a downtrend, a similar number of consecutive down days indicates oversold conditions.
Reversal Anticipation: Once an extreme in price movement is identified (such as consecutive gains or losses), the strategy places trades anticipating a reversion to the mean, which is usually the 5-day or 10-day moving average.
Exit Points: Trades are exited when prices move back toward their mean or when the extreme conditions dissipate, usually based on RSI or moving average thresholds.
Why the Strategy Works:
Human Psychology: The strategy capitalizes on the fact that markets, in the short term, often behave irrationally due to the emotions of traders—fear and greed lead to overextended moves.
Mean Reversion Tendency: Financial markets often exhibit mean-reverting behavior, where prices temporarily deviate from their historical norms but eventually return. Short-term exhaustion after a strong rally or sell-off offers opportunities for quick profits.
Overextended Moves: Markets that rise or fall too quickly tend to become overextended, as buyers or sellers get exhausted, making reversals more probable. Connors’ approach identifies these moments when the market is "spent" and ripe for a reversal.
Risks of the Spent Market Trading Pattern Strategy:
Trend Continuation: One of the key risks is that the market may not revert as expected and instead continues in the same direction. In trending markets, mean-reversion strategies can suffer because strong trends can last longer than anticipated.
False Signals: The strategy relies heavily on technical indicators like RSI, which can produce false signals in volatile or choppy markets. There can be times when a market appears "spent" but continues in its current direction.
Market Timing: Mean reversion strategies often require precise market timing. If the entry or exit points are mistimed, it can lead to losses, especially in short-term trades where small price movements can significantly impact profitability.
High Transaction Costs: This strategy requires frequent trades, which can lead to higher transaction costs, especially in markets with wide bid-ask spreads or high commissions.
Conclusion:
Larry Connors’ Spent Market Trading Pattern strategy is built on the principle of mean reversion, leveraging the concept that markets tend to revert to a mean after extreme moves. While effective in certain conditions, such as range-bound markets, it carries risks—especially during strong trends—where price momentum may not reverse as quickly as expected.
For a more in-depth explanation, Larry Connors’ books such as "Short-Term Trading Strategies That Work" provide a comprehensive guide to this and other strategies .
Connors VIX Reversal III invented by Dave LandryThis strategy is based on trading signals derived from the behavior of the Volatility Index (VIX) relative to its 10-day moving average. The rules are split into buying and selling conditions:
Buy Conditions:
The VIX low must be above its 10-day moving average.
The VIX must close at least 10% above its 10-day moving average.
If both conditions are met, a buy signal is generated at the market's close.
Sell Conditions:
The VIX high must be below its 10-day moving average.
The VIX must close at least 10% below its 10-day moving average.
If both conditions are met, a sell signal is generated at the market's close.
Exit Conditions:
For long positions, the strategy exits when the VIX trades intraday below its previous day’s 10-day moving average.
For short positions, the strategy exits when the VIX trades intraday above its previous day’s 10-day moving average.
This strategy is primarily a mean-reversion strategy, where the market is expected to revert to a more normal state after the VIX exhibits extreme behavior (i.e., large deviations from its moving average).
About Dave Landry
Dave Landry is a well-known figure in the world of trading, particularly in technical analysis. He is an author, trader, and educator, best known for his work on swing trading strategies. Landry focuses on trend-following and momentum-based techniques, teaching traders how to capitalize on shorter-term price swings in the market. He has written books like "Dave Landry on Swing Trading" and "The Layman's Guide to Trading Stocks," which emphasize practical, actionable trading strategies.
About Connors Research
Connors Research is a financial research firm known for its quantitative research in financial markets. Founded by Larry Connors, the firm specializes in developing high-probability trading systems based on historical market behavior. Connors’ work is widely respected for its data-driven approach, including systems like the RSI(2) strategy, which focuses on short-term mean reversion. The firm also provides trading education and tools for institutional and retail traders alike, emphasizing strategies that can be backtested and quantified.
Risks of the Strategy
While this strategy may appear to offer promising opportunities to exploit extreme VIX movements, it carries several risks:
Market Volatility: The VIX itself is a measure of market volatility, meaning the strategy can be exposed to sudden and unpredictable market swings. This can result in whipsaws, where positions are opened and closed in rapid succession due to sharp reversals in the VIX.
Overfitting: Strategies based on specific conditions like the VIX closing 10% above or below its moving average can be subject to overfitting, meaning they work well in historical tests but may underperform in live markets. This is a common issue in quantitative trading systems that are not adaptable to changing market conditions .
Mean-Reversion Assumption: The core assumption behind this strategy is that markets will revert to their mean after extreme movements. However, during periods of sustained trends (e.g., market crashes or rallies), this assumption may break down, leading to prolonged drawdowns.
Liquidity and Slippage: Depending on the asset being traded (e.g., S&P 500 futures, ETFs), liquidity issues or slippage could occur when executing trades at market close, particularly in volatile conditions. This could increase costs or worsen trade execution.
Scientific Explanation of the Strategy
The VIX is often referred to as the "fear gauge" because it measures the market's expectations of volatility based on options prices. Research has shown that the VIX tends to spike during periods of market stress and revert to lower levels when conditions stabilize . Mean reversion strategies like this one assume that extreme VIX levels are unsustainable in the long run, which aligns with findings from academic literature on volatility and market behavior.
Studies have found that the VIX is inversely correlated with stock market returns, meaning that higher VIX levels often correspond to lower stock prices and vice versa . By using the VIX’s relationship with its 10-day moving average, this strategy aims to capture reversals in market sentiment. The 10% threshold is designed to identify moments when the VIX is significantly deviating from its norm, signaling a potential reversal.
However, academic research also highlights the limitations of relying on the VIX alone for trading signals. The VIX does not predict market direction, only volatility, meaning that it cannot indicate the magnitude of price movements . Furthermore, extreme VIX levels can persist longer than expected, particularly during financial crises.
In conclusion, while the strategy is grounded in well-established financial principles (e.g., mean reversion and the relationship between volatility and market performance), it carries inherent risks and should be used with caution. Backtesting and careful risk management are essential before applying this strategy in live markets.

Larry Conners Vix Reversal II Strategy (approx.)This Pine Script™ strategy is a modified version of the original Larry Connors VIX Reversal II Strategy, designed for short-term trading in market indices like the S&P 500. The strategy utilizes the Relative Strength Index (RSI) of the VIX (Volatility Index) to identify potential overbought or oversold market conditions. The logic is based on the assumption that extreme levels of market volatility often precede reversals in price.
How the Strategy Works
The strategy calculates the RSI of the VIX using a 25-period lookback window. The RSI is a momentum oscillator that measures the speed and change of price movements. It ranges from 0 to 100 and is often used to identify overbought and oversold conditions in assets.
Overbought Signal: When the RSI of the VIX rises above 61, it signals a potential overbought condition in the market. The strategy looks for a RSI downtick (i.e., when RSI starts to fall after reaching this level) as a trigger to enter a long position.
Oversold Signal: Conversely, when the RSI of the VIX drops below 42, the market is considered oversold. A RSI uptick (i.e., when RSI starts to rise after hitting this level) serves as a signal to enter a short position.
The strategy holds the position for a minimum of 7 days and a maximum of 12 days, after which it exits automatically.
Larry Connors: Background
Larry Connors is a prominent figure in quantitative trading, specializing in short-term market strategies. He is the co-author of several influential books on trading, such as Street Smarts (1995), co-written with Linda Raschke, and How Markets Really Work. Connors' work focuses on developing rules-based systems using volatility indicators like the VIX and oscillators such as RSI to exploit mean-reversion patterns in financial markets.
Risks of the Strategy
While the Larry Connors VIX Reversal II Strategy can capture reversals in volatile market environments, it also carries significant risks:
Over-Optimization: This modified version adjusts RSI levels and holding periods to fit recent market data. If market conditions change, the strategy might no longer be effective, leading to false signals.
Drawdowns in Trending Markets: This is a mean-reversion strategy, designed to profit when markets return to a previous mean. However, in strongly trending markets, especially during extended bull or bear phases, the strategy might generate losses due to early entries or exits.
Volatility Risk: Since this strategy is linked to the VIX, an instrument that reflects market volatility, large spikes in volatility can lead to unexpected, fast-moving market conditions, potentially leading to larger-than-expected losses.
Scientific Literature and Supporting Research
The use of RSI and VIX in trading strategies has been widely discussed in academic research. RSI is one of the most studied momentum oscillators, and numerous studies show that it can capture mean-reversion effects in various markets, including equities and derivatives.
Wong et al. (2003) investigated the effectiveness of technical trading rules such as RSI, finding that it has predictive power in certain market conditions, particularly in mean-reverting markets .
The VIX, often referred to as the “fear index,” reflects market expectations of volatility and has been a focal point in research exploring volatility-based strategies. Whaley (2000) extensively reviewed the predictive power of VIX, noting that extreme VIX readings often correlate with turning points in the stock market .
Modified Version of Original Strategy
This script is a modified version of Larry Connors' original VIX Reversal II strategy. The key differences include:
Adjusted RSI period to 25 (instead of 2 or 4 commonly used in Connors’ other work).
Overbought and oversold levels modified to 61 and 42, respectively.
Specific holding period (7 to 12 days) is predefined to reduce holding risk.
These modifications aim to adapt the strategy to different market environments, potentially enhancing performance under specific volatility conditions. However, as with any system, constant evaluation and testing in live markets are crucial.
References
Wong, W. K., Manzur, M., & Chew, B. K. (2003). How rewarding is technical analysis? Evidence from Singapore stock market. Applied Financial Economics, 13(7), 543-551.
Whaley, R. E. (2000). The investor fear gauge. Journal of Portfolio Management, 26(3), 12-17.

Stationarity Test: Dickey-Fuller & KPSS [Pinescriptlabs]
📊 Kwiatkowski-Phillips-Schmidt-Shin Model Indicator & Dickey-Fuller Test 📈
This algorithm performs two statistical tests on the price spread between two selected instruments: the first from the current chart and the second determined in the settings. The purpose is to determine if their relationship is stationary. It then uses this information to generate **visual signals** based on how far the current relationship deviates from its historical average.
⚙️ Key Components:
• 🧪 ADF Test (Augmented Dickey-Fuller):** Checks if the spread between the two instruments is stationary.
• 🔬 KPSS Test (Kwiatkowski-Phillips-Schmidt-Shin):** Another test for stationarity, complementing the ADF test.
• 📏 Z-Score Calculation:** Measures how many standard deviations the current spread is from its historical mean.
• 📊 Dynamic Threshold:** Adjusts the trading signal threshold based on recent market volatility.
🔍 What the Values Mean:
The indicator displays several key values in a table:
• 📈 ADF Stationarity:** Shows "Stationary" or "Non-Stationary" based on the ADF test result.
• 📉 KPSS Stationarity:** Shows "Stationary" or "Non-Stationary" based on the KPSS test result.
• 📏 Current Z-Score:** The current Z-score of the spread.
• 🔗 Hedge Ratio:** The relationship coefficient between the two instruments.
• 🌐 Market State:** Describes the current market condition based on the Z-score.
📊 How to Interpret the Chart:
• The main chart displays the Z-score of the spread over time.
• The green and red lines represent the upper and lower thresholds for trading signals.
• The area between the **Z-score** and the thresholds is filled when a trading signal is active.
• Additional charts show the **statistics of the ADF and KPSS tests** and their critical values.
**📉 Practical Example: NVIDIA Corporation (NVDA)**
Looking at the chart for **NVIDIA Corporation (NVDA)**, we can see how the indicator applies in a real case:
1. **Main Chart (Top):**
• Shows the **historical price** of NVIDIA on a weekly scale.
• A general **uptrend** is observed with periods of consolidation.
2. **KPSS & ADF Indicator (Bottom):**
• The lower chart shows the KPSS & ADF Model indicator applied to NVIDIA.
• The **green line** represents the Z-score of the spread.
• The **green shaded areas** indicate periods where the Z-score exceeded the thresholds, generating trading signals.
3. **📋 Current Values in the Table:**
• **ADF Stationarity:** Non-Stationary
• **KPSS Stationarity:** Non-Stationary
• **Current Z-Score:** 3.45
• **Hedge Ratio:** -164.8557
• **Market State:** Moderate Volatility
4. **🔍 Interpretation:**
• A Z-score of **3.45** suggests that NVIDIA’s price is significantly above its historical average relative to **EURUSD**.
• Both the **ADF** and **KPSS** tests indicate **non-stationarity**, suggesting **caution** when using mean reversion signals at this moment.
• The market state "Moderate Volatility" indicates noticeable deviation, but not extreme.
---
**💡 Usage:**
• **When Both Tests Show Stationarity:**
• **🔼 If Z-score > Upper Threshold:** Consider **buying the first instrument** and **selling the second**.
• **🔽 If Z-score < Lower Threshold:** Consider **selling the first instrument** and **buying the second**.
• **When Either Test Shows Non-Stationarity:**
• Wait for the relationship to become **stationary** before trading.
• **Market State:**
• Use this information to evaluate **general market conditions** and adjust your trading strategy accordingly.
**Mirror Comparison of the Same as Symbol 2 🔄📊**
**📊 Table Values:**
• **Extreme Volatility Threshold:** This value is displayed when the **Z-score** exceeds **100%**, indicating **extreme deviation**. It signals a potential **trading opportunity**, as the spread has reached unusually high or low levels, suggesting a **reversion or correction** in the market.
• **Mean Reversion Threshold:** Appears when the **Z-score** begins returning towards the mean after a period of **high or extreme volatility**. It indicates that the spread between the assets is returning to normal levels, suggesting a phase of **stabilization**.
• **Neutral Zone:** Displayed when the **Z-score** is near **zero**, signaling that the spread between assets is within expected limits. This indicates a **balanced market** with no significant volatility or clear trading opportunities.
• **Low Volatility Threshold:** Appears when the **Z-score** is below **70%** of the dynamic threshold, reflecting a period of **low volatility** and market stability, indicating fewer trading opportunities.
Español:
📊 Indicador del Modelo Kwiatkowski-Phillips-Schmidt-Shin & Prueba de Dickey-Fuller 📈
Este algoritmo realiza dos pruebas estadísticas sobre la diferencia de precios (spread) entre dos instrumentos seleccionados: el primero en el gráfico actual y el segundo determinado en la configuración. El objetivo es determinar si su relación es estacionaria. Luego utiliza esta información para generar señales visuales basadas en cuánto se desvía la relación actual de su promedio histórico.
⚙️ Componentes Clave:
• 🧪 Prueba ADF (Dickey-Fuller Aumentada): Verifica si el spread entre los dos instrumentos es estacionario.
• 🔬 Prueba KPSS (Kwiatkowski-Phillips-Schmidt-Shin): Otra prueba para la estacionariedad, complementando la prueba ADF.
• 📏 Cálculo del Z-Score: Mide cuántas desviaciones estándar se encuentra el spread actual de su media histórica.
• 📊 Umbral Dinámico: Ajusta el umbral de la señal de trading en función de la volatilidad reciente del mercado.
🔍 Qué Significan los Valores:
El indicador muestra varios valores clave en una tabla:
• 📈 Estacionariedad ADF: Muestra "Estacionario" o "No Estacionario" basado en el resultado de la prueba ADF.
• 📉 Estacionariedad KPSS: Muestra "Estacionario" o "No Estacionario" basado en el resultado de la prueba KPSS.
• 📏 Z-Score Actual: El Z-score actual del spread.
• 🔗 Ratio de Cobertura: El coeficiente de relación entre los dos instrumentos.
• 🌐 Estado del Mercado: Describe la condición actual del mercado basado en el Z-score.
📊 Cómo Interpretar el Gráfico:
• El gráfico principal muestra el Z-score del spread a lo largo del tiempo.
• Las líneas verdes y rojas representan los umbrales superior e inferior para las señales de trading.
• El área entre el Z-score y los umbrales se llena cuando una señal de trading está activa.
• Los gráficos adicionales muestran las estadísticas de las pruebas ADF y KPSS y sus valores críticos.
📉 Ejemplo Práctico: NVIDIA Corporation (NVDA)
Observando el gráfico para NVIDIA Corporation (NVDA), podemos ver cómo se aplica el indicador en un caso real:
Gráfico Principal (Superior): • Muestra el precio histórico de NVIDIA en escala semanal. • Se observa una tendencia alcista general con períodos de consolidación.
Indicador KPSS & ADF (Inferior): • El gráfico inferior muestra el indicador Modelo KPSS & ADF aplicado a NVIDIA. • La línea verde representa el Z-score del spread. • Las áreas sombreadas en verde indican períodos donde el Z-score superó los umbrales, generando señales de trading.
📋 Valores Actuales en la Tabla: • Estacionariedad ADF: No Estacionario • Estacionariedad KPSS: No Estacionario • Z-Score Actual: 3.45 • Ratio de Cobertura: -164.8557 • Estado del Mercado: Volatilidad Moderada
🔍 Interpretación: • Un Z-score de 3.45 sugiere que el precio de NVIDIA está significativamente por encima de su promedio histórico en relación con EURUSD. • Tanto la prueba ADF como la KPSS indican no estacionariedad, lo que sugiere precaución al usar señales de reversión a la media en este momento. • El estado del mercado "Volatilidad Moderada" indica una desviación notable, pero no extrema.
💡 Uso:
• Cuando Ambas Pruebas Muestran Estacionariedad:
• 🔼 Si Z-score > Umbral Superior: Considera comprar el primer instrumento y vender el segundo.
• 🔽 Si Z-score < Umbral Inferior: Considera vender el primer instrumento y comprar el segundo.
• Cuando Alguna Prueba Muestra No Estacionariedad:
• Espera a que la relación se vuelva estacionaria antes de operar.
• Estado del Mercado:
• Usa esta información para evaluar las condiciones generales del mercado y ajustar tu estrategia de trading en consecuencia.
Comparativo en Espejo del Mismo Como Símbolo 2 🔄📊
📊 Valores de la Tabla:
• Umbral de Volatilidad Extrema: Este valor se muestra cuando el Z-score supera el 100%, indicando desviación extrema. Señala una posible oportunidad de trading, ya que el spread entre los activos ha alcanzado niveles inusualmente altos o bajos, lo que podría indicar una reversión o corrección en el mercado.
• Umbral de Reversión a la Media: Aparece cuando el Z-score comienza a volver hacia la media tras un período de alta o extrema volatilidad. Indica que el spread entre los activos está regresando a niveles normales, sugiriendo una fase de estabilización.
• Zona Neutral: Se muestra cuando el Z-score está cerca de cero, señalando que el spread entre activos está dentro de lo esperado. Esto indica un mercado equilibrado con ninguna volatilidad significativa ni oportunidades claras de trading.
• Umbral de Baja Volatilidad: Aparece cuando el Z-score está por debajo del 70% del umbral dinámico, reflejando un período de baja volatilidad y estabilidad del mercado, indicando menos oportunidades de trading.

Tian Di Grid Merge Version 6.0
Strategy Introduction:
1. We know that the exchange can only set a maximum of 100 grids. However, our grid strategy can set a maximum of 350 grids.
2. We have added the modes of proportional and differential warehousing.
3. It should be noted that we have not set any filtering conditions, which means that when the price falls below the grid, we will execute a buy action at the closing price, and when the price falls above the grid, we will execute a sell action;
4. We suggest limiting the trading time cycle to 5 meters, as sometimes errors may appear on TV due to the dense grid or the inability to draw so many grids;
5. Please ensure that the minimum spacing between each grid is not less than 0.1%, as this is extremely difficult to profit from, and on the other hand, it may not function due to excessively dense spacing;
6. The maximum number of grids is 350, and the minimum number is currently 3;
matters needing attention:
Don't choose to go long or short together, and don't choose to go even short or short;
Closing position setting: It is recommended to select it to avoid order accumulation;
Unable to trade: If unable to trade normally, switch to a 1m cycle;
Number of cells: Calculate it yourself, 350 is just the maximum number of cells that can be adjusted;
Grid spacing: minimum 0.1%, below which no profit can be made;
Position value: default is 100u, which is the amount already leveraged;
Multiple investment: The order amount for each order is the same, and there is no need for multiple investment;
Open both long and short positions: You can open multiple positions for one account and open one position for one account. Do not open both long and short positions for the same target at the same time