ADA/USDT – 5th Wave Breakout or Extended 4th Wave?KUCOIN:ADAUSDT might have completed its 4th wave of the larger 5 wave structure, but confirmation depends on breaking out of the current channel.
The daily RSI is nearing overbought, so there’s still a chance for a minor dip before continuation. Current upside target sits between 1.085 -1.20 USDT , aligning with the larger channel and forming a higher high. If this plays out, it likely completes a first wave of a bigger five-wave structure, followed by a cooldown.
ADAUSDT.P trade ideas

ADA/USDT 1W chartbreakout.................................
support $ 0.234
TARGETS ARE GIVEN IN THE CHART

Cardano The chart for Cardano (ADA) on the 4-hour timeframe shows a strong bullish move, reaching a peak around 0.9200 before pulling back. The price has created higher highs and higher lows, indicating a bullish trend. Currently, the key resistance level is at 0.9200, with support levels around 0.8600 and 0.8400. If the price manages to break above the resistance at 0.9200, the next target could be around 1.0000, as shown in the chart. However, if the price fails to break through and continues to pull back, it may retest the support levels at 0.8600 and 0.8400. The market appears to be in a consolidation phase, with a potential continuation of the upward trend if the resistance breaks.

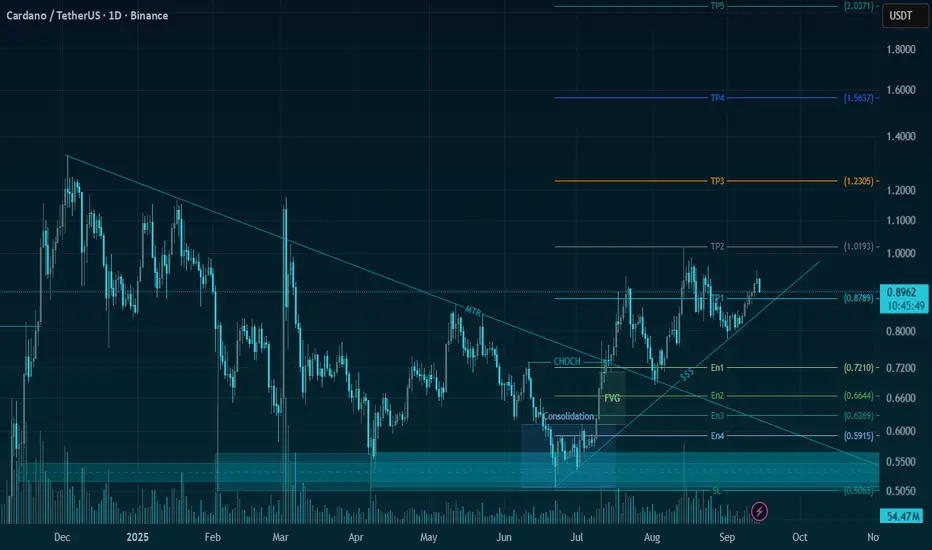
ADA/USDT | Low-Risk Swing Setup with 215%+ Upside Potential🚀 Trade Setup Details:
🕯 #ADA/USDT 🔼 Buy | Long 🔼
⌛️ TimeFrame: 1D
--------------------
🛡 Risk Management (Example):
🛡 Based on $10,000 Balance
🛡 Loss-Limit: 1% (Conservative)
🛡 The Signal Margin: $463.61
--------------------
☄️ En1: 0.721 (Amount: $46.36)
☄️ En2: 0.6644 (Amount: $162.26)
☄️ En3: 0.6269 (Amount: $208.62)
☄️ En4: 0.5915 (Amount: $46.36)
--------------------
☄️ If All Entries Are Activated, Then:
☄️ Average.En: 0.6458 ($463.61)
--------------------
☑️ TP1: 0.8789 (+36.09%) (RR:1.67)
☑️ TP2: 1.0193 (+57.84%) (RR:2.68)
☑️ TP3: 1.2306 (+90.55%) (RR:4.2)
☑️ TP4: 1.5637 (+142.13%) (RR:6.59)
☑️ TP5: 2.0372 (+215.45%) (RR:9.99)
☑️ TP6: Open 🔝
--------------------
❌ SL: 0.5065 (-21.57%) (-$100)
--------------------
💯 Maximum.Lev: 3X
⌛️ Trading Type: Swing Trading
‼️ Signal Risk: 🙂 Low-Risk! 🙂
--------------------
🔗 www.tradingview.com
❤️ Your Like & Comments are valuable to us ❤️
ADA – Cardano Swing Long IdeaADA – Cardano Swing Long Idea
📊 Market Sentiment
Market sentiment remains strongly bullish as the FED is expected to deliver a 0.25% rate cut, with speculation building for a possible 0.5% cut in September. Monetary policy shifts are being driven by both inflation trends and weakening labor market data. The latest August and September job reports were soft, signaling that the economy is cooling rapidly. This environment continues to fuel expectations for a major bullish run in the weeks ahead.
📈 Technical Analysis
Price found support on September 1st at the bullish HTF trendline and has been moving upward since.
Price is currently at the HTF Key Resistance level, showing accumulation rather than sharp rejection, with deviations pushing upward. This indicates strength and a bias toward higher prices.
📌 Game Plan
1)Watch for a daily close above the bearish trendline.
2)Look for the HTF Key Resistance to be broken and confirmed with a daily close above.
🎯 Setup Trigger
Entry after the retest of the HTF Key Resistance level ($0.885).
📋 Trade Management
Stoploss: Daily close below HTF Key Level ($0.85 area)
Targets:
TP1: $0.96
TP2: $1.02
💬 Like, follow, and comment if you find this setup valuable!
⚠️ Disclaimer: This content is for informational and educational purposes only and does not constitute financial, investment, or trading advice. Always do your own research before making any financial decisions.

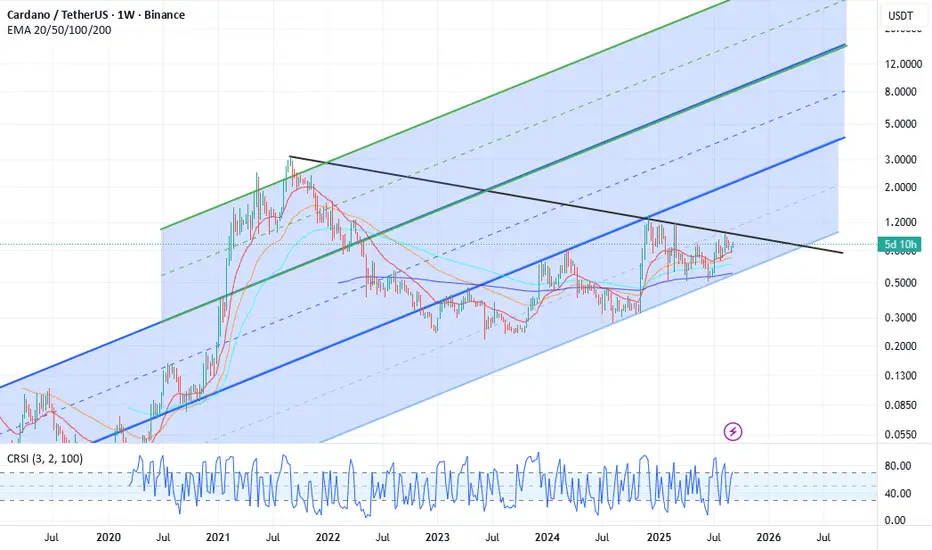
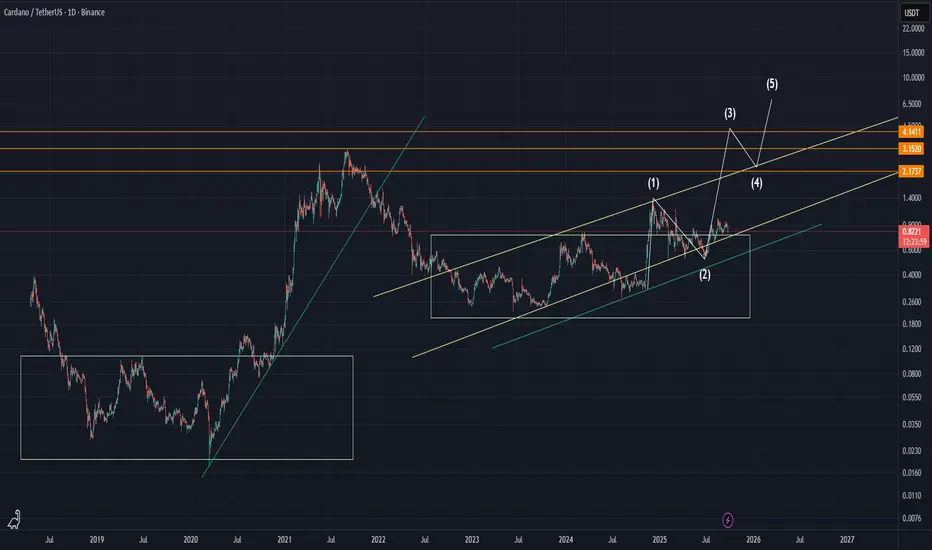
Cardano Ready for a Major Move – Huge Potential for $ADACardano has significant potential, but from a technical perspective we still need to see a decisive confirmation candle above the black trend line before a sustained breakout can be confirmed. If we break this trend line with strong momentum, the next mid-term targets are $1.20 and $1.60.
On the fundamental side, there is a strong pipeline of catalysts: BTC DeFi on Cardano enabled by its shared UTXO structure, the upcoming Leios upgrade for scalability, Hydra L2 for faster transactions, and the launch of the first Cardano partner chain Midnight, which focuses on privacy and selective disclosure to meet enterprise demand.
Looking further ahead, the possible targets for 2026 are in the $3 to $8 range, which align with the mid-line of the second ascending channel.
Considering both the technical setup and the fundamentals, I see substantial upside potential for Cardano in late 2025 and into 2026, with the possibility of outperforming BTC, ETH, and SOL as adoption and utility expand.
ADA/USDT New DISCOUNT ARRAYNew DISCOUNT ARRAY
Price is currently inside a 4HR FVG.
It has completed a sweep of origin bar low = higher-probability setup (liquidity grab).
Target previous highs.
🚩 Invalidation: If the supporting FVG breaks with a clear breakaway candle, this setup is void.

ADA/USDT 1HR time-frame
Coming off a BULLISH, DAILY FVG and painting a fresh, 1HR FVG, while respecting ORDERFLOW.
ADA/USDT, looks primed to challenge a 1hr BEARISH FVG and possibly yesterday's high.
🚩 Invalidation: If the Daily FVG breaks with a clear breakaway candle, this setup is void.


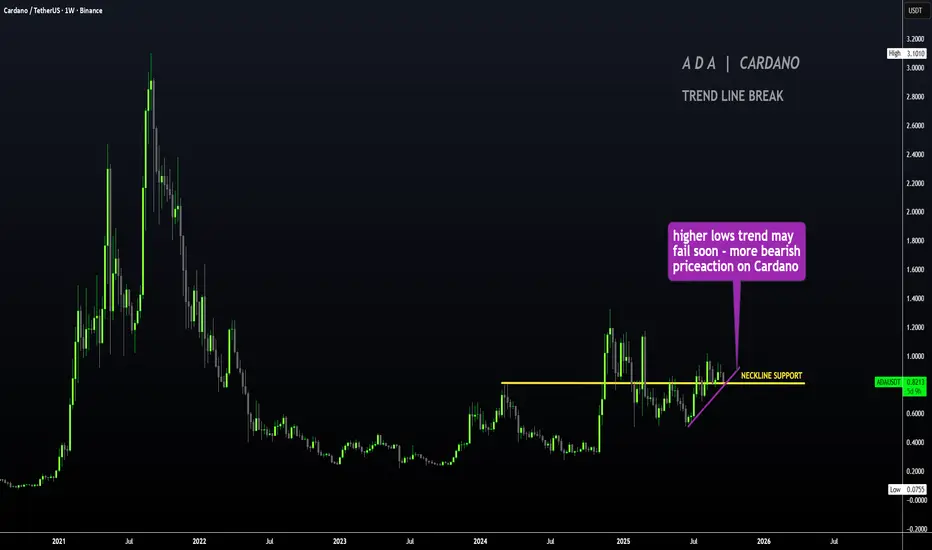
ADA - Failure to LAUNCH, BEARISH Short TermHello Traders
Cardano / ADAUSDT is not looking good for the short term after the higher lows trendline has been broken (trendline analysis / support analysis).
The 4h shows a bearish drop with a nasty red candle:
Also, if we consider a technical indicator - the moving averages - the price has fallen far under the 200d MA, for the first time in months. This is not a good sign, unless we can recover towards the upside within a week and stay right under it like a few days ago:
If there is no return to the upside, a coupe of bounce zones we can watch in the near to longer term include :
👋 Thanks for your support
BYBIT:ADAUSDT
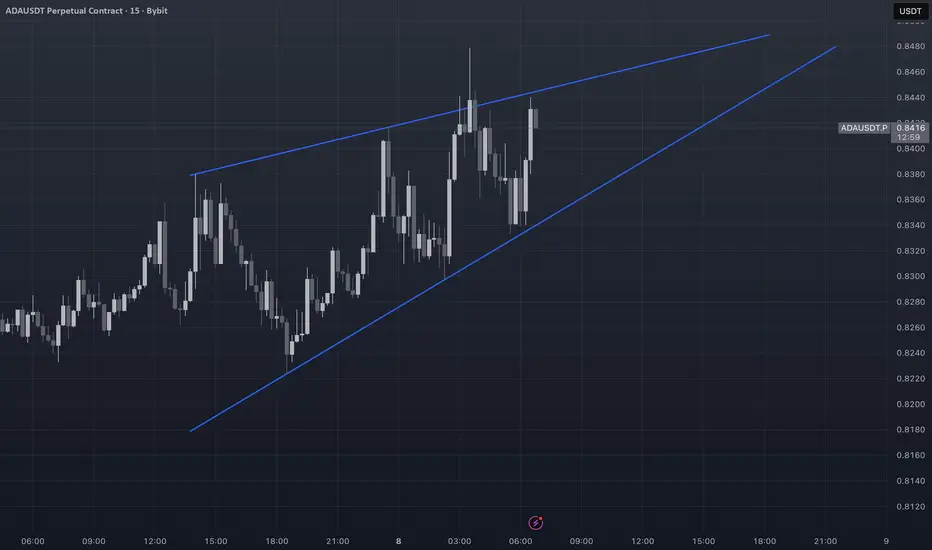
ADA long to $0.8450Just went long on cardano.
Aiming for $0.8450 area
Roughly 3rr
Sl: 0.8124
Time sensitive

Get Ready for Cardano’s Wave 3Hello Everyone,
Cardano appears to be gearing up for Wave 3 of the Elliott Wave cycle. After a relatively slow and corrective Wave 2, which often tests traders’ patience, the next impulsive wave could be starting soon. Many traders tend to give up during Wave 2 due to the mental pressure it brings—but those who stay prepared may benefit the most from Wave 3.
Stay alert and get ready for what’s coming.
Best regards,
Sam
ADA/USDT; FREE SIGNALHello friends
According to the market cycle, you can see that every time after the price growth we had a correction and now it seems that the price wants to exit the correction and have a new growth. If the support levels continue, the price can move to the specified targets.
*Trade safely with us*

ADAUSDT | 15 M | Market Structure | Bearish Price Trend| 2 of 2On the 15M chart, after the last LL, price has stopped pushing lower and is now moving sideways in a range.
1. There is no fresh LL or HH, indicating indecision.
2. This suggests the market is in consolidation, pausing before its next move.
Our course of action:
1. Do NOT trade inside the range → risk of chop and poor R:R.
2. Wait for confirmation:
i. A bearish break of structure from the range → signals continuation short, in line with the 1H bias
ii. A bullish break of structure → would signal a potential shift, but longs should only be treated as quick scalps since the 1H is still bearish.

ADAUSDT | 1 H | Market Structure | Bearish Price Trend| 1 of 2On the 1H chart, price is showing bearish sentiment.
1. On the 1H chart, price is showing bearish sentiment.
2. We have a series of Lower Highs (LH) and Lower Lows (LL).
3. Multiple Breaks of Structure (BoS) confirm that sellers remain in control.
4. This sets our higher time frame bias to bearish, meaning we should primarily look for short setups unless structure flips bullish.

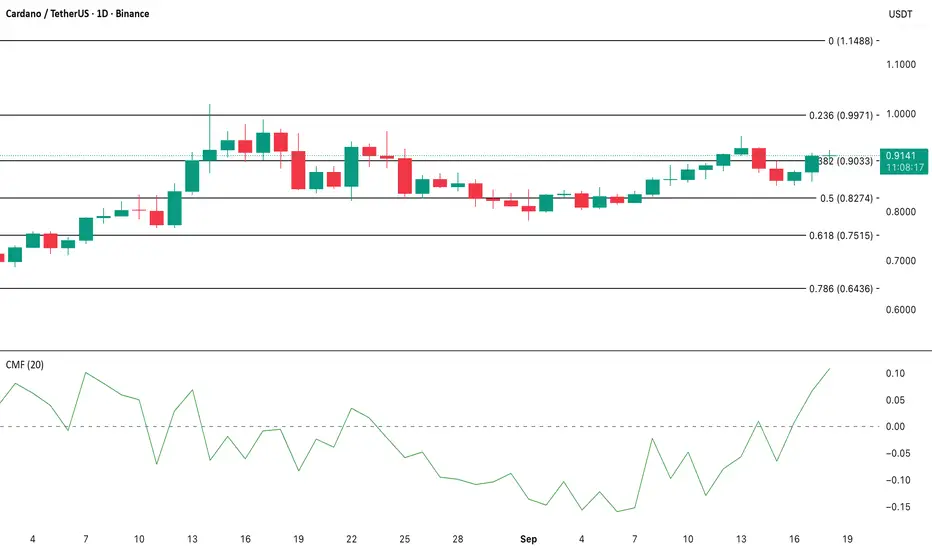
ADA Strengthens as Inflows Hit Multi-Week High
Readings from the ADA/USD one-day chart show the bullish bias around the altcoin. Momentum indicators are aligning with market optimism, suggesting that ADA could continue to attract demand in the near term.
The Chaikin Money Flow (CMF) has trended upward consistently, now reaching a 42-day high of 0.11. This metric tracks volume-weighted capital flows, and a sustained positive reading indicates that market participants are favoring accumulation over distribution.
The notable uptick in CMF reflects that ADA’s price is supported by genuine inflows. This buying pressure provides a solid foundation for further upside potential, strengthening the bullish case for ADA in the current market setup.
ADA/USDT – Will the Bulls Defend This Zone?Cardano is back at a critical demand zone (0.85 – 0.86) 📉.
This level has been holding price for a while, and buyers may step in again to push us higher.
📊 Bullish Scenario:
If ADA holds above this green zone, we could see a bounce towards 0.89 – 0.90, where major supply/resistance awaits.
⚠️ Bearish Scenario:
Failure to defend this demand zone could send ADA back below 0.82, so risk management is key.
🔍 My watch:
Looking for bullish confirmation (candle rejection / higher low) before entering longs.
Targeting the red zone for profit-taking.
---
💬 What do you think? Will ADA bounce strong from support, or are we heading lower first?
👇 Drop your thoughts in the comments – let’s share analysis!
#ADA #Cardano #Crypto #Altcoins #PriceAction #Trading

ADA/USDT: Consolidation Above Support Signals Bullish ContinuatiADA/USDT is currently consolidating above the 0.85 support zone after rebounding from the upward trendline, indicating a potential continuation of the uptrend. The recent breakout from a descending triangle pattern points to a shift in momentum, with higher lows supporting the bullish structure.
If the price continues to hold above 0.85, the next upside targets lie near 0.965, followed by resistance at 1.05. As long as the support base remains intact, buyers retain control, and momentum favors further gains.

ADA Bearish Momentum BuildingCardano’s price action on the one-day chart signals growing downside risk. The Moving Average Convergence Divergence (MACD) is on the verge of a bearish crossover, which often indicates that sellers are tightening their grip on the market.
A bearish crossover occurs when the MACD line drops below the signal line, marking a shift from bullish momentum to bearish pressure. This breakdown in structure suggests weakening strength from buyers and increases the probability of further declines.
With bullish momentum fading, ADA appears vulnerable to extended losses in the near term. If selling pressure intensifies following the crossover, the coin could face deeper retracements before buyers attempt to regain control.

ADA USDT BULISH BREAKOUT Bullish breakout from accumulation zone ⚡️
Price is breaking out of a tight range after strong accumulation near 0.8522. If momentum holds, next target is 0.9110. Stop-loss below 0.8522.
#Crypto #PriceAction #Breakout #TradingView

Cardano (ADA) Cardano (ADA) is showing potential for an upward move towards the $1.1882 price level.
This move could be initiated by a break of the downtrend line, drawn from point C (part of the highlighted price pattern). Traders should wait for a confirmation of this trendline break with high trading volume to increase the likelihood of this scenario succeeding.
Good luck
NEoWave Chart

$ADA - bullish area above 0.800$ support. CRYPTOCAP:ADA - bullish area above 0.800$ support.
Back to 1.00$ soon? 📈

Ada on 15 min chartAnother bearish pattern forming on the 15 min chart can be a good daytrade/scalp if it close below the pattern .