ada ooopsNear the end of the channel, the best time to buy a step, be sure that ada has a high potential to test the middle of the channel once, a real trader will understand what I mean.
ADAUSDT.P trade ideas

ADA Weekly falling wedge breakout playIf BTC uptrend continues and spot ETF gets approval, we could see ADA break out of this long term falling wedge

ADA about to moveGot my eyes on a CRYPTOCAP:ADA long the moment that potential momentum reversal (yellow box) came up and pulled the trigger.
OI build up and CVD looking bullish, I can see previous highs being broken easily and explode to 0.29 ish.
Breaks and holds grey box and I'll aim higher.
Invalidation if it prints a lower high

ADA CARDANO TARGETS IN ALT SEASON cardano bull flag is ready to blowyour mindes
i predicte we reach our targets around may and june beside fundamental news :D
share your opinion about this with me ;)

🚧Cardano is bearish now🚧 & many Traders don't see it 👀!!!As you saw in the previous analysis, the price hit the target and now it is time for the price to correct and then grow. PRZ point is a good point to enter.
Previous Analysis
_ _ _ _ _ _ _ _ _ _ _ _ _ _ _ _ _ _ _ _ _ _ _ _ _ _ _ _ _ _ _ _ _
✅Thank you, and for more ideas, hit ❤️Like❤️ and 🌟Follow🌟!

🐳Cardano will Go Up Again🐳 🟡ADA is in an symmetrical triangle which means the price is about to do a good bullish movement. The price can increase as much as the measured price movement ( AB=CD ) .The break out needed for increasing further has not happened but it should happen pretty soon.
_ _ _ _ _ _ _ _ _ _ _ _ _ _ _ _ _ _ _ _ _ _ _ _ _ _ _ _ _ _ _ _ _
✅Thank you, and for more ideas, hit ❤️Like❤️ and 🌟Follow🌟!


FAKE BREAK & BUY TO 0.2792$*-Technical Analysis 📈
FAKE BREAK BY LONG TO 0.2792$ = fake break in trendline by to support in base breakeven and target= 2-leg last movement
*Trade (Buy/Sell) 📊
buy = 0.2557$
*-Stop Loss 🔴
0.2536$
*-Take Profit 🎯
0.2792$
*-Risk Management 🚧
3%
👨🎓 Experience and Education: Our trading team has five years of experience in financial markets, especially cryptocurrencie.

Cardano’s Price Dilemma: Can On-Chain Metrics Propel ADA?Cardano’s (ADA) price struggles below $0.25, despite a $6 billion increase inthe global crypto market this week.
Historical data shows a close correlation between ADA’s price and Daily Active Addresses on the Cardano network, suggesting a potential for price breakout.
Cardano (ADA), currently lingering below the $0.25 mark, presents an intriguing case in the context of the recent $6 billion surge in the global cryptocurrency markets. The focus here is on understanding the potential catalysts for a price breakout for
ADA, drawing insights from historical data and on-chain metrics.
A Look at Cardano’s Whale Movements
Despite the acquisition of 120 million ADA by Cardano whales in October, their current holdings fall significantly short of the balances recorded at the price peak in April 2023.This presents a deficit that needs to be addressed to potentially double Cardano’s price. The historical peak for ADA in 2023 was marked at $0.46 on April 15, fueled by positive market reactions to Ethereum’s Shanghai network upgrade.
Network Participation: A Crucial Indicator
The Daily Active Addresses (DAA) on the Cardano network have historically shown a strong
correlation with ADA‘s price movements. A peak in DAA in February 2023preceded a price surge, with similar trends observed in subsequent months. However, recent weeks have witnessed a decline in network participation, with DAA failing to cross the 40,000 mark and recording a low of 28,538 on October 19.
This decline in network interaction, marked by reduced usage of ADA in dailytransactions, offers an explanation for
ADA
’s subdued price performance compared to the broader market trends. To instigate a price surge, historical trends suggest that surpassing 70,000 DAA and a significant increase in whale holdings could be pivotal.
ADA Price Prediction: A Journey to $0.50?
From an on-chain perspective, bolstering whale holdings and increasing network participation could potentially double
Cardano‘s prices. However, resistance at the $0.27mark presents a notable hurdle. A decisive breakout from this resistance, fueled by intensified buying from whales, could set ADA on a trajectory towards $0.50. Conversely, a price reversal below $0.20 could lead to a
prolonged downward trend, making the support at $0.24 crucial for preventing historical losses and catalyzing are bound.

ADA FORMING BULLISH PATTERN 🤔↗️🤔↘️🤔Hi dear traders
The price has formed bullish pattern.
If the 24$ support area is maintained, we expect the price to rise to specified targets.
Let's see what happens
This is not financial advice ( DYOR )
Good luck

📈📊 #ChartPattern Alert! 📈📊 📈 Triangle 📈A "triangle," in the context of trading and technical analysis, is a chart pattern that forms when the price movements of a financial asset create a shape resembling a triangle. Triangles are typically continuation patterns, meaning they often indicate that the asset's price is likely to continue moving in the direction it was heading before the formation of the triangle.
There are several types of triangles:
Symmetrical Triangle: This triangle forms when the price oscillates between two converging trendlines, one sloping upward and the other downward. As the price approaches the apex (the point where the two trendlines meet), it's expected to break out in either an upward or downward direction, indicating a potential continuation of the previous trend.
Ascending Triangle: An ascending triangle occurs when there is a horizontal resistance level and an upward-sloping support line. This pattern suggests that buyers are gradually becoming more aggressive, and a breakout above the resistance level could lead to an upward trend continuation.
Descending Triangle: Conversely, a descending triangle forms when there is a horizontal support level and a downward-sloping resistance line. In this case, sellers are becoming more aggressive, and a breakout below the support level could indicate a continuation of the downward trend.
Traders often use triangles to identify potential entry and exit points for their trades. The breakout direction from the triangle pattern is seen as a significant signal. However, it's essential to consider other factors, such as volume and overall market conditions, to confirm the validity of the breakout.
In summary, a "triangle" in trading represents a chart pattern formed by converging trendlines, indicating a period of consolidation in the market. It's a useful tool for traders to anticipate potential price movements and make informed trading decisions.


Cardano intraday signalYuuuup guys
Please fund confirmation and then enter the trade
My opinion more based on SHORT than long
MAYBE we have double top on chart and it is bearish pattern if happen
Please b careful about your money fellas

Ada/usdt important zonesHello my friends
Today is bullish day for ada and i hope you can make profit up now
So there is my personal chart for cardano
Important levels are shown on chart
This is chart of my strategy and don't trade without confirmation

ADA.DCardano looks really promising for a low risk buy, but the market is a bit volatile right now, and it`s the end of the week, so we should wait for the weekly candle to close and get a clearer picture of bitcoin`s situation before entering a trade. Before trading, it`s essential to learn not to trade.
Be profitable.
START BULL TREND...!In this rapid movement during two large candles, one can expect the end of the one-hour suffering process and the beginning of the upward trend.

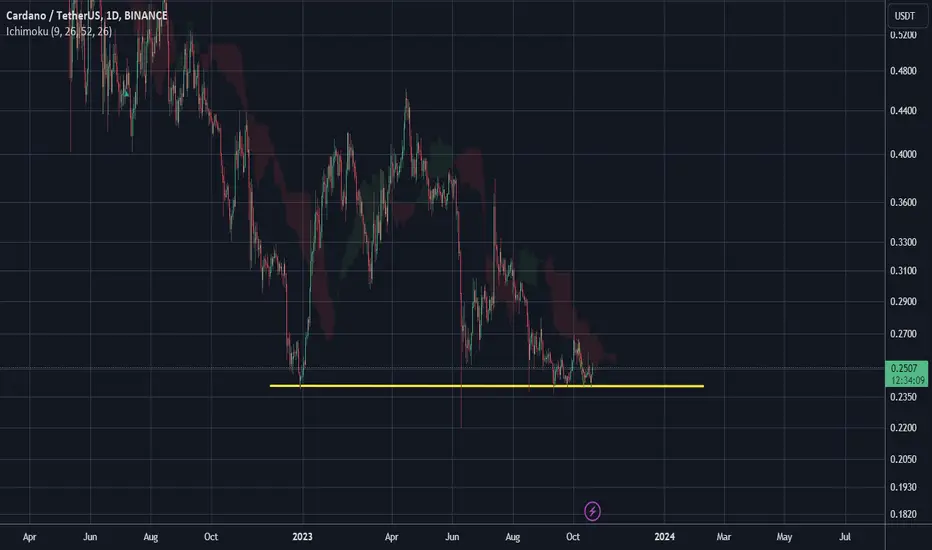
❗️ADA Is About To Break Down The Support, 0.22$ Is The Next Stop📥 If I Want To Describe ADA Situation Is Only One Word I Would Say Bearish
👉 There Is an Important Support Level At 0.24$ Which I Expect The Price Will Breakdown This Support By Strong Red Candle ,The Next Stop Will Be 0.22$ Which Is -9% Down From Here

ADA USDT PERPHello Trader OKX:ADAUSDT.P
the support area for the first time can still bounce for now.
can be used as a benchmark to take a long position now or
take at the limit buy area that I have marked at 0.24100
Please add a comment and Positive feedback and
constructive criticism are important to authors and the
community.
Disclamer: Not Financial Advice

ADAUSDTcardano, made me think about this scenario,...
notes; do not use this scenario as your trade, it is just an idea

SHAKE OFF THEN UPSIDEWe all know that nothing ever goes as planned. While many speculate that Cardano is just moments way from pushing up, I believe there's going to be a breakdown before a breakup.
Posting these posts to test my skills and knowledge, in order to sharpen my skills.

adausdt-mentoringadausdt speculative view
waiting for any action - sideway/down/up
***
Tolerance will reach such a level that intelligent people will be banned from thinking so as not to offend the imbeciles- F.M.dostoyevsky

Ada/usdt Trading Idea • 4H Time-frame "Ada/USDT
4-Hour Timeframe
Greetings, fellow traders!
Taking a look at the 4-hour chart for Ada, things are appearing quite bullish. I have high hopes that the price will surge from the area I've highlighted with a blue line, potentially reaching at least a 10% increase. Let's see how this unfolds.
Please remember that these ideas are purely my personal opinions and should not be considered financial advice. It's crucial to conduct your research before making any decisions.
Best of luck in your trading endeavors, and if you appreciate our content, your support is always welcomed.
Happy trading!"

🔴ADA Risk of falling up to 40%🔴The price will be ready to break the range and fall to the next demand after several encounters at 0.24.
The best price range for investing in Cardano is between 0.15 to 0.165.
You must be very lucky if the price enters the discount zone 🤩
