ADAUSDT: Combining classic method with Fib
For ADA, it needs to break 0.46 resistance. Go higher. Pull back and then continue up. Then we can say the trend has changed (to an uptrend).
Weekly timeframe.
ADAUSDT.P trade ideas

ADA - Break or Make Zone ⁉️Hello TradingView Family / Fellow Traders,
ADA is currently hovering around a robust resistance zone highlighted in blue.
Weekly Chart:
📈 To maintain control and establish a long-term bullish perspective , a weekly candle close above 0.465 is essential for the bulls.
If achieved, a movement toward the next resistance at approximately 0.8 could be anticipated.
H4 Chart:
📉 Conversely , the bulls will remain in control unless the last low in red at 0.393 is broken downward.
In this case a bearish correction till the 0.31 mark would be expected.
📚 Always follow your trading plan regarding entry, risk management, and trade management.
Good luck!
All Strategies Are Good; If Managed Properly!
~Richard Nasr

ADA: Follow Up for Potential Drop to Proximity of 35 CentsHi Everyone! Simply providing an update to point out the "potential" still exists for a potential drop down to proximity of $0.35 cents. Could we still range sideways between $0.37 Cents and $0.39 Cents for a while? Sure, that is possible. However, can we say for certain we will in fact continue to range sideways within that range before resuming upward pressure? No... It's still possible to see a shakeout down to $0.35 Cents before resuming upward pressure.
NOTE the 6-hour (Bottom Right of Center): You see the Red Line not quite ready to go UP FROM White Level 30 in order to increase probability of price action going UP FROM White Lower B-Band. Will we see that the next 6-hour candle in a little over 4 hours from this writing? It's possible. However, we need to see the Red "and" Blue Lines in the 30-minute, 60-minute, 90-minute and 2-hour rise above Yellow Level 50 to increase the probability of that occurring. Even if it did occur, would it continue rising to complete a higher high than the previous high in the 6-hour or will it be a lower high than the previous high? Well, that is still unknown at present. This is on-going fluid price action which requires patience to determine if and/or when we could see a change of trend. At present, it appears like a slow bleed down.
Happy Trading and Stay Awesome!
David

ADAUSDT Idea - CARDANO RallyHello traders,
I must admit, the current situation has me somewhat uncertain.
However, it's crucial to consider the potential for a significant price surge,
possibly reaching the $0.5500 range!! "Really!"
Stay vigilant and keep a close eye on the market dynamics.
BINANCE:ADAUSDT BINANCE:ADAUSD
⚠️ Disclaimer: The viewpoints shared represent my individual outlook on the market, based on publicly accessible information and historical data. While a portion of these opinions is influenced by my actual trades, others are not. It's important to note that I am not a financial advisor, and I do not assume any responsibility for the decisions you make in your trading activities.
✅ Feel free to share your inquiries or suggestions in the comments. I am more than willing to assess and analyze any cryptocurrency, forex currency pair, or stock index that piques your interest, so, Please don't hesitate to ask or mention the specific currency chart you'd like me to review.

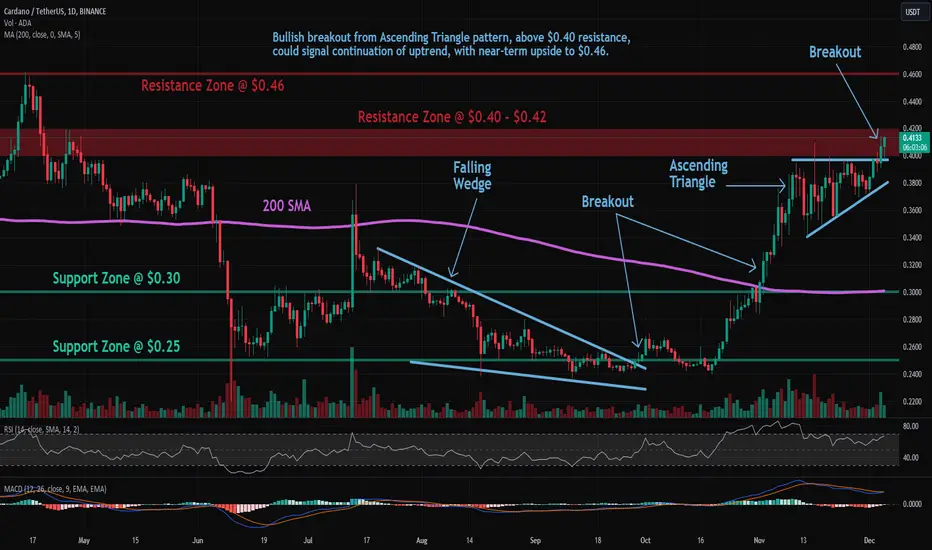
ADA: Ascending Triangle BreakoutCardano (ADA) technical analysis:
Trade setup : Bullish breakout from Ascending Triangle pattern, above $0.40 resistance, could signal continuation of uptrend, with near-term upside to $0.46. Previously, price broke above 200-day moving average ($0.30), which confirmed a bullish trend reversal to an Uptrend.
Pattern : Ascending Triangle which is a continuation pattern (it typically breaks out in the direction of existing trend). Most traders wait for a breakout but Swing traders could trade between the trendlines (Buy at Support, Sell at Resistance) as long as the trendlines are still relatively far apart.
Trend : Uptrend across all time horizons (Short- Medium- and Long-Term).
Momentum is Mixed as MACD Line is below MACD Signal Line (Bearish) but RSI > 55 (Bullish). MACD Histogram bars are rising, which suggests that momentum could be nearing another upswing.
Support and Resistance : Nearest Support Zone is $0.30 (previous resistance), then $0.25. The nearest Resistance Zone is $0.040 – $0.42, then $0.46.
CARDANO 1000% POTENTIALPrice already cross middle bollinger band at weekly timeframe, bullish pattern already formed, my longterm projection this coin can go around 5 or maybe 7 USD. lets sleep and wake up again next year xD

ADA flipping bullish 0.39754hr ascending triangle getting flipped right now. ada is on the verge of a huge breakout soon from the major resistance at 40c.
Next target in the 70's

Cardano (ADA) Price Rises With Soaring TransactionsSignaling Institutional Interest Cardano (ADA) Price Rises.
Recent data shared by a renowned analyst suggests a notable surge in Cardano transactions exceeding $100,000 over the past three months. This spike is seen as a potential indicator of heightened interest from institutional players and whales. This also indicates an upcoming price surge for ADA.
The latest data by Cardano Explorer shows that at Epoch 450, 451, and 452, the transactions have significantly seen a rise above 1,500,00. The transaction signifies a strong institutional hold on Cardano.
Cardano’s Flourishing Ecosystem
Recently, the launch of 150 projects and the continuous work on 1,304 projects highlight a vibrant ecosystem. This could be another reason for Cardano’s soaring transactions.
The creation of a staggering 9.1 million native tokens showcases the extensive customization options available on Cardano. Moreover, the establishment of 81,447 token policies exemplifies the diverse utility of Cardano’s asset creation capabilities. This makes Cardano a versatile choice for blockchain projects.
A significant milestone is the processing of 79.2 million transactions, affirming Cardano’s reliability and growing institutional adoption.
In addition to the growth of its ecosystem and network activity, Cardano developers have been working on scaling solutions, increasing node efficiency, and generally strengthening the backend infrastructure. Moreover, the recent completion of Fund11 proposals stands out as a testament to the platform’s dedication to innovation and community-led project funding.
Taking the advancement ground further, Cardano’s recent launch of Girolamo, an internet-enabled generative chatbot also gathered many eyes. Nevertheless, the chatbot is built to respond to a wide range of inquiries, from daily to industry-specific.
The Surging TVL And Price
Cardano’s Total Value Locked (TVL) again skyrocketed above all others. According to Defillama, Cardano’s TVL surged more than 50% within the year reaching $340 million first time in 19 Months.
The top positions are held by Indigo, Minswap, and Liqwid. The top three Dapps hold 78% of the Total Value Locked (TVL) in the Cardano ecosystem.
This came after the recent development in the Cardano (ADA) space as well as the Bitcoin rally. Resembling the same, Cardano (ADA) price saw an increase of 3.10% over the last day and 6.66% over the previous seven days. At the press time, ADA is trading at $0.408803, with $380,221,658.42 worth of trading volume in a day.

CARDANO (ADA) KEY WEEKLY LEVELSThese are the key levels of support and resistance for Cardano on the weekly chart.

ada moveyou must to wait and watch the btc.d and btc price. ada absloutly goes to more that 3$, but not now

3 Month Chart ADA Analysis predicting possible run to 46$ or 67$This is highly speculative, but it has some merits. By September 2025 ( date based on another MACD analysis), this could be a reality.
The moving averages in this chart are special fibonacci offset moving averages and it clearly shows the pink one is about to cross the purple, which the past time meant the big bull run. I have transposed the same kind of growth from current prices, like it did on the old bull run, and the targets are shown. Then if the bear market behaves similar to now, the new predicted lows after bear market are also shown.
This is highly speculative and I would be happy even with a lot less, but I am just showing this here as a possibility, the one we all dream of sometimes and it might be possible!

#ADA #CardanoIt is moving in an ascending triangle, which can escape from the top of the triangle towards the daily targets and touch the specified targets by breaking the sub-swing of the corner pattern. Therefore, after breaking the triangle and confirming the pullback, it is possible to enter a buy position around the specified targets.

Start renge ADA❤️❤️Thanks for boosting 🚀 and supporting us!
📈Start renge trend and entry to position sell in resistace & buy in support.
📊 (sell) : 0.3946
🔴 Stop Loss : 0.4122
🎯 Take Profit : 0.3441
🔗 For more communication with us, send a message in TradingView.

Ayone caught this one? $ADABroke trough my green level and continued upside. Would've been a very nice trade.

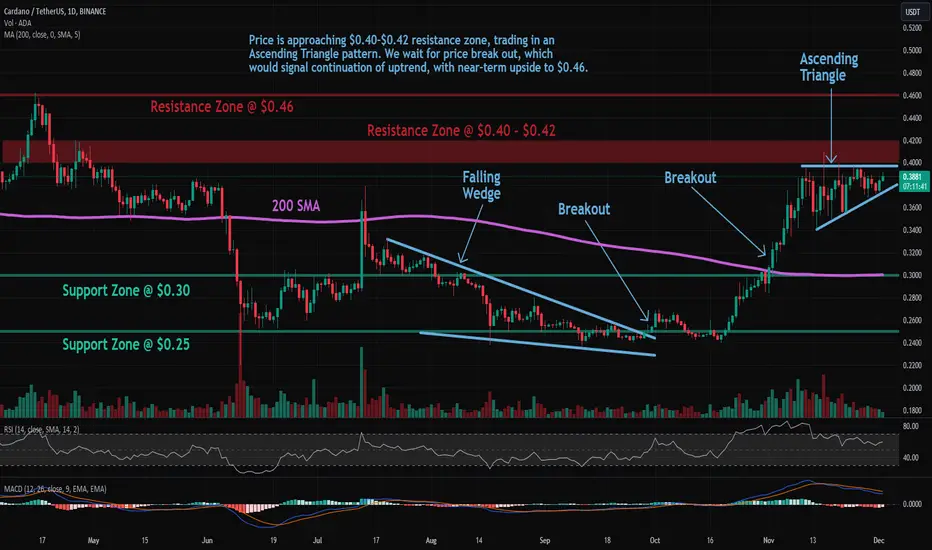
ADA: Ascending TriangleTrade setup : Price is approaching $0.40-$0.42 resistance zone, trading in an Ascending Triangle pattern. We wait for price break out, which would signal continuation of uptrend, with near-term upside to $0.46. Previously, price broke above 200-day moving average ($0.30), which confirmed a bullish trend reversal to an Uptrend.
Pattern : Ascending Triangle which is a continuation pattern (it typically breaks out in the direction of existing trend). Most traders wait for a breakout but Swing traders could trade between the trendlines (Buy at Support, Sell at Resistance) as long as the trendlines are still relatively far apart.
Trend : Uptrend across all time horizons (Short- Medium- and Long-Term).
Momentum is Mixed as MACD Line is below MACD Signal Line (Bearish) but RSI > 55 (Bullish).
Support and Resistance : Nearest Support Zone is $0.30 (previous resistance), then $0.25. The nearest Resistance Zone is $0.040 - $0.42, then $0.46.
ADA Weekly Bull flag target exactly at Weekly Pivot (0.708)I am expecting a quick move towards the Pivot and eventually making that into support and launching ground to the real bull market run.
The confluence of the measured target to exactly reach the Fibonacci pivot prices, makes the chance for this to happen even better.

ADA/USDT 1DAY UPDATE BY CRYPTOSANDERS !!Hello friends, welcome to this ADA/USDT update from Crypto Sanders.
Chart Analysis:- Cardano landed on its key support at 38 cents this week and, in the process, also registered a 3% loss in valuation. If bulls hold here, then ADA could end its correction.
The current resistance is found at 41 cents, and it may take some time before this cryptocurrency tests it again.
ADA has a good opportunity to reverse and end its correction at this level. If it fails and the current support falls, then the price is likely to go to 35 cents next.
I have tried to bring the best possible results in this chart.
If you like it, hit the like button and share your charts in the comments section.
Thank you.

ADA PREPING FOR A 6% MOVE UP!ADA has had a slow move up and is now rangebound in a beautiful bull-flag pattern. When looking at the bull-flag, we can see that the price seems to want to move higher. If in fact it does begin to move higher and breakout, the next major resistance would be the range highs around 41 cents.
Lets stay patient and see if we will get a breakout which would mean an opportunity to long!
i]Calculate Your Risk/Reward so you don't lose more than 1% of your account per trade.
Every day the charts provide new information. You have to adjust or get REKT.
Love it or hate it, hit that thumbs up and share your thoughts below!
This is not financial advice. This is for educational purposes only.

These are my levels $ADAThese are my ADA levels, seeing smaller candles nearing my green resistance level. Could be time for a short. Not taking a trade yet


#ADA/USDT is consolidating near the resistance zone in 4-Hour TF#ADA/USDT is consolidating near the resistance zone in 4-Hour TF!
CRYPTOCAP:ADA needs to clear the resistance zone to gain the bullish momentum. I am expecting a fake out above the zone before retracement.

ADA might bounce of this red levelBroke below my first (blue) level, looks like a new resistance here at red level. If we are looking for a bounce of the red level I'm shorting.

✴️ Cardano Update | Still Bullish But...When I opened this chart the drawing was already there, which means that I published something for this pair recently... And yes, the analysis still holds today.
We can see Cardano (ADAUSDT) trading within a range that I labeled "resistance zone". It seems to be true, a resistance zone because the action became choppy right after reaching this level.
➖ Daily ADAUSDT moved below EMA10.
➖ The RSI has been trending lower.
➖ The volume has been dropping...
Correction to follow next?
Any correction if it truly develops is likely to end in a higher low, which means that after the drop we get a continuation of the initial bullish move and so the pair grows.
It is all about patience and waiting or adjusting if you are one of those who daily trade.
Just remember, most traders lose money when day-trading, so it is better to focus on longer timeframe, buy, hold and wait.
Trading can also be successful in the really short-term. Short-term or long-term because the majority of the losses come medium-term.
Whatever you do, whatever you decide to do, whatever works for you, that's ok... Just slow down on the leverage because the trading bots adapt live to every order that you place.
If a big buy/LONG order shows up when the market is ranging, the bots will adapt and try to liquidate the order before moving up. If lots of sell/SHORT orders start to take place, the market will adapt and produce a move or wick higher even if there is about to be a retrace.
When any "excess" has been corrected and greed neutralized by the trading bots, that's when the new move develops... Everything is happening live based on market sentiment, the order books and every action taken by all the participants in this game. But once it starts moving, it is easy to jump in and follow the trend.
Years going down, years going up...
Bullish waves lasting for weeks or months, corrections lasting for several months.
When things are certain, that's when we use high leverage and go long.
When there is doubt, we sit it out... It is not the same now as it was before.
Once everything starts moving, it is harder to predict what might happen next. Because there is room for prices to drop, for prices to rise, for sideways... Fast or slow, it becomes a guessing game.
But, when a major down wave takes place and is followed by a new low, a support level forms and that's when we go long.
When a major rise happens and resistance is set, multiple rejection happen at this resistance then a short can be opened with low leverage because the risk is higher when shorting, it is harder... I recommend this only for experts.
If you are trading spot, so easy... We just hold.
If you don't trust Crypto, then you should trade stocks.
Hold long is easy because soon we will be in 2024.
In 2024 we get a full blown bull-market... More money will be made by holders than by those who think can trade every move because there are millions and millions of people trading and only a small percent get it right, the majority always lose.
Not that people are wise or stupid, not that you or I should change the way we see things or our market approach.
It is just that the game is hard, it moves contrary to the peoples choice.
➖ If the majority choses down, the market goes up.
➖ If the majority aims up, the market goes down... It is just how it works.
The only way to beat this "market psychology", is by gaining maximum experience before trading or looking at the bigger picture. Ignore the noise and that's how the game is won.
This is not financial advice. I am just sharing my personal experience... I am deeply grateful for your continued support!
Namaste.
