AGEN: catch this planned priceAGEN: catch this planned price
.
Just breakout with high demand and backtest with low supply vol.
US STOCKS- WALL STREET DREAM- LET'S THE MARKET SPEAK!
Agenus Inc.
No trades
Next report date
—
Report period
—
EPS estimate
—
Revenue estimate
—
−2.07 USD
−227.21 M USD
103.46 M USD
30.18 M
About Agenus Inc.
Sector
Industry
CEO
Garo H. Armen
Website
Headquarters
Lexington
Founded
1994
IPO date
Feb 4, 2000
Identifiers
3
ISIN US00847G8042
Agenus, Inc. is a clinical-stage company, which engages in the development and commercialization of technologies to treat cancers and infectious diseases. Its product pipeline includes Balstilimab, Zalifrelimab, AGEN1181, AGEN1327, AGEN2373, AGENt-797 and AGEN1777. The company was founded by Garo H. Armen and Pramod K. Srivastava on March 31, 1994 and is headquartered in Lexington, MA.
Related stocks

AGEN Long Trade Setup!🚀 🔥
📊 Breakout: AGEN is forming a bullish pattern and has broken above resistance with upward momentum.
📈 Key Levels:
Entry: $3.81 ✅
Stop Loss (SL): $3.68 🛡️
Target 1 (T1): $3.98 🎯
Target 2 (T2): $4.16 🚀
🔍 Volume Confirmation: Keep an eye on volume to ensure a strong breakout.
💡 Opportunity: A clea

AGEN: Go up from the bottomAGEN: Go up from the bottom
-Consolidation forming an inversed HnS pattern.
-Demand zone support.
-Key level support.
-Chart pattern support.
.
More plans at fb group US STOCKS- WALL STREET DREAM

AGEN reverse split pumpA reverse split pump in the small cap stock market refers to a situation where a company, typically with a low stock price, undergoes a reverse stock split in order to artificially inflate its stock price. Here's how it typically works:
Low Stock Price: Small cap stocks often have low prices per sh

AGEN - LONGAGEN, a leader in discovering and developing novel immunological agents to treat various cancers, today announced that Dr. Garo Armen, Chairman and CEO, will participate in a fireside chat and investor one-on-ones at the upcoming Leerink Global Biopharma Conference on March 11th - 13th in Miami Beac

AGEN | Agenus Inc. Healthcare | Biotechnology | USA | NASDAQ
📈 Technical Chart Patterns & Trend Analysis 📉
Identifying potential trading opportunities based on trend analysis:
After forming Bullish divergence the price charts signals a potential trend reversal, indicating a shift from a downtrend to a possible uptrend.

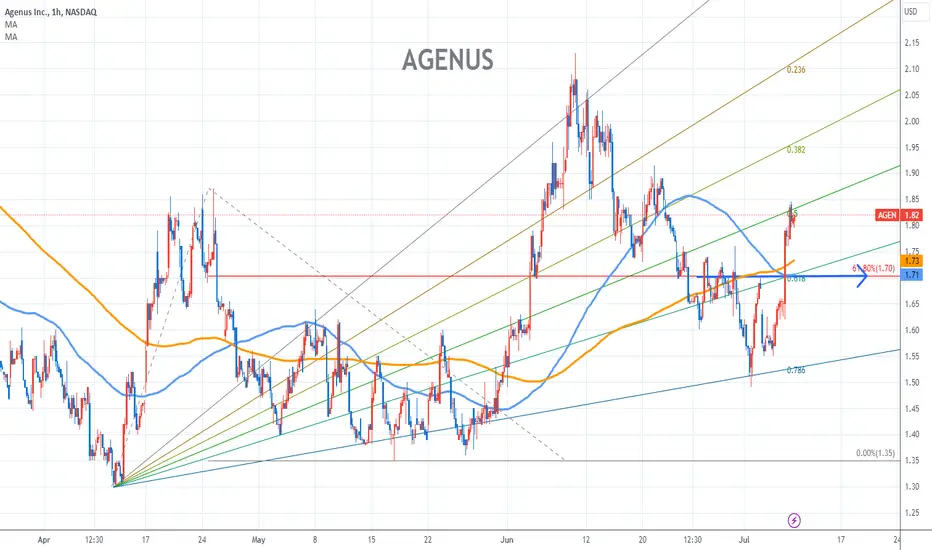
AGENUS Stock Chart Fibonacci Analysis 071023 Trading Idea
1) Find a FIBO slingshot
2) Check FIBO 61.80% level
3) Entry Point > 1.7/61.80%
Chart time frame : B
A) 15 min(1W-3M)
B) 1 hr(3M-6M)
C) 4 hr(6M-1year)
D) 1 day(1-3years)
Stock progress : A
A) Keep rising over 61.80% resistance
B) 61.80% resistance
C) Hit the bottom
D) Hit the top
AGENUS going back inAgenus NASDAQ:AGEN is a stock that I have not followed since they were forced (unfairly) by the FDA to pull their NDA for balstilimab. However recently price action has started to look favourable and this is in conjuction with ASCO where the company is presenting clinical data from 2 trials.

A good breakoutTraditionally breakouts like these need high volume, but I do like it.
Tradingview requires me to type more, so I will.

AGEN | InformativeNASDAQ:AGEN
If it passes the bearish line it's time for a short position, and if it passes the bullish line it's time for the Long position, the price targets are on the chart.

See all ideas
Summarizing what the indicators are suggesting.
Neutral
SellBuy
Strong sellStrong buy
Strong sellSellNeutralBuyStrong buy
Neutral
SellBuy
Strong sellStrong buy
Strong sellSellNeutralBuyStrong buy
Neutral
SellBuy
Strong sellStrong buy
Strong sellSellNeutralBuyStrong buy
An aggregate view of professional's ratings.
Neutral
SellBuy
Strong sellStrong buy
Strong sellSellNeutralBuyStrong buy
Neutral
SellBuy
Strong sellStrong buy
Strong sellSellNeutralBuyStrong buy
Neutral
SellBuy
Strong sellStrong buy
Strong sellSellNeutralBuyStrong buy
Displays a symbol's price movements over previous years to identify recurring trends.
Frequently Asked Questions
The current price of AGEN is 2.77 USD — it has decreased by −7.16% in the past 24 hours. Watch Agenus Inc. stock price performance more closely on the chart.
Depending on the exchange, the stock ticker may vary. For instance, on NASDAQ exchange Agenus Inc. stocks are traded under the ticker AGEN.
AGEN stock has fallen by −2.93% compared to the previous week, the month change is a −35.21% fall, over the last year Agenus Inc. has showed a −11.89% decrease.
We've gathered analysts' opinions on Agenus Inc. future price: according to them, AGEN price has a max estimate of 23.00 USD and a min estimate of 6.00 USD. Watch AGEN chart and read a more detailed Agenus Inc. stock forecast: see what analysts think of Agenus Inc. and suggest that you do with its stocks.
AGEN reached its all-time high on Feb 7, 2000 with the price of 8,580.00 USD, and its all-time low was 1.38 USD and was reached on Apr 7, 2025. View more price dynamics on AGEN chart.
See other stocks reaching their highest and lowest prices.
See other stocks reaching their highest and lowest prices.
AGEN stock is 8.08% volatile and has beta coefficient of 2.23. Track Agenus Inc. stock price on the chart and check out the list of the most volatile stocks — is Agenus Inc. there?
Today Agenus Inc. has the market capitalization of 101.34 M, it has increased by 2.76% over the last week.
Yes, you can track Agenus Inc. financials in yearly and quarterly reports right on TradingView.
Agenus Inc. is going to release the next earnings report on Mar 12, 2026. Keep track of upcoming events with our Earnings Calendar.
AGEN earnings for the last quarter are 1.94 USD per share, whereas the estimation was 2.20 USD resulting in a −11.68% surprise. The estimated earnings for the next quarter are −1.04 USD per share. See more details about Agenus Inc. earnings.
Agenus Inc. revenue for the last quarter amounts to 30.20 M USD, despite the estimated figure of 80.39 M USD. In the next quarter, revenue is expected to reach 28.10 M USD.
AGEN net income for the last quarter is 63.91 M USD, while the quarter before that showed −27.95 M USD of net income which accounts for 328.63% change. Track more Agenus Inc. financial stats to get the full picture.
No, AGEN doesn't pay any dividends to its shareholders. But don't worry, we've prepared a list of high-dividend stocks for you.
As of Feb 12, 2026, the company has 316 employees. See our rating of the largest employees — is Agenus Inc. on this list?
EBITDA measures a company's operating performance, its growth signifies an improvement in the efficiency of a company. Agenus Inc. EBITDA is −50.28 M USD, and current EBITDA margin is −107.37%. See more stats in Agenus Inc. financial statements.
Like other stocks, AGEN shares are traded on stock exchanges, e.g. Nasdaq, Nyse, Euronext, and the easiest way to buy them is through an online stock broker. To do this, you need to open an account and follow a broker's procedures, then start trading. You can trade Agenus Inc. stock right from TradingView charts — choose your broker and connect to your account.
Investing in stocks requires a comprehensive research: you should carefully study all the available data, e.g. company's financials, related news, and its technical analysis. So Agenus Inc. technincal analysis shows the sell today, and its 1 week rating is sell. Since market conditions are prone to changes, it's worth looking a bit further into the future — according to the 1 month rating Agenus Inc. stock shows the strong sell signal. See more of Agenus Inc. technicals for a more comprehensive analysis.
If you're still not sure, try looking for inspiration in our curated watchlists.
If you're still not sure, try looking for inspiration in our curated watchlists.