Housing - 4hr - 34 could reject under/at 500 HullCould reject and if does that would be peak in housing
IYR trade ideas

BUY IYR Asc Tri BreakoutAMEX:IYR
Ascending Triangle Breakout & Resistance line tested as support w Consolidated candles forming a buy pinbar
BUY at 88, SL at 82
Also supported fundamentally by falling interest rates (10Y treasury)


Trouble ahead for real estate?$IYR $DRN $DRV
Posted a year ago: as my target
Real estate scares me right now (mostly because I own physical property). This looks bearish with that overhead bear divergence.


TOP IN PLACE 5 WAVES ENDING IN IYR INDEX TELL to SELL OUT IS NOW in IYR 5 wave up or a minor one more but odds are now at 96 % of I T top in this index would look fro a drop at min .382 into mid march panic

$IYR looks like we can retest the ATH Inflation becomes a tailwind for RE + Interest rates don't go much higher

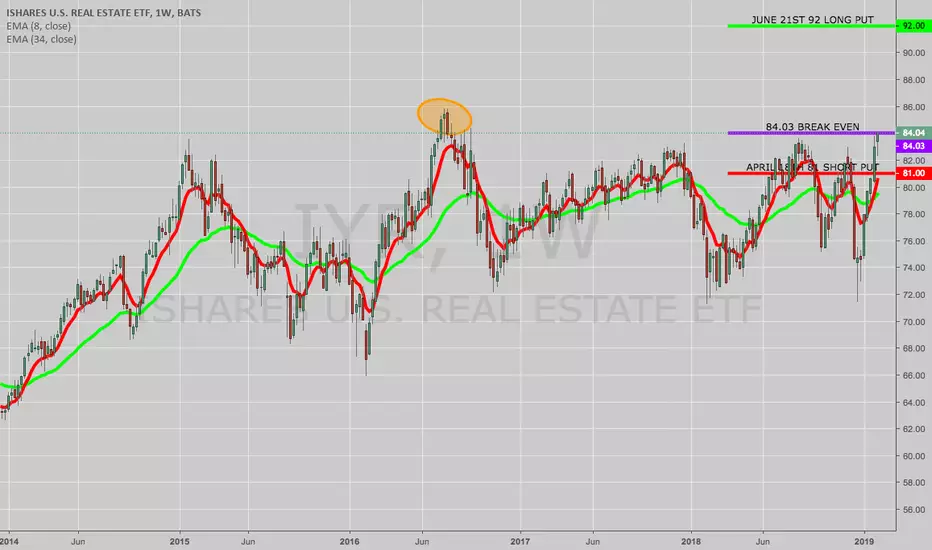
TRADE IDEA: IYR APRIL/JUNE 81/92 PUT DIAGONALAlthough this trade isn't quite ripe for me yet (I'm waiting for all time highs (circled), I thought I'd stick it out there in order to price the setup out, at least preliminarily. Naturally, the strike prices and/or expiries will have to be adjusted should a short opportunity come to pass ... . As with my TLT calendar (See Post Below), this trade operates on the assumption that the underlying will get dinged somewhat in a tightening rate environment (although it seems to bounce back every time), with the next hike being talked about in June.
Metrics:
Max Loss On Setup/Buying Power Effect: $797/contract
Max Profit On Setup: $303/contract ($151 at 50% max; 18.9% Return on Capital).
Break Even: 84.03 versus 84.04 spot
Debit Paid to Spread Width Ratio: 72.5%
Delta: -45.98
Theta: .45
Something cool to swing trade the ups/downsNice range for like 4 years.. trade it. If it was going to break out of it in either direction it would have done so by now.


IYR IS RISKY-- higher lows, and resistance remains @79.20, if the triangle is valid, then short IYR.
-- not a reverse
-- keep going down after break downwards the triangle
set stop @ 79.3

IYR:(Short) FIB Retracement, Average Directional Index, MACDIYR Weekly Chart:
Showing Divergence since March 2009 among stock price and Average Directional Index.
Floor of MACD repeatedly established, previously broken.
Bear Wedge Forming along trend lines.
For Educational Purposes Only

Short IYR (U.S Real Estate)Huge weekly divergence according to my indicator, just like in 2008. THE BIG SHORT.

IYR short term sweet point - oversold
- supportive level at 38.2% of the uptrend from Feb 2018
- because it is far from the neckline $82.00, it will not probably break out and get new high
- still considered it is a rebound rather than reverse.

IYR Elliott Wave Analysis: Tracking Recent Price ActionHello Traders,
IYR ended the cycle from 03/23/18 (72.71) low at the peak of 07/06/18 (82.20) in blue wave (3). Below from there, the ETF ended the correction from 07/06/18 (82.20) peak in blue wave (4) at 79.23 low.
Up from there, the ETF ended the cycle from 07/25/18 low in red wave W at 08/20/18 (83.62) peak. The internals of that move unfolded as a Elliott Wave double correction where it ended black wave ((w)) at 08/06/18 peak (82.46), black wave ((x)) pullback at 08/13/18 low (80.55) and finally black wave ((y)) of red wave W at 08/20/18 peak (83.60). The ETF is currently in the progress of correcting the cycle from 07/25/18 low (79.23) in 3-7 or 11 swings in red wave X.
Near-term focus remains towards 81.74-81.48, which is 100%-123.6% Fibonacci extension area of black wave ((a))-((b)) to end black wave ((c)) of red wave X pullback. Afterwards, the ETF is expected to find buyers for red wave X higher ideally or should do a 3 waves reaction higher at least. We don’t like selling it into a proposed pullback as the right side remains to the upside.

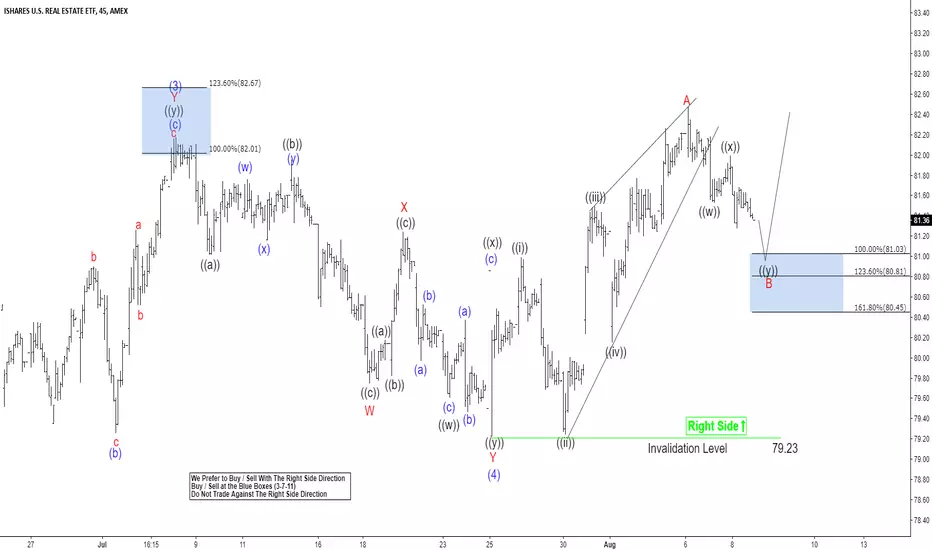
IYR Elliott Wave Analysis: Pullback can Provide Buying ChanceHello Traders,
In this Elliott Wave Analysis, we will have a look at the Real Estate ETF (IYR).
IYR ended the cycle from 03/23/18 (72.71) low at the peak of 07/06/18 (82.20) in blue wave (3). Below from there, the ETF ended the correction from 07/06/18 (82.20) peak in blue wave (4) at 79.23 low. Up from there, it broke already to new highs, confirming that the next extension higher has started.
Near-term IYR ended the correction from 07/06/18 (82.20) peak in blue wave (4) at 79.23 low. The internals of blue wave (4) unfolded as Elliott Wave double correction which ended red wave W at 07/18/18 low (79.76), red wave X pullback at 07/19/18 peak (81.26) and red wave Y of blue wave (4) at 07/25/18 (79.23).
Up from there, the ETF ended the cycle from 07/25/18 low in red wave A at 08/06/18 (82.50) peak. The internals of that move unfolded as a leading diagonal where it ended black wave ((i)) at 07/26/18 low (81.01), black wave ((ii)) pullback at 07/30/18 low (79.24), black wave ((iii)) at 07/31/18 peak (81.51), black wave ((iv)) at 08/01/18 low (80.15) and finally black wave ((v)) of red wave A at 08/06/18 peak (82.50). The ETF is currently in the progress of correcting the cycle from 07/25/18 low (79.23) in 3-7 or 11 swings in red wave B.
Near-term focus remains towards 81.03-80.81, which is 100%-123.6% Fibonacci extension area of black wave ((w))-((x)) to end red wave B pullback. Afterwards, the ETF is expected to find buyers for red wave B higher ideally or should do a 3 waves reaction higher at least. We don’t like selling it into a proposed pullback as the right side remains to the upside.
watching for confirmation of real estate crash smart money forming potential head and shoulders and AD same height as price in 06-07

IYR, Daily, BearishThere's a triple divergence on the IYR chart (U.S. Real Estate ETF).
1. First high
2. Second high, lower high on MACD
3. Third high, even lower high on MACD
There is some space between 1. and 2. on the MACD. I would appreciate if anyone knows whether the MACD gap would disqualify 1. as the first high in a divergence analysis.

Watching real estate!!Hello friends
It's been a while since i posted. I been enjoying summer and doing some activities with family and friends. Man i am not sure if i posted about italian 10 year yields but it paid off quite well. They are ripping and it was very nice monthly chart. I am watching reit's as rates are rising and chart pulled back quite a bit. Looking for proper short sell signal to take advantage of move lower. Looking for dxy pullback here and some gold and silver strength. I am in EDR - silver etf which took off and is consolidating now. I'll keep you posted if i see interesting chart in forex. There has been some nice moves lately in usdjpy, gbpaud and eurusd.
Thank you for the read and enjoy.
Take care

Short Real EstateI dont trade Real estate but i would if my trade/platform would give the chance.
A nice short seems to be presenting here. Entry below Heikin ashi doji en stop above it. TP below in range. Move SL at own discretion, but not to tight.
