ASTBTCASTBTC
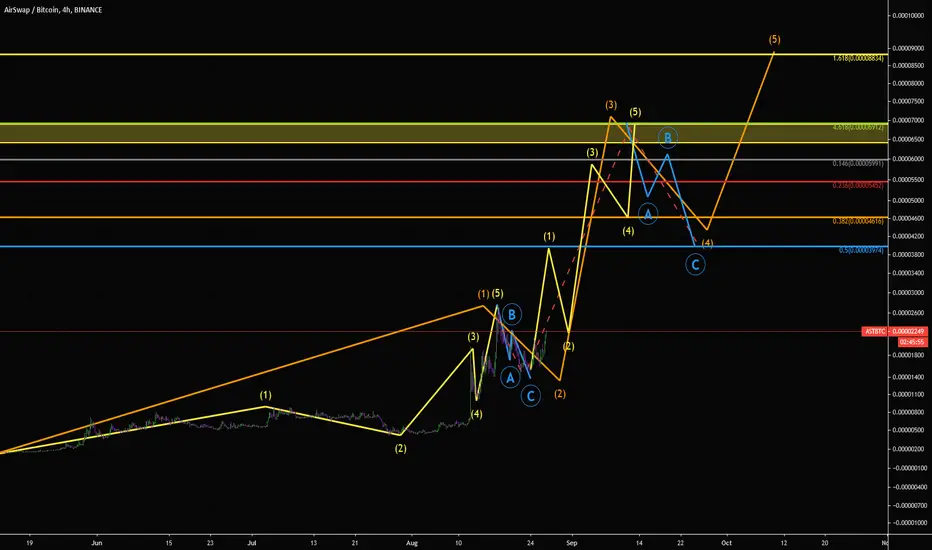
Break of the trend line, possibly growing
1 - 0.00001416
2 - 0.00001545
3 - 0.00001695
4 - 0.00002190
f you like what I do, put 👍 and subscribe
Waiting for your comment, what do you think about this?
ASTBTC trade ideas

AirSwap Long-Term (Weekly Chart Analysis)Let's take a look at AirSwap (ASTBTC) and how it is behaving around the EMA lines.
First, we saw ASTBTC break above EMA50, quickly followed by a test of this level as support.
Second, we saw ASTBTC break above EMA100, quickly followed by a test of this level as support.
Now, we have prices consolidating strong above EMA10, EMA50, and EMA100...
This opens the door for additional growth.
If prices drop (red arrow), we remain bullish and still expect another jump (2nd green arrow).
We are bullish mid/long-term... The altcoins will continue to grow.
As long as we have higher highs and higher lows... It doesn't matter how long it takes or if Bitcoin is going down or up... Higher highs and higher lows, is the classic definition of an uptrend, so there can be more... GREEN.
Namaste.

Air Swap... forming Adam&Eve patternWe have here a kind of double bottom pattern called Adam&Eve
because first bottom is narrow and second is wide
This pattern attributed to Thomas Bulkowski, which about this
published his book's named "Encyclopedia of Chart Patterns,"
As you see RSI in strong bullish action and passed from 50 line
and now in 55.
MACD progressively bullish and starting to grow above zero line.
Do not forget "Plan your trade and trade your plan."

ASTBTC AirSwap Break Up or Break Down? Airswap has been in a downward trend since late august. It has now fallen more than 50% below its all time high.
It looks to be forming a large descending wedge, which are typically bullish formations, but the market is quite volatile right now.
It briefly tried to break to the upside a few days ago but was immediately pushed down. A large move should be coming either way very shortly.
Red line signifies temporary local support. A daily close below this line and the turquoise will be the next area of interest.
Green lines signify potential profit points if it does go bullish.
AST has historically made very swift and large moves, so this is high risk/high reward.
This is not financial advice.

AST/BTC (Potential Double Bottom?)BINANCE: ASTBTC
-AirSwap is testing previous support area for potential Double bottom reversal
-If AST can hold the current level and see a breakout of the resistance trendline
-It will signal a strong reversal in the midterm and may target up to 2100 sat
-But if the market price failed to hold, it will likely to test previous resistance at 992 sat
-The 900-1000 sat is a strong confluence or High demand zone for the Buyers to enter
-But until the trendline resistance is not broken, Bears is still in control
-So please don't just jump into the trade without planing
``````````````````````````````````````````````
Trading Involves High Risk
Not Financial Advice
Please Exercise Risk Management
``````````````````````````````````````````````
If You Like My Daily Published Ideas
A little Help By Supporting My Channel
Through Leaving A Thumbs Up, Comment & Follow
Happy Trading! --> Thank You! :)
``````````````````````````````````````````````

ASTBTC Watch MACD moving more bullish. Potential BIG move comingASTBTC is now breacking bullish after a higher low.
This pair here is looking really good and has lots of potential for additional growth
We have increasing volume while pries move back above EMA10, EMA50 where EMA 100 held support perfectly.
MACD is slowing improving so it might take some more days before AST moves up.


Air swap Resolution phase start...price crosses up downward line with one powerful candle
and we have hidden divergence in this reversal(Hidden bullish divergence usually occurs in the correction of a reversal uptrend)
RSI crosses up 50 with strong movement

✳️AirSwap [AST/BTC] on Sept-10 #AST $AST #ASTBTCAST is forming a Double Bottom pattern in order to push it up and the easy-to-reach target is the 1400sts zone. This is also an important area and we need to watch it carefully.
The larger pattern is the Falling Wedge, and if the AST breaks the 1400sts, the target will be the 2200sts zone and may even retest the old peak around 2700sts this September.
Private Signal :

Bought the AST DipPicked Up a few alts on this little dip.
Will be nice swings if crypto decided to adopt the "Better than V-shaped recover" attitude.
Probably going to hold this for longer depending on how ALTs are looking when we get there.


AST/BTCEither Ast will pump right now or from go back to the mentioned support and then pump.
Ast will Mooooo either way, so fasten ur seat belt for the takeoff.

AST/BTC: BINANCE (BREAK OUT )Pair: AST / BTC 🛒
⏰ 1399/06/09 ⏰
🕰 30/08/2020 🕰
Duration:
📈 SCALP - SHORT 📈
Ex: Binance
🛒 Buy: 1780 - 1800 🛒
🛒 Buy: DM ME- DM ME🛒 DCA
👉Sell Targets👈
🎯TP1: 1845 🥉
🎯TP2: DM ME 🥈
🎯TP3: DM ME🥇
🎯TP4: DM ME🏆
🎯TP5: DM ME🚁
⛔️ SL : 1679 ⛔️


ASTBTC [200% LONG] BY MID SEPTEMBER TP2/3200% BY SEPTEMBER 15
Look out for a retracement on target Rebuy after like on the chart above.
3690, 5855


