ACW Bullish signals confirm breakout.Close above 200 day M.AvACW , trading on ASX, shows very strong momentum with a weekly close above the 200 day moving average. and now the second week closing above the long term down trend line.
The chart gap from Aug 2024 between 5.5 and 6.8 looks set to be closed.
Retracement target of 10 c should be met with further s
Actinogen Med Ltd.
No trades
Next report date
—
Report period
—
EPS estimate
—
Revenue estimate
—
−0.0032 USD
−9.69 M USD
0.00 USD
2.88 B
About Actinogen Medical Limited
Sector
Industry
CEO
Steven G. Gourlay
Website
Headquarters
Sydney
Founded
1999
IPO date
Oct 16, 2007
Identifiers
2
ISIN AU000000ACW3
Actinogen Medical Ltd. is a clinical stage Australian biotechnology company, which focuses on the development of novel treatments or cognitive impairment associated with neurological, psychiatric, and metabolic diseases due to raised cortisol. The company was founded by Geoff E. D. Brooke & David Keast on March 23, 1999 and is headquartered in Sydney, Australia.
Related stocks

Multiple bullish signals on ACW. Big chart gap to fill @6.5Very positive signals on MACD and DMI . Momentum building nicely
Big chart gap to fill at 6,5c offering a 60% gain in shareprice.
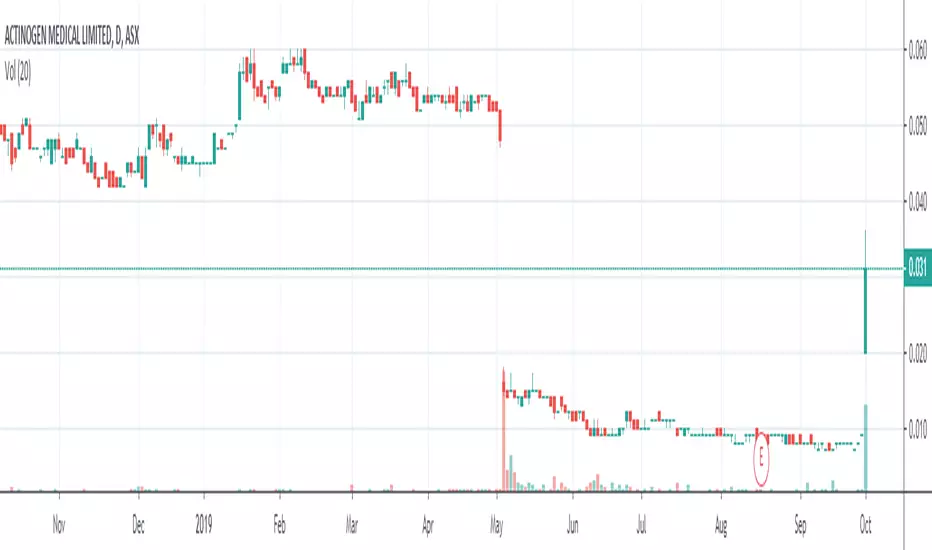
A lot of consolidation has taken place below 3c in past 5 months removing the surplus overhang of shares from the previous capital raising.

Finer Market Points: ASX Top 10 Momentum Stocks: 16 Jul 2024ASX:I88 NYSE:WTM ASX:AL3 XETR:DGR ASX:FBR ASX:ACW AMEX:TTT GETTEX:SKS ASX:3DP ASX:EZZ
Momentum leading shares are the market's best performers today. They are the fastest-growing shares on the ASX over the last 90 days. These companies can't get to be leaders without first appear

Wait & watchFrom ATH ($0.195c) in June 2021, it retraced to 61.8%fib zone around $0.08c. Since then it has recovered some lost ground making higher lows. $0.11c is strong historical S/R zone but a break & close above that will potentially be bullish


Shares in ACW are this morning trading up over 200%Shares in ACW are this morning trading up over 200% from their closing price yesterday. The company released an update regarding their Xanamem product.
The key points the company focused on in the release were.
- Statistically significant results demonstrate cognitive improvement in healthy elderl
ACW UpdateOn the daily and weekly both charts on the MACD show some south ,movement while I was pasting up the head and shoulders.
I will be looking for a good buy in a day or two to jump on the ride north as soon as MACD start to show a change.
Looking for Tips and education so feel free to comment.

ACWI've been watching this one for a very little one waiting for some news.
- News drop and bull pushed and found some resistance at 5c.
- after over a week it looks to me as resistance has thinned out.
I think we are on a new upward trend

ACW confirms reversalFollowing on from the reversal setup a few days ago, ACW has confirmed the reversal with a higher low. Should see continued rise, albeit slowly, driven by improving FA and expectation of trial results and updates.

ACW clear breakout on VolumeA very clear breakout on volume for ACW today. Looks like selling has eased off. Should push higher on sustained volume. look for a confirmation in coming days. Good FA behind this one.

See all ideas
Summarizing what the indicators are suggesting.
Neutral
SellBuy
Strong sellStrong buy
Strong sellSellNeutralBuyStrong buy
Neutral
SellBuy
Strong sellStrong buy
Strong sellSellNeutralBuyStrong buy
Neutral
SellBuy
Strong sellStrong buy
Strong sellSellNeutralBuyStrong buy
An aggregate view of professional's ratings.
Neutral
SellBuy
Strong sellStrong buy
Strong sellSellNeutralBuyStrong buy
Neutral
SellBuy
Strong sellStrong buy
Strong sellSellNeutralBuyStrong buy
Neutral
SellBuy
Strong sellStrong buy
Strong sellSellNeutralBuyStrong buy
Displays a symbol's price movements over previous years to identify recurring trends.
Frequently Asked Questions
The current price of ATGGF is 0.0311 USD — it has decreased by −22.25% in the past 24 hours. Watch Actinogen Med Ltd. stock price performance more closely on the chart.
Depending on the exchange, the stock ticker may vary. For instance, on OTC exchange Actinogen Med Ltd. stocks are traded under the ticker ATGGF.
We've gathered analysts' opinions on Actinogen Med Ltd. future price: according to them, ATGGF price has a max estimate of 0.06 USD and a min estimate of 0.06 USD. Watch ATGGF chart and read a more detailed Actinogen Med Ltd. stock forecast: see what analysts think of Actinogen Med Ltd. and suggest that you do with its stocks.
ATGGF reached its all-time high on Jan 9, 2023 with the price of 0.1000 USD, and its all-time low was 0.0100 USD and was reached on Aug 9, 2019. View more price dynamics on ATGGF chart.
See other stocks reaching their highest and lowest prices.
See other stocks reaching their highest and lowest prices.
ATGGF stock is 28.62% volatile and has beta coefficient of −0.14. Track Actinogen Med Ltd. stock price on the chart and check out the list of the most volatile stocks — is Actinogen Med Ltd. there?
Today Actinogen Med Ltd. has the market capitalization of 103.06 M, it has decreased by −9.38% over the last week.
Yes, you can track Actinogen Med Ltd. financials in yearly and quarterly reports right on TradingView.
Actinogen Med Ltd. is going to release the next earnings report on Feb 19, 2026. Keep track of upcoming events with our Earnings Calendar.
ATGGF net income for the last half-year is −4.32 M USD, while the previous report showed −5.05 M USD of net income which accounts for 14.60% change. Track more Actinogen Med Ltd. financial stats to get the full picture.
No, ATGGF doesn't pay any dividends to its shareholders. But don't worry, we've prepared a list of high-dividend stocks for you.
Like other stocks, ATGGF shares are traded on stock exchanges, e.g. Nasdaq, Nyse, Euronext, and the easiest way to buy them is through an online stock broker. To do this, you need to open an account and follow a broker's procedures, then start trading. You can trade Actinogen Med Ltd. stock right from TradingView charts — choose your broker and connect to your account.
Investing in stocks requires a comprehensive research: you should carefully study all the available data, e.g. company's financials, related news, and its technical analysis. So Actinogen Med Ltd. technincal analysis shows the neutral today, and its 1 week rating is sell. Since market conditions are prone to changes, it's worth looking a bit further into the future — according to the 1 month rating Actinogen Med Ltd. stock shows the sell signal. See more of Actinogen Med Ltd. technicals for a more comprehensive analysis.
If you're still not sure, try looking for inspiration in our curated watchlists.
If you're still not sure, try looking for inspiration in our curated watchlists.