ATOMUSDTAbove the support zone and longterm trendline
It is a good opportunity considering the strong support which is around 6.5$
Lets see how it goes
ATOUST trade ideas

Switching trend -- ATOMAlthough the market experienced a long period of rise, many tokens experienced significant callback after BTC failed to break through ATH.
So again we explain how the TSB indicator is used to help even with switching trends. TSB indicator is a trend indicator based on AI algorithm. When the TSB indicator gives a BUY signal, it means that the token has entered a bullish trend. The bullish trend will continue until the TSB indicator reaches the SELL signal level. In this process, when the main columns of the indicator area touches the wavy area, the bulls will be stimulated and receive support. Likewise, when the TSB indicator prompts a SELL signal, the token enters a bearish trend until it prompts a BUY signal.
Combined with the trend of ATOM, the TSB indicator prompts two bullish trends, and the wavy area plays a supporting role until the SELL signal appears. On April 10, after the TSB indicator gave a SELL signal, ATOM entered a bearish trend.
Introduction to indicators:
Trend Sentinel Barrier (TSB) is a trend indicator, using AI algorithm to calculate the cumulative trading volume of bulls and bears, identify trend direction and opportunities, and calculate short-term average cost in combination with changes of turnover ratio in multi-period trends, so as to grasp the profit from the trend more effectively without being cheated.
KDMM (KD Momentum Matrix) is not only a momentum indicator, but also a short-term indicator. It divides the movement of the candle into long and short term trends, as well as bullish and bearish momentum. It identifies the points where the bullish and bearish momentum increases and weakens, and effectively capture profits.
Disclaimer: Nothing in the script constitutes investment advice. The script objectively expounded the market situation and should not be construed as an offer to sell or an invitation to buy any cryptocurrencies.
Any decisions made based on the information contained in the script are your sole responsibility. Any investments made or to be made shall be with your independent analyses based on your financial situation and objectives.

Cosmos (ATOM ) to $2.50But first price action shall move to the 11-12 dollar resistance before the downtrend continues.
** trading opportunity **
On the above weekly chart pice action has confirmed a bear flag breakout. The flagpole measurement forecasts an eventual target of $2.50.
Meanwhile a breakout of RSI resistance prints with a weekly bullish engulfing candle. The weeks ahead shall likely print a strong upward move at first until resistance.
Is it possible this resistance test at $12 fails to hold? Sure.
Is it probable? No.
Ww
Type: Trade
Risk: <=6%
Timeframe: Long now this month until resistance
Return: 50% or thereabouts

ATOMUSDT - Doing retracement from CrashI am not expecting a good pullback and still bearish sentiments are showing on the chart.
Can expect another LL and market is currently searching for LH.
Resistance and supports are mentioned

ATOM (COSMOS) SHOULD JOIN THE ALT SEASON FROM HERE
BINANCE:ATOMUSDT should be doing this if it really have intention of joining the bull run. It is quite close to the invalidation level but the risk reward is insane almost 90.
More update to come stay tuned. BINANCE:PEPEUSDT is at the level i called so is many alts. We saw this coming billions have been liquidated.
OTHER ANALYSIS

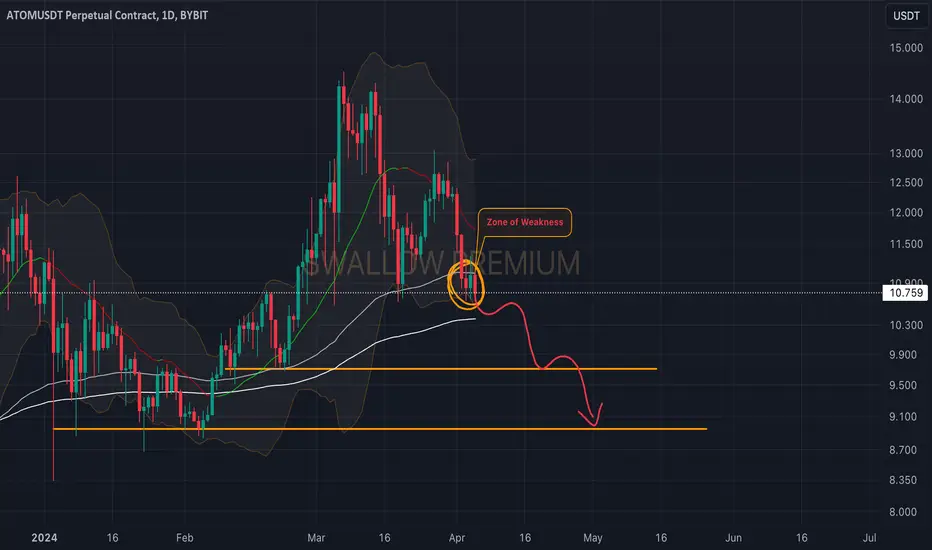
Cosmos(ATOM): Zone is Weak, Drop Might be Hard!We are back with Cosmos Coin, and our gameplan still remains the same. We are looking for further movement to lower zones towards our target areas of orange lines.
We see the demand for selling pressure on Cosmos, so be careful, as we might see some sharp moves here!
Swallow Team

Price blocks to buy ATOM on possible BTC correctionHere some price block to buy ATOM on possible BTC correction move

Atom Break and RetestCosmos looks like it broke out after a clear accumulation and is now retesting, if it holds here it looks good to go to around $15. I don't support trading altcoins but throwing some to spot here could be good risk&reward.

🌟💰 "Atom Coin Analysis: Insights for Strategic Trading" 🛠️💹🛠️ Let's delve into this intriguing project and analyze it for futures trading.
📊 Atom coin, like many other coins in the market, is currently consolidating within its range and has been in a box for almost 700 days on the weekly timeframe.
🔗 The reason for the lack of movement in these coins is their correlation with Bitcoin, which is currently in a bearish trend. Bitcoin still holds more dominance compared to these coins, and the time for these coins to move for buying in the spot market has not yet arrived.
💹 In the 4-hour timeframe, we have a daily support level for short positions, and we currently see reactions in this range indicating the presence of our support line. After breaking this support at 10.679, we can open short positions to continue our 4-hour trend.
🚀 For long positions, we currently don't have an entry point and are waiting for movement towards the 11.329 line and a reaction to it, followed by its break for a long position. However, for this, our volume must be increasing.
💡 Our upcoming supports are 9.749, 8.941, and our resistances are 11.329, 12.851, and 14.265. Since we are in a range in most higher timeframes, we can manage with small stops, quick profit-taking, and closing positions.
💰 I recommend staking this coin in your portfolio or wallet if you hold it, and earn annual profits from it!
😊 If you'd like me to analyze a specific coin or currency pair, be sure to comment so that I can allocate the next analysis for you!
⚠️ Also, please remember that I'm just an analyst, and this isn't financial advice. We're here to stay in the market and maximize profits by adhering to risk and capital management principles.

Cosmos | ATOMAfter taking profit at 15$ its correction time and here we are, but whats next?
The price of ATOM is $11 today with a 24hour trading volume of 120 million dollar. This represents a -1% price decline in the last 24 hours and a -15% price decline in the past 7 days
Cosmos bills itself as a project that solves some of the “hardest problems” facing the blockchain industry. It aims to offer an antidote to “slow, expensive, unscalable and environmentally harmful” proof-of-work protocols, like those used by Bitcoin, by offering an ecosystem of connected blockchains.
The project’s other goals include making blockchain technology less complex and difficult for developers thanks to a modular framework that demystifies decentralized apps. Last but not least, an Interblockchain Communication protocol makes it easier for blockchain networks to communicate with each other — preventing fragmentation in the industry.
Cosmos’ origins can be dated back to 2014, when Tendermint, a core contributor to the network, was founded. In 2016, a white paper for Cosmos was published — and a token sale was held the following year. ATOM tokens are earned through a hybrid proof-of-stake algorithm, and they help to keep the Cosmos Hub, the project’s flagship blockchain, secure. This cryptocurrency also has a role in the network’s governance.
I will start average buying at 9$ and I will close my shorts at 9.3$

ATOMic Impulse Soon 💣Hello TradingView Family / Fellow Traders. This is Richard, also known as theSignalyst.
📈 ATOM has been overall bullish, trading within the flat rising wedge pattern in black.
Currently, ATOM is in a correction phase, approaching the lower bound of the wedge.
Moreover, it is retesting a strong support and round number $10 in gray.
🏹 Thus, the highlighted Atom logo with the blue arrow is a strong area to look for buy setups as it is the intersection of the gray support and lower black trendline.
📚 As per my trading style:
As #ATOM approaches the blue arrow zone, I will be looking for bullish reversal setups (like a double bottom pattern, trendline break , and so on...)
📚 Always follow your trading plan regarding entry, risk management, and trade management.
Good luck!
All Strategies Are Good; If Managed Properly!
~Rich


Atom 24 % Pump Or 16 % Dump... ?!The ATOM bullish trendline is about to break.
Short trade possibility:
Entry point: After breaking the bullish trendline and the $10.72 range
Profit targets:
$10.25
$9.68
$8.98
Long trade possibility:
Entry point: Above the $11.40 range
Profit targets:
$12.58
$14.14
Important notes:
This analysis is for informational purposes only and should not be considered as investment advice.
Do your own research and use a proper risk management strategy before any trade.
The cryptocurrency market can be highly volatile, so trade with caution and awareness of the risks.

Atom Long PositionSplitting one position into 3 entries with hedging if necessary.
Expecting high CPI volatility with bitcoin halving news.
nothing more

Atom 07/04/2024Atom is consolidating at RH level which is good. We need a breakout candle at this level. Even if we test 0.5 level it is all good.

TRADE PLAN FOR ATOMHello traders , atom breakdown for all options of buy levels with out trade plan.
from the chart we expect a continuation in the channel and in case next levels are indicated.
tradehubng

📈ATOM: Potential Long Opportunity on 4-Hour Timeframe💎🔍Today, let's focus on Cosmos (ATOM) on the 4-hour timeframe, where it has reached support at $10.714. Concurrently, it's consolidating around this support level while the RSI indicator shows positive divergence, indicating potential bullish momentum. Moreover, the decreasing volume in red candles suggests bullish volume divergence.
📈For long positions, the activation of RSI divergence with a breakout above $42.49 confirms the signal. The next resistance lies at the RSI midline, or $11.125, where a candle close above this level could signal entry for long positions.
✅Setting our initial target with a risk/reward ratio of 2, we aim for a price target of $12.745. If the price reaches this level, profit-taking could be considered.
📉Considering short positions, it's essential to note that strong trends often accompany significant divergence. However, without substantial selling volume, it's challenging to confirm stronger selling pressure. Confirmation would entail multiple red candles with high volume.
🛑For short position targets, the initial risk/reward ratio of 2 could be applied, followed by considering support at $9.734.
📝Overall, Cosmos presents a potential long opportunity, supported by technical indicators and price action around key support levels. Short positions should be approached cautiously, awaiting confirmation of increased selling pressure.
🧠💼It's important to acknowledge the inherent risks in futures trading, with the potential for margin calls if risk management is neglected. Always adhere to strict capital management principles and utilize stop-loss orders, ensuring that the initial target offers a risk-to-reward ratio of 2

ATOM's Silent UptrendATOM is a nice buy, touching its long term trendline, and doesn't react too negatively to market mishaps. We've already broken the long term resistance trendline so, the top of the trendline should be a place to look forward to.

#ATOMUSDT SHORT ⬇️SHORT #ATOMUSDT from $10.642
2h TF. The coin formed a bearish triangle formation with the highs being squeezed along the trend line to the support level, showing the strength of sellers. Since the level has been tested several times, I expect to see unrealized liquidity behind it, which will allow the downward trend to continue for a short time.
I am waiting for the formation of consolidation near the level and an impulse movement on the activity.


Cosmos(ATOM): Breaking 100EMA And Securing it Right NowCosmos is still near 100EMA and not showing any remorse towards buyers.
As we slowly break and secure this zone, we see a good chance for further moves to the lower zone here!
Swallow Team
atomusdtThe price is hitting the trend line that was broken earlier
We have to see if the price can go back up!! I think it should take an upward path
I am waiting for the return of the price

ATOM long ATOM is bouncing off the support level and the ascending trendline. Bullish movement to resistance level at $14.3 is expected to happen next
