GBPAUD The upward trend is quite clear, when dealing with the specified range, you can take a buying position
AUXGBP trade ideas

GBPAUD Technical Analysis and Trade IdeaOn the higher time frame, the GBPAUD currency pair demonstrates a bullish trend, characterized by recent retracement movements that have brought it into an equilibrium zone.
Bullish Trend: The GBPAUD has been exhibiting a bullish bias, indicating strength in the British pound relative to the Australian dollar. This trend is evident over an extended period, suggesting potential further upside.
Retracement: Recent price action shows a retracement into an equilibrium zone, where a potential buy opportunity could present itself at around the 61.8% fibo level.
Disclaimer
This analysis provides a technical perspective on the GBPAUD currency pair. However, it is essential to emphasize that this information should not be construed as investment advice. Each trader’s risk tolerance, financial goals, and individual circumstances vary. Make informed decisions based on thorough research and a comprehensive assessment of all relevant factors.

GBPAUD I High probability short from resistanceWelcome back! Let me know your thoughts in the comments!
** GBPAUD Analysis - Listen to video!
We recommend that you keep this pair on your watchlist and enter when the entry criteria of your strategy is met.
Please support this idea with a LIKE and COMMENT if you find it useful and Click "Follow" on our profile if you'd like these trade ideas delivered straight to your email in the future.
Thanks for your continued support!

gbpaud. Don't forget about stop-loss.
Write in the comments all your questions and instruments analysis of which you want to see.
Friends, push the like button, write a comment, and share with your mates - that would be the best THANK YOU.
P.S. I personally will open entry if the price will show it according to my strategy.
Always make your analysis before a trade

GBPAUD#GBPAUD - H1
Upon analyzing the 1-hour timeframe, with the breach of the resistance level around 1.9395, there is an expectation for price growth towards the 1.9470 range.
⛔ Stop Loss: 1.9340
On the other hand, breaking the 1.9340 range could lead to a price decline towards the 1.9270 range.
⛔ Stop Loss: 1.9395

GBPAUD POSSIBLE SELL FROM CMPPrice is currently trading at 1.94657. There’s could be a possible sell opportunity at that zone back to 1.93963
Apply good money management

GBPAUDGBPAUD has been selling for a while and we are now waiting for the rest to the upside into our extreme inverse fvg on the 4hr timeframe

GBP/AUD Short Opportunity - 9th February 2024Price created LLs and LHs - price broke support, ended up re-testing broken support level turned resistance + EMA confirmation + HTF EMA confirmation + P.A

GBPAUD..SHORTOANDA:GBPAUD short position can be taken in the specified area
There is no position before the area

local long on GBPAUDThe upper boundary of the range acted as a kind of resistance to further growth, but this morning has potentially turned the situation around. the price has washed out the boundary of the range, we can aim for an update of the highs

GBP/AUD Long 1:3 RR15m broken structure/retested
london session market structure
1 to 3 risk to reward setup

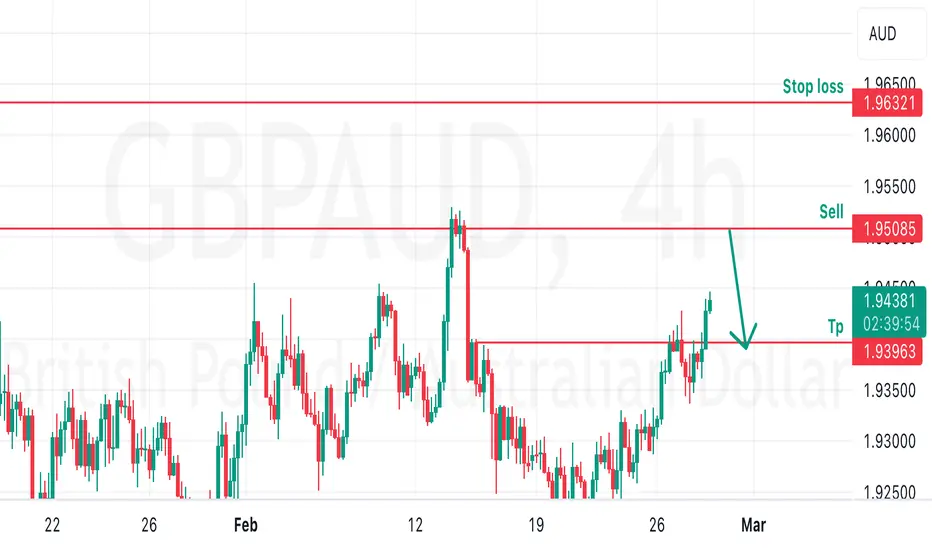
GBPAUD POSSIBLE SELL OPPORTUNITY H4 TIMEFRAME A simple setup for today . Price is currently trading at 1.94369 (previous day high ). A growth to 1.95085 insight a potential sell opportunity.
Target - 1.93963 (overlap support )
SL -1.96321 (pullback resistance )
GBPAUD Short.GBPAUD has made a bearish divergence on every time frame from 5 minutes to 1 hour. MACD and MFI are also indicating that bears will take control for a short while, what do you think?
Entry at 1.94291 at CMP
SL at 1.94225 and
TP at 1.94107.

GBPAUD: Bullish Continuation 🇬🇧🇦🇺
GBPAUD violated a solid horizontal supply zone.
After its retest, the price formed a cup & handle formation on an hourly time frame.
Bullish violation of its neckline confirms the significance of the broken structure.
We can anticipate a growth on the pair at least to 1.9464
❤️Please, support my work with like, thank you!❤️

GBPAUD in this case, i see "wedge pattern"
so.. maybe the big move is going down.
what do you see guys?
disclaimer
i just share what i see what i know
thanksyou

GBP/AUD SHORT IDEA 1:4 RRBroken structure being retested.
broken trend lines
supply area
4h support needs to get tapped at our TP area.
great risk to reward setup.

GBPAUD Short SetupWe are planning to enter a short position after the price breaks the current structure and moves downwards. We expect that the price will then move up to fill the imbalance. We will enter the short position when the price reaches premium levels, using the Fibonacci levels.

GBPAUD BUY BIASWeekly: Bearish, Rejection from major weekly resistance 198.550, Failed retest of Head and shoulders pattern price closed above the right shoulder, recently mitigated ob 1.98550, Made a Double bottom pattern at daily supply zone 1.86550, Unmitigated ob at 1.87625, Bearish rejection candle at daily resistance 1.94750, Bullish choch
Daily: Consolidation, Inverse Head and shoulders, 2 bar rejection at major resistance 1.94750, Has not retested major support 190.325 after break, Bullish choch, Double bottom pattern, Retested resistance 1.93250
4hr: Consolidation, In a minor uptrend after making a rejection can of the bottom 4hr zone, Break of bearish trendline to the upside, Has not retested .618 of fakeout that resulted to a downward movement, rejection of the 4hr resistance 1.93275.
1hr: Bullish, Liquidity is located above the 4hr resistance of 1.93275, Price is respecting a bullish trendline, Unmitigated 1hr ob, Price faded out and reversed after reaching bottom 4hr zone.
15m: Bullish, Bullish structure is being formed, Failed to make a higherhigh at 4hr resistance 1.93275, Ascending triangle pattern
I believe price is going to retest the 1hr ob fake out the market and continue the upward movement towards the Top 4hr zone to grab liquidity and retest the .618 level if its able to break 1.93275.

GBP/AUD MARKET ANALYSIS
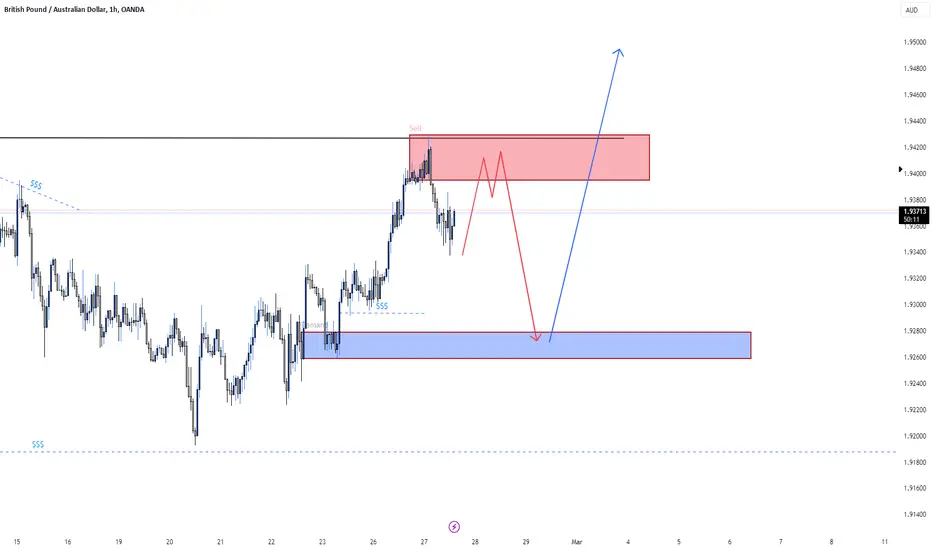
In the weekly market, there's an upward trend, and I've identified corresponding levels. Transitioning to the daily chart for further analysis, it seems the market might undergo a downward movement, potentially reaching the levels highlighted in the video, before resuming its upward trajectory. i have analyze four hours as well to see bigger picture.

GBPAUD looking for the sell to the swing buy I have been waiting for this pair to show me some more buying action and it has, looking so scalp the sell area to the swing buy area
GBPAUD The Target Is DOWN! SELL!
My dear followers,
This is my opinion on the GBPAUD next move:
The asset is approaching an important pivot point 1.9390
Bias - Bearish
Safe Stop Loss - 1.9421
Technical Indicators: Supper Trend generates a clear short signal while Pivot Point HL is currently determining the overall Bearish trend of the market.
Goal - 1.9327
About Used Indicators:
For more efficient signals, super-trend is used in combination with other indicators like Pivot Points.
———————————
WISH YOU ALL LUCK

GBP/AUDWe will have two scenarios for this chart. The first scenario is the possibility of a price decrease up to the 50% Fibonacci range in the price area of 1.9300-1.9310 and the reaction of the price. The second scenario, which seems more certain, is the price reduction to the support range specified in the chart between the price of 1.9220 and 1.9190. We should keep an eye on it, and if there is a suitable candlestick pattern such as a bullish pin bar or golf, we can look for the opportunity to buy. to be

GBP/AUDWe will have two scenarios for this chart. The first scenario is the possibility of a price decrease up to the 50% Fibonacci range in the price area of 1.9300-1.9310 and the reaction of the price. The second scenario, which seems more certain, is the price reduction to the support range specified in the chart between the price of 1.9220 and 1.9190. We should keep an eye on it, and if there is a suitable CANDLESTICK PATTERN such as a bullish pin bar or golf, we can look for the opportunity to buy. to be
