Set Up Long AXSUSDT/BinanceLong at Bullish OB at equilibrium 0.5 fibonacci.Stop loss and Take profit like my set up.
AXSUSD trade ideas


AXS cup & handle targets to 82 for first TPAXS cup & handle targets to 82 for first TP AXS cup & handle targets to 82 for first TP AXS cup & handle targets to 82 for first TP
@micdot7

AXSUSD (4H) Bullish reversalHi Traders
AXSUSD (4H Timeframe)
Waiting for the upward break of 62.10 resistance level, which will complete a bullish trend reversal pattern to go LONG. Only the downward break of 55.10 would cancel the bullish scenario.
Trade details
Entry: 62.10
Stop loss: 55.10
Take profit 1: 65.80
Take profit 2: 72.40
Score: 6
Strategy: Bullish reversal

AXS - LongAXS is ready to make the next move.....
30days forecast = TP1
Like this idea ?... Please do a thumbs up
Thanks for watching.

AXS Short / SXP Long ?I'm looking for Pairs to trade against each other to offset the risk of a single trade.
With a "± simple" calculation of each possible outcome of A UP / A Flat / A down - B UP / B Flat / B down i look wich move in A/B is the most likeliest.
AXS / SXP UP 1 6%
AXS / SXP Down 4 34%
SXP / AXS UP 4 17%
SXP / AXS Down 2 33%

Good opportunity for long trade in Axie infinity As one can see in the chart Axie infinty chart after a good consolidation at the support level it gave a breakout of the trendline this could be possible trend reversal. Entry neat 56-58 sl below the consolidation at 43 target near 77-78.

Do not Buy the Dip on AXS yet !!No Investment Advice.
AXS looked amazing when it was making its minor degree impulse. Wave 3 was massive in relation to wave 1. Wave 3 finished very close to fibb level shown in purple. And a usual wave 4 Triangle structure. Wave 5 spot on fibb level. Usually wave 5 is .618 of wave 1+3 but in this case it finished 1 level lower suggesting upcoming weakness in the trend.
Now it has been selling off with the market. But the most worrying thing is that it has managed to make a lower low invalidating possibility of wave 3.
If you are holding bags i wish you good luck with that. If i were you i will do a solid fundamental analysis. And if i come to a conclusion that this project has future i will DCA. My next entry will be 20.50 and next level 5. Based on fibb level as shown below-

Axie infinityI don't want to sound negative, but what's the idea behind axie? How sustainable is it. Well from the charts price is going down. ( Obviously this correction or should I say change in major trend is soo... Cold. Brace yourself for next level around $36 area. Or could there be a turn around zone? Not anytime soon I guess 🙂
Axie InfinityAxie Infinity (AXS/USD) is on the verge of a bullish cross SMA55/SMA233 on the 1hr chart. It looks like it's trying to consolidate it's lower price action since the crypto market shake out a week ago. Unless you've already been holding for +365 days, imo now is a good time to start being a "Hodler" in the crypto market as a whole & add on potential dips. Here's levels on the 1 hour chart, 1 week view:
7 day high = $55.47
7 day low = $44.61
52 week high = $165.37
52 week low = $0.76
SMA233 = $53.94
SMA144 = $49.33
SMA89 = $48.75
SMA55 = $47.37
breakout = $53.96
R3 = $52.51
R2 = $51.07
R1 = $49.62
pivot = $48.18
S1 = $46.73
S2 = $45.28
S3 = $43.84
breakdown = $42.40
Do your own due diligence, your risk is 100% your responsibility. This is for educational and entertainment purposes only. You win some or you learn some. Consider being charitable with some of your profit to help humankind. Good luck and happy trading friends...
*3x lucky 7s of trading*
7pt Trading compass:
Price action, entry/exit
Volume average/direction
Trend, patterns, momentum
Newsworthy current events
Revenue
Earnings
Balance sheet
7 Common mistakes:
+5% portfolio trades, capital risk management
Beware of analyst's motives
Emotions & Opinions
FOMO : bad timing, the market is ruthless, be shrewd
Lack of planning & discipline
Forgetting restraint
Obdurate repetitive errors, no adaptation
7 Important tools:
Trading View app!, Brokerage UI
Accurate indicators & settings
Wide screen monitor/s
Trading log (pencil & graph paper)
Big, organized desk
Reading books, playing chess
Sorted watch-list
Checkout my indicators:
Fibonacci VIP - volume
Fibonacci MA7 - price
pi RSI - trend momentum
TTC - trend channel
AlertiT - notification
tickerTracker - MFI Oscillator
www.tradingview.com


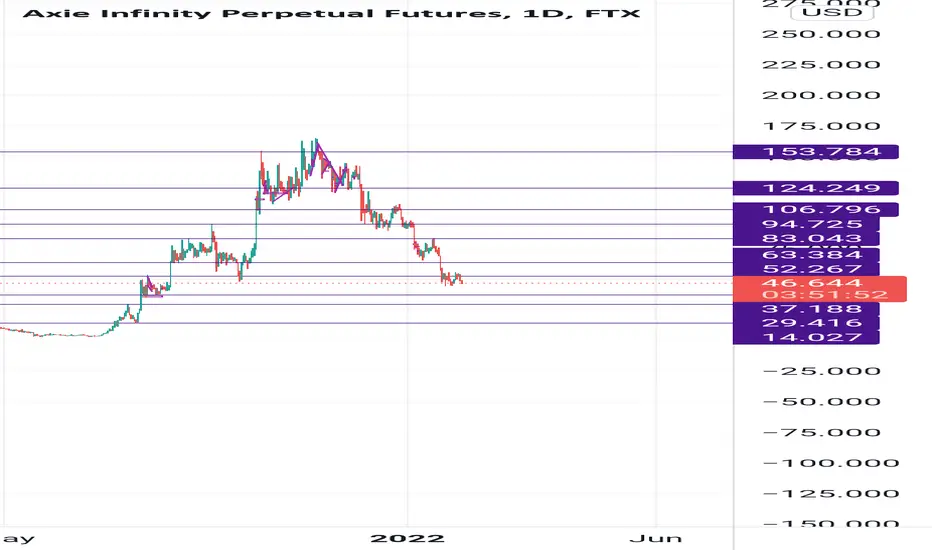
Should you buy Axie Infinity or wait?Hello All. Looking at AXSUSD on the daily timeframe, we see that the price of axie infinity is trading inside a descending wedge/falling channel. This is a bearish pattern and is currently testing the resistance of the channel at $46.
It is important for AXSUSD to find support at this level or it can fall to the next support level which is at $37.
On the daily chart we are also forming a death cross, (50 Ema crossing below 200 Ema) which can push AXSUSD price as low as $20-$14. This is a 70% price drop.
Top of the channel line sits around $70, and if the price reaches this level, this will be a 50% profit from the current price.
This is possible with enough value coming in and since the stochastic rsi is in the oversold territory.
Although, it is less likely that AXSUSD will have a crash to $20-$14, everything is possible if BTCUSD and ETHUSD continue to drop further. (Check out my recent BTCUSD and ETHUSD chart for more information and levels of resistances to keep an eye for).
Thanks for reading, and stay tuned. Enjoy.

A Look at the Bigger Picture, has to go down before it goes upHello guys,
Today I am sharing a look at AXS on the weekly. A lot of folks have been paying attention to their favorite coins on lower time frames, failing to recognize that there is a pretty clear and definitive thing happening in the bigger picture.
As you can see on the price chart, I have 3 different trend channels stacked ontop of one another. Using this technique allows you to forecast resistance areas in the case a coin is reaching all time highs, or can also be used when coins are trading at their lowest prices.
So far, price has responded very well to these channels, and uses them as rigid support and resistance zones. Whenever price has tipped its way either above or below any of these lines with a candle close, it always goes to the next one at minimum.
Our last weekly candle closed below a channel, and now we are in the middle channel. With this, I am expecting price to trade lower, whether it is the next line, or a million lines lower (joking). What I am mainly looking for as a patient lion waiting to attack its prey, is, for price to be touching one of the trend lines, while the RSI is simultaneously touching one of its support lines.
With these two requisites paired together, I am pretty confident in being able to pinpoint our bottom for a huge buying spree before we haul on upwards. Of course, when these two requisites happen, it will be time to look for horizontal resistances as well as some looking on lower time frames to be able to make for a tighter stop loss.
My goal is to:
1. Wait patiently until I think it has bottomed by looking on this weekly chart, needing both Price AND the RSI to be on their trend channel support.
2. Look at horizontal resistances and pay attention to lower time frames.
3. Pull the buy trigger when I am able to make a setup that allows for a tight stop loss.
4. Watch this same weekly chart and plan to sell when Price AND RSI are both at their respective trend channel resistance lines. (NOTE: more trend channels may have to be stacked to this chart, but maybe not)
5. Celebrate!
I hope you guys found something useful from my post. Have a great night everyone, and as always, be sure to do your own due dilligence.


AXSUSD (Daily) Bearish wave We2Hi Traders
AXSUSD (Daily Timeframe)
A Medium probability, entry signal to go SHORT will be given with the downward break of 70.50 after the market found resistance at 84.04. Only the upward break of 84.04 would cancel the bearish scenario.
Trade details
Entry: 70.50
Stop loss: 84.04
Take profit 1: 54.74
Take profit 2: 36.18
Score: 5
Strategy: Bearish wave We2

AXSUSD within its Buy Zone flashing the same signal as JuneAxie Infinity has been on a long-term Fibonacci Channel Up ever since its first trading day in November 2020. As you see, it has two clear pressure zones, a Buy Band (green) and a Sell Band (red). Those have never failed to give clear buy/ sell signals.
What has been an even stronger buy signal though than AXSUSD trading within its Buy Zone alone, is that when it also breaks below the 1D MA200 (orange trend-line), it tends to bottom out and start a strong rally to the top of the Channel Up. That's what took place in late June 2021. With the Ichimoku Cloud also flashing a buy signal, AXS is possible to soon start a strong rally first towards $220.00 and then $500.00.
--------------------------------------------------------------------------------------------------------
** Please support this idea with your likes and comments, it is the best way to keep it relevant and support me. **
--------------------------------------------------------------------------------------------------------

AXS/PERP 12H TA decending channelAXS/PERP has been in this decending channelfor a while. we just arrived at a important accumulation zone.
a good moment to buy some AXS here imo.


AXIS ShortShorting AXIS here based on my engulfing candle strategy.
Stop is protective will update actions when taken.
EDIT - Price moved pretty quick got filled @ 71.519

$AXS - Still some more correction to goAfter peaking at 171.85, we are correcting the whole uptrend of $AXS since its creation.
I expect some more downside for the short term, taking us to the 50% - 61% pullback ($65 to $86).
The downtrend channel is well defined, and only a break of the channel would make me consider the correction is over.

AXS to infinityAnd beyond.
Solid fundamentals + tokenomics + technicals - AXS is one of the best swing trades in town rn.

Rally starting from here....Expecting a new bull rally on AXS. Price bounced off the 0.618 fibonacci

AXS bullishWell reset - rather pretty oversold technicals.
Raging fundamentals.
Huge user base & growing.
112% staking APR
Axie looks like a catch around these levels.
