KADA/USDT is a big opprtunité to buy ??buy KDA/USDT on daily fraim
entry price 0.53$
sl 33.75$
target 1 83.6 $
target 2 157.39 $
target 3 483.57 $
AXSUST trade ideas

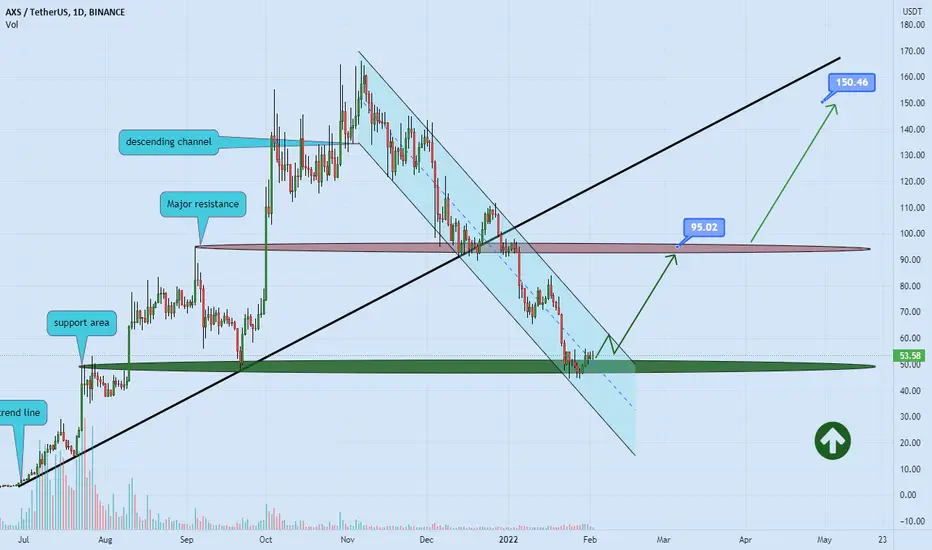
AXIE INFINITY time to gain 🚀Based on the chart, price stick in descending channel ✔️
but now
become close to channel support and support area ✔️
so
we expect gain for the price at least to channel resistance and if the price breaks the channel resistance we can see more gain and our first target is $95 🚀
if
the price breaks the $95 and round number of $100 and stays above these levels we can expect more gain and our next target is $150 🚀🚀
This is not financial advice, always do your own research.
Please, feel free to ask your question, write it in the comments below, and I will answer.
🐋
AXS have accumulation before rise for 50-70% to Resistance ZoneHello dear traders, we here new so we ask you to support our ideas with your LIKE and COMMENT, also be free to ask any question in comments, we will try to answer for all, thank you guys.
Today I will publish signals from our trading team for AXS .
AXS fall from ATH for 73% almost without any pullbacks upward.
Now price trades very close to support level 48 USD (trades above level).
And have an accumulation before rise movement.
AXS can rise for 50-70% from current price 53 USD with targets in area 80-90 USD.
We expect this scenario, so be prepare for next movements.
Thanks for your time, we hope our work is good for you, and you are satisfied, wish you a good day and big profits.


$AXS buy attempt here$Axs had one of the best D1 volumes in the market yesterday (30-01-2022).
If you look at the wicks below you'd notice good price rejection. I am taking a bite here with invalidation below the lowest wick.

Ideal ending diagonal long $AXSEntry triggers:
1) bearish divergence (RSI HL and LL on the chart)
2) ending diagonals
3) 5 waves in
4) bounce at support
5) break of the horizontal resistance(trend line connecting 2 and 4)
6) retest
7) increase in volume
RR:3.29
Initial sl (initial protective stop set under slightly under wave 5, after the trade starts moving in our direction move it up)
tp: golden pocket on fib retracement


AXSUSDTDue to the valid defeat of the uptrend trend line, I opened the short position and put the target to the previous support floor.

AXSThe currency is approaching a strong support level and there is a possibility that the correction in this range will be completed.
It is better to keep in mind that we may even see a fake break in this range, but overall, this range could be a turning point for the AXS price.
Break of the bearish channel and stabilization of the price above the Ret 61.8 resistance can be a good indicator for change in trend.

AXS bounce of Support on Down ChannelAXS trading on down channel, however bounced on $50 Support, Oversold RSI also bounced on 50 support. Possible Bullish MACD crossover and rising Historgram

AXS bounce of Support on Down ChannelAXS has strong support at $50. Currently trading on down channel. Oversold RSI bounce at support, MACD Bullish crossover emerging, Histogram bars rising.


#AXSUSDTAXSUSDT (D Chart)Technical analysis
AXSUSDT(D Chart)Currently trading at55.93$
Buy level: Above 50$
Stop loss: Below49$
TP1: 65.90$
TP2:79$
Always keep Stop loss.

AXS responding to 45$Got the move down I was looking for, and now it reacted to 45$ a couple times here with some interesting Elliott Wave patterns at the end there. BUT I am waiting for a break of the range here with at retest, throw back here.

AXS READY FOR 40% TO 80% MOVEI hope some Meta action might be starting soon.
All potential target on the chart.

AXS MIDTERM LONG SENARIOHi Everyone . Today I'm Checking the Axie infinity Chart and im so supprised beccause now supporting in the Green Zone , So if you check the Previous move you see if the Trendline Break We Are going to the moon and expect to see 80$ for mid term , but if lost the Support we are going down , btw you should do it with your own risk and money management , ITS NOT FINANCIAL ADVICE !

shorted axs ricky i am shorting axs it's ricky a bit cuze i am shorting at supp line but i am ecpcting a break for this support

AXS Slide to 42USD up to 20USDMulti Timeframe Analysis
Hint: BTC's downward spiral could throw AXS under the bus.
BTC maintains crypto dominance and with its drop, could take Axie Infinity further with it. There are two levels of strong support where we see a confluence of both Volume Profile and a Horizonal line part of a converging triangle pattern.
The Volume Profile (a zone where many buyers last stepped in) stands strong first at the 42 USD range. Shoud this break , AXS will drop to 20 USD, a last portal of previous buyer activity.
Should AXIE go as far as 20 USD, I will consider buying for a long bullish uptrend should the rules below concur.
Market order position upon the confluence of valid entry rules on the 4H or 1H chart.
-=ENTRY RULES=-
Trading philosophy: Don’t short at the lowest of the bearish momentum nor do we long at the peak of a bullish impulse. The safest entries are at the end of a retrace on the 38.2%, 50%, 61.8% or 78.6% fibonacci back in the direction of the master trend.
Note: I use Daily/4H or 4h/1H market structures with wave analysis to prep for potential entries. The RSI , MACD and EMA indictors are confirmation for entries at the 4H or 1H timeframe
For SHORT:
4H chart should confirm that the bullish retrace had turned bearish in the direction of master trend. The MACD should have dropped below zero signifying a bearish environment. Price would have dropped below the 10 and 20 EMA . For good measure, check that the 4h and D1 RSI is below the 50 signal line
For LONG:
4H chart should confirm that the bearish retrace had turned bullish in the direction of the master trend. The MACD should have gone above zero signifying a bullish environment. Price had gone above the 10 and 20 EMA . For good measure, check that the 4h and D1 RSI is above the 50 signal line
About me
I am not a financial advisor nor a signal provider. These are the opinions of a 20-year private trader in the legal profession as well as a businessman diversified in the tech and hospitality industries. My favored tools of the trade include wave analysis, price action on the 4H to Weekly timeframes and institutional order flow.


AXSUSDT - SETUPAXSUSDT price dropped 70% from its high, moved into a descending parallel channel, and now reached at a strong support zone. This area needs to be honored by bulls. They need to react if they want to reclaim their position back, if they succeed then we can see a good rally towards 60.00


AXS - Axie Infinity is Approaching its Buying ZoneThe Back Ground and Psychological Support Zone
The AXS last bull move gave us hefty returns of 6200%, which started from 2.64$ on Jun 29, 2021, and made an ATH of 167 on Nov 6, 2021. However, this massive gain leads to a correction that later converts to deeper correction and ends in the shape of a crash, and currently, it trades below $50. It shed almost 73% of its gain and trading in a well-established downtrend/descending channel; it got rejected three times from the upper side while trading within this channel. The fibo levels from last bull runs are playing their part. We see 0.50 and 0.786 levels act as barriers but did not last as final lines. Now price is entering into a strong support zone that has its back from the July, Aug 21 trading range when the price remains range-bound after a massive first move. At the same time, RSI has been in the downtrend since the start of Oct 21, capped by a trend line, currently in oversold territory.
Point:
Bullish divergence is in play that will trigger the next bull run.
It entered into a strong support zone.
In the last down move, volume remains below average.
Trading activity/volume increased in the last 4 days.
Fibo retracement 0.786 and support zone lower levels are the same, providing a solid support level that will hold.
It already shed 73% of its all times grains.
RSI is in the oversold zone and showing weak bearish signal
Pay Attention
Observe its price action in the support zone (a rejection from downside with good volume and confirmation on next day), wait for the positive signals from all sides like RSI needs to recover to let the bullish divergence play its part. Moreover, RSI needs to break the trend line, which has been holding in a downtrend since Oct 21. A rejection from downside and RSI trend line break are two key signals you need to get in
Risk / Reward and Holding Period
Buying near the $40 level can be a good idea (or within the support zone). Keep in mind any move below 37 will be short-lived, so if you got an opportunity between 30 to 31 levels, that would be a great level to enter. But chances are rare. The TP1 is 90$, TP2 is its ATH, and the 2022 target is 350$. The minimum holding time for this trade is two quarters.
It is not financial advice; always do your research.
Please, feel free to ask your question; write it in the comments below, and I will answer.

Small Scalp on AXSI'm expecting a head and shoulders on AXS, but that will depend on BTC holding steady trading in it's current range.
