BANDUSDT IDEAHey traders hope you are enjoying our analysis. Now we are here again with a new trading opportunity. We will discuss today about BAND
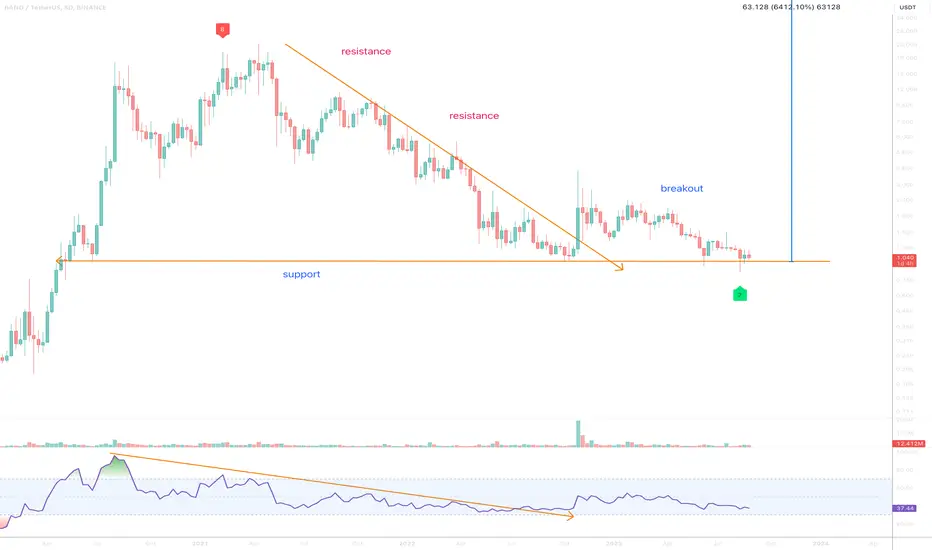
Falling wedge Breakout Done in 6 H Timeframe ✅
Retesting in process✍️
Expecting +20% Bullish wave in coming day's 🚀📈

#BAND\USDT#BAND
'The price is moving in a downward trend on a 1-hour frame.
The price is moving within it and adhering to it to a large extent,
and it has just been breached. We have a tendency to stabilize above Moving Average 100.
We have a downtrend on the RSI indicator that supports the rise and has be

BANDUSDT LONG PhemexBAND The Forgotten 200% From 2022. I Charted this one time and it Ran from $0.10 to $18. this is the second time im charting this Currency. 2.222 is resistance IMO it smashes it.UP 4 Targets.

BANDUSDT 6H#BAND is moving above the support. If it keeps the support, it can reclaim the trend line. In this case, targets are:
$1.624
$1.859
$2.048
Main support: $1.382

BANDUSDT BOMB soonBANDUSDT BOMB soon 1h
BANDUSDT BOMB soon 1h
BANDUSDT BOMB soon 1h
BANDUSDT BOMB soon 1h
BANDUSDT BOMB soon 1h

BANDUSDT ready for a strong moveThis crypto has been bullish on the higher timeframe but recently we saw it retrace. However, on the 1H timeframe, a breakout of the triangle has occured and if price manages to keep doing higher highs and higher lows then my targets will be 2.25 and 2.50.

BANDUSDT - Triangle Breakout and Heading towards next ResistanceBINANCE:BANDUSDT (4H CHART) Technical Analysis Update
BANDUSDT is currently trading at 1.80 $ and and successfully breakout from the triangle pattern, its heading towards the next resistance around 2.0
We can expect the trend to continue and out final target is around 2.3
Long Entry level: $ 1.8

BAND will pump soonBefore anything else, you should note that the time frame is large and time-consuming (it is 2D).
BAND seems to be consolidating a triangle pattern, we are now in wave D of this triangle.
Wave D is a diamond diametric, which now seems to be in the bullish wave E of this diametric.
The target indi

Band Protocol (BAND) - Bullish divergence** Trading opportunity **
On the above 8-day chart price action has corrected 95% since April 2021. A number of reasons now exist to be long, including:
1) Price action and RSI resistance breakouts.
2) Regular bullish divergence. Seven Oscillators print positive divergence with price action over

See all ideas