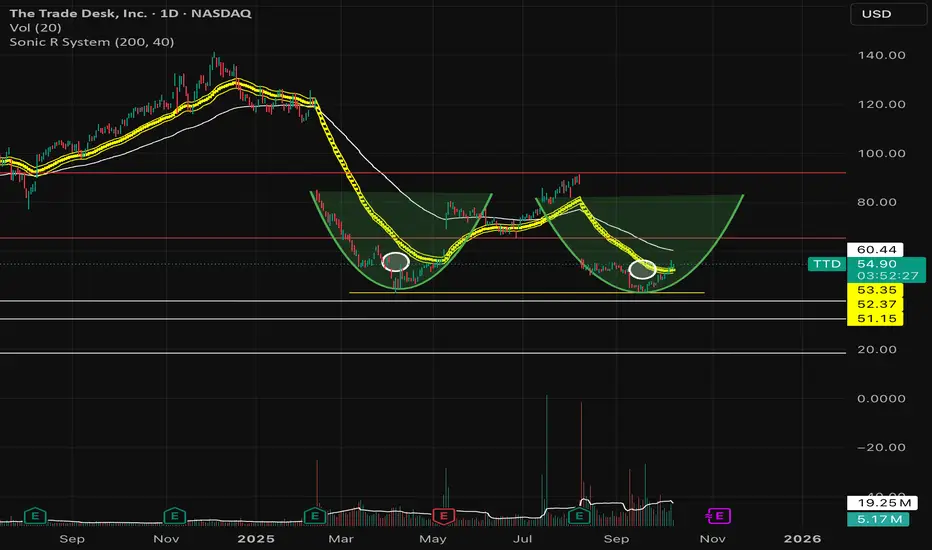
Bouncy Double DDs Pattern, $85 re-test?- NASDAQ:TTD is probably repeating the move it had earlier in the year.
- It's most likely going to re-test 85s , could happen as early as post earnings.
- Position size accordingly, not sure completely if it will play out as I am thinking but seems pretty likely.
- Let's go!
Next report date
—
Report period
—
EPS estimate
—
Revenue estimate
—
0.85 USD
393.08 M USD
2.44 B USD
442.95 M
About The Trade Desk, Inc.
Sector
Industry
CEO
Jeffrey Terry Green
Website
Headquarters
Ventura
Founded
2009
ISIN
US88339J1051
FIGI
BBG00629NGT2
The Trade Desk, Inc. engages in the provision of a self-service and cloud-based ad-buying platform. It operates through the United States and International geographical segments. The firm offers omnichannel advertising, audience targeting, solutions for identity, application programming interface (API), custom, and programmatic, measurement and optimization. The company was founded by Jeffrey Terry Green and David Pickles in November 2009 and is headquartered in Ventura, CA.
Related stocks
TTD (swingtrade) Earning plays, waiting for pullbacki have 2 option to entry TTD.
this set up to get entry when ttd earning.
TTD: AdTech Giant Amid #Altseason Buzz? $72 in Sight?TTD: Undervalued AdTech Giant Amid #Altseason Buzz? $72 in Sight? Price at $49.64 (+4.33%), tied to Q2 earnings beat and crypto ad surge on X/Reddit, undervalued with 53% upside to targets, questioning if data growth sparks rally.
Fundamental Analysis
EPS $0.83 TTM, revenue growth 23.18% TTM,

TTD | Reversal Setup in PlayTTD – Reversal Setup in Play
Seeing a triple bottom pattern forming on the charts, with strong divergence on the daily/weekly and price sitting in oversold territory. Technically this looks like a solid reversal zone.
Fundamentals also line up:
Digital ad spend & programmatic growth remain stro

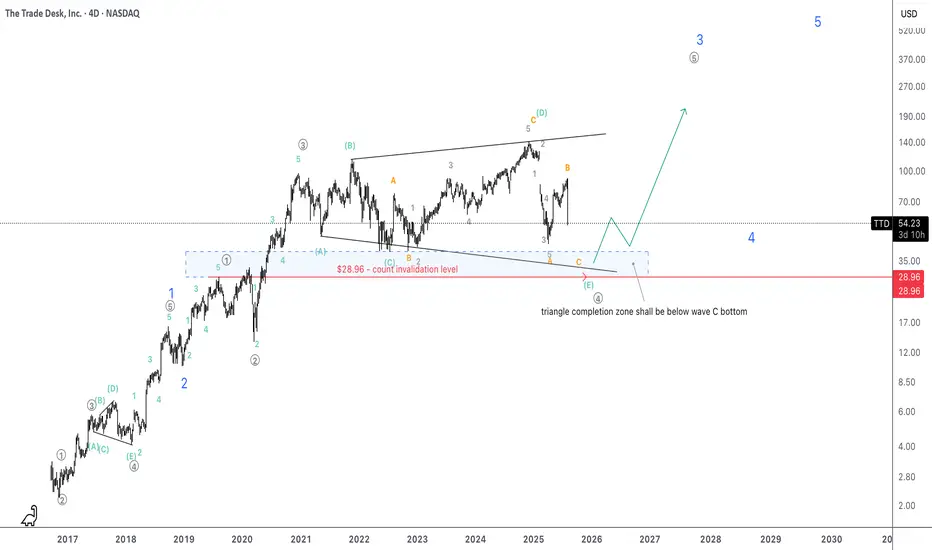
TTD poised to take off as expanding triangle completesIt is magnificent how the current triangle proves EW fractal aspect since there was an expanding triangle at the same wave degree within blue wave 1.
I'd put SL at around $29 where grey 4 (with the current triangles wave E) would overlap grey wave 1.
Magnitude of the unfolding grey wave 5 might be
bullish on $ttd, potential bottom inbullish on NASDAQ:TTD , potential bottom in
- price fall down to 2020 level, 5 year of chips wiped out
- in key multi-year support zone
- weekly volume surging
- RSI/MACD bullish divergence

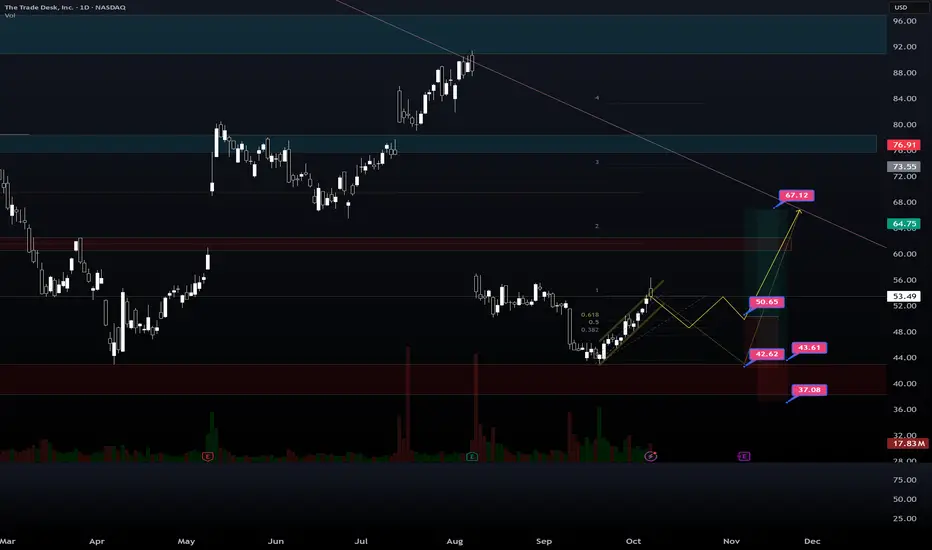
Trading $TTD to the trendline with 50c exp 11.21Support and Resistance Zones
Next Week (Short-Term)
Immediate Support : The most critical support zone is between $43.10 and $46.20. This is the low from March/April and the current price level. Holding this area is paramount for any bullish case.
Immediate Resistance : The first level of res

TTD crashIn the long term, this stock is in a side cycle and after seeing the top, it starts moving towards the bottom and goes through the natural market cycle, but very fast and intense.
The first support area for this stock is $48-50 and if it encounters strong buyers, it will move towards $69 and after

TTDGap range between $56.95 and 87.39. mid target around 0.5 fib level. High target at gap close. RSI at 33.57 marking an under valued stock price. Entry at 46.08 rebound.

A TTD Trade for the Long-Term BullCore Thesis: The Open Internet's Champion
The bull case for The Trade Desk is centered on its position as the leading independent demand-side platform (DSP) in a digital advertising landscape that is rapidly consolidating into "walled gardens" controlled by tech giants like Google, Meta, and Amazon.

See all ideas
Summarizing what the indicators are suggesting.
Neutral
SellBuy
Strong sellStrong buy
Strong sellSellNeutralBuyStrong buy
Neutral
SellBuy
Strong sellStrong buy
Strong sellSellNeutralBuyStrong buy
Neutral
SellBuy
Strong sellStrong buy
Strong sellSellNeutralBuyStrong buy
An aggregate view of professional's ratings.
Neutral
SellBuy
Strong sellStrong buy
Strong sellSellNeutralBuyStrong buy
Neutral
SellBuy
Strong sellStrong buy
Strong sellSellNeutralBuyStrong buy
Neutral
SellBuy
Strong sellStrong buy
Strong sellSellNeutralBuyStrong buy
Displays a symbol's price movements over previous years to identify recurring trends.
Curated watchlists where TTD is featured.

Software stocks: US companies at our finger tips
49 No. of Symbols
See all sparks
Frequently Asked Questions
The current price of TTD is 51.28 USD — it has decreased by −2.07% in the past 24 hours. Watch The Trade Desk, Inc. stock price performance more closely on the chart.
Depending on the exchange, the stock ticker may vary. For instance, on NASDAQ exchange The Trade Desk, Inc. stocks are traded under the ticker TTD.
TTD stock has fallen by −2.13% compared to the previous week, the month change is a 12.94% rise, over the last year The Trade Desk, Inc. has showed a −55.53% decrease.
We've gathered analysts' opinions on The Trade Desk, Inc. future price: according to them, TTD price has a max estimate of 135.00 USD and a min estimate of 34.00 USD. Watch TTD chart and read a more detailed The Trade Desk, Inc. stock forecast: see what analysts think of The Trade Desk, Inc. and suggest that you do with its stocks.
TTD stock is 4.85% volatile and has beta coefficient of 1.05. Track The Trade Desk, Inc. stock price on the chart and check out the list of the most volatile stocks — is The Trade Desk, Inc. there?
Today The Trade Desk, Inc. has the market capitalization of 25.60 B, it has increased by 8.43% over the last week.
Yes, you can track The Trade Desk, Inc. financials in yearly and quarterly reports right on TradingView.
The Trade Desk, Inc. is going to release the next earnings report on Nov 6, 2025. Keep track of upcoming events with our Earnings Calendar.
TTD earnings for the last quarter are 0.18 USD per share, whereas the estimation was 0.18 USD resulting in a 1.34% surprise. The estimated earnings for the next quarter are 0.20 USD per share. See more details about The Trade Desk, Inc. earnings.
The Trade Desk, Inc. revenue for the last quarter amounts to 694.04 M USD, despite the estimated figure of 685.47 M USD. In the next quarter, revenue is expected to reach 719.56 M USD.
TTD net income for the last quarter is 90.13 M USD, while the quarter before that showed 50.68 M USD of net income which accounts for 77.85% change. Track more The Trade Desk, Inc. financial stats to get the full picture.
No, TTD doesn't pay any dividends to its shareholders. But don't worry, we've prepared a list of high-dividend stocks for you.
As of Oct 14, 2025, the company has 3.52 K employees. See our rating of the largest employees — is The Trade Desk, Inc. on this list?
EBITDA measures a company's operating performance, its growth signifies an improvement in the efficiency of a company. The Trade Desk, Inc. EBITDA is 570.57 M USD, and current EBITDA margin is 21.05%. See more stats in The Trade Desk, Inc. financial statements.
Like other stocks, TTD shares are traded on stock exchanges, e.g. Nasdaq, Nyse, Euronext, and the easiest way to buy them is through an online stock broker. To do this, you need to open an account and follow a broker's procedures, then start trading. You can trade The Trade Desk, Inc. stock right from TradingView charts — choose your broker and connect to your account.
Investing in stocks requires a comprehensive research: you should carefully study all the available data, e.g. company's financials, related news, and its technical analysis. So The Trade Desk, Inc. technincal analysis shows the sell today, and its 1 week rating is sell. Since market conditions are prone to changes, it's worth looking a bit further into the future — according to the 1 month rating The Trade Desk, Inc. stock shows the sell signal. See more of The Trade Desk, Inc. technicals for a more comprehensive analysis.
If you're still not sure, try looking for inspiration in our curated watchlists.
If you're still not sure, try looking for inspiration in our curated watchlists.