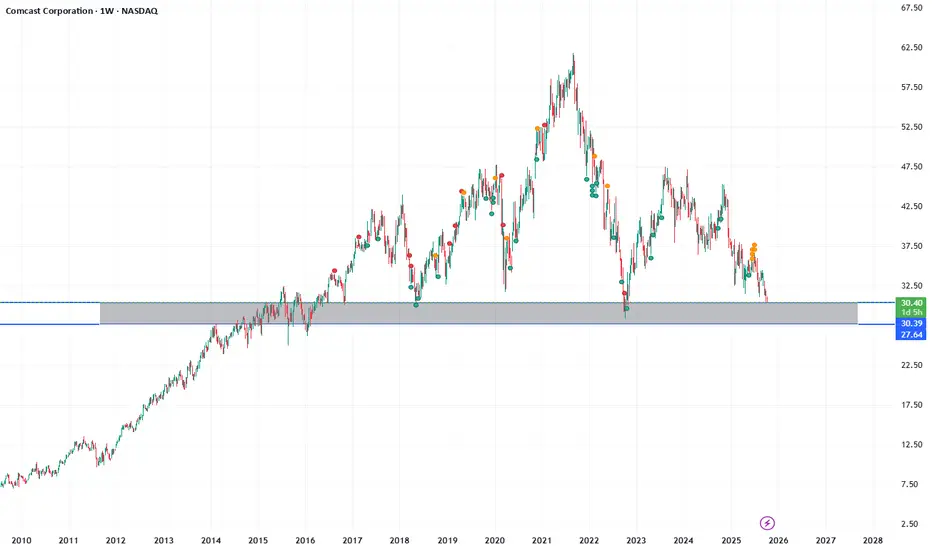
CMCSA multi year low and good supportI think with current valuation CMCSA looks very cheap and after founding solid support should show real performance
HOLD Long term
good dividend
i am not financial advisor
Key facts today
Next report date
—
Report period
—
EPS estimate
—
Revenue estimate
—
6.073 USD
16.19 B USD
123.73 B USD
3.66 B
About Comcast Corporation
Sector
Industry
CEO
Brian L. Roberts
Website
Headquarters
Philadelphia
Founded
1963
ISIN
US20030N1019
FIGI
BBG004BWK7Y3
Comcast Corp is a media, entertainment, and communications company, which engages in the provision of video, Internet, and phone services. It operates through the following segments: Cable Communications, Cable Networks, Broadcast Television, Filmed Entertainment, Theme Parks and Sky. The Cable Communications segment provides video, Internet, voice, and security and automation services under the Xfinity brand. The Cable Networks segment consists of national cable networks, regional sports, news networks, international cable networks, and cable television studio production operations. The Broadcast Television segment includes NBC and Telemundo broadcast networks. The Filmed Entertainment segment involves in the production, acquisition, marketing, and distribution of filmed entertainment. The Theme Parks segment consists of Universal theme parks in Orlando, Florida; Hollywood, California; and Osaka, Japan. The Sky segment consists of the operations of Sky, one of Europe's entertainment companies, which primarily includes a direct-to-consumer business, providing video, high-speed internet, voice and wireless phone services, and a content business, operating entertainment networks, the Sky News broadcast network and Sky Sports networks. The company was founded by Ralph J. Roberts in 1963 and is headquartered in Philadelphia, PA.
Related stocks
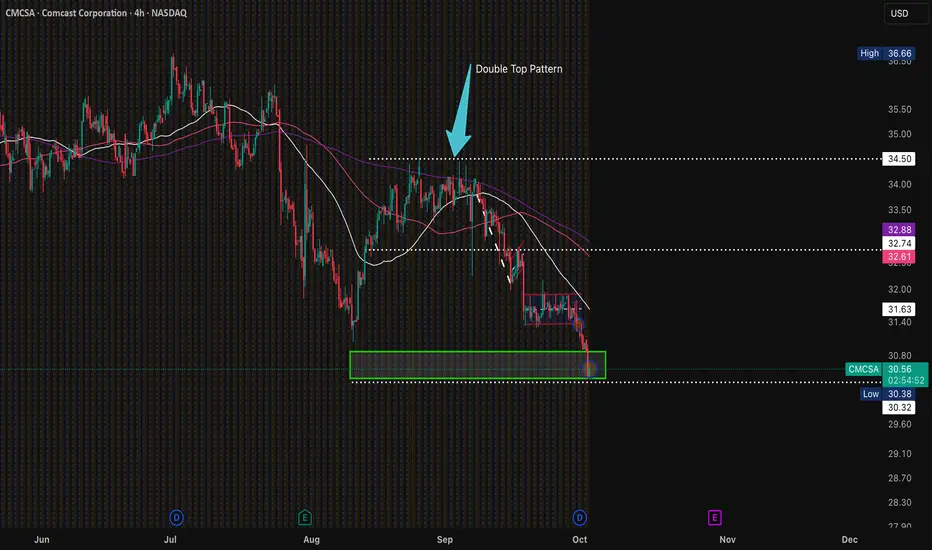
Update on $CMCSA Head & Shoulders on Monthly confirmedThe double top on the 4hr chart helped play out the head and shoulders pattern on the monthly chart. This gives bearish sentiment with the neckline quite obvious here...

$CMCSA looks to make a rebound As we enter the 4Q it is looking as though buyers interest may start picking up soon. Double top pattern is completing. Coupled with Comcast's undervalued metrics (low P/E and favorable value scores cited by analysts) and a solid dividend yield, this technical failure to decline can set the stage fo
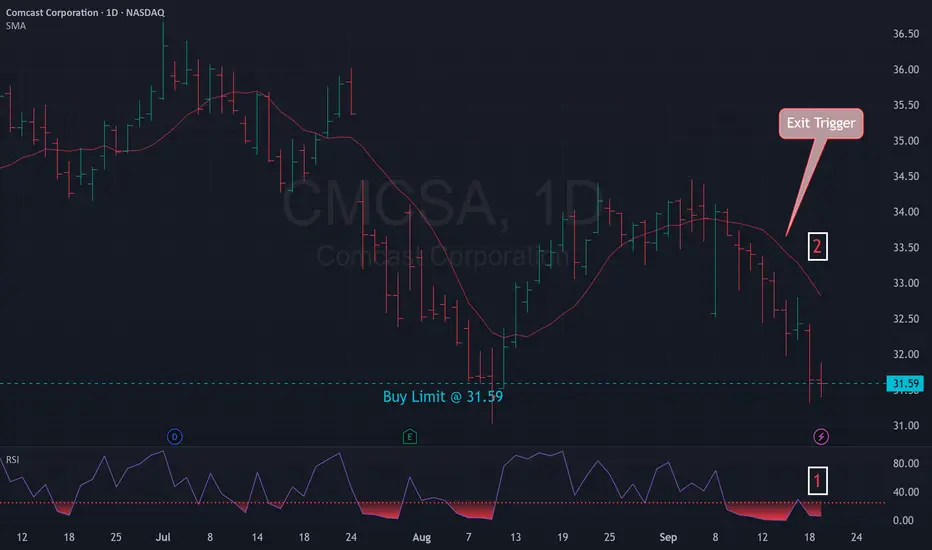
Mean Reversion Setup: CMCSA1. RSI in oversold region
2. Price likely to rebound back the the mean
Trade Rules:
Entry Trigger - RSI has cross below oversold region, enter limit buy at close price
Exit Trigger - Close at market when close price cross above exit trigger (Red Line)
Comcast will go lower the next few years. Sell now and Buy laterComcast has a huge! I mean huge fib level to test on the high time frame charts. This level will act as a magnet lower. We will have up and downs until we get this low (if we do). If it gets this low, It is a huge buy for me. I will need to wait a very long time though, because this is going to

Comcast Wave Analysis – 19 August 2025- Comcast reversed from support zone
- Likely to rise to resistance level 35.35
Comcast recently reversed up from the support zone located between the support level 31.40 (former low of wave (A) from April) and the lower daily Bollinger Band.
The upward reversal from this support zone started the

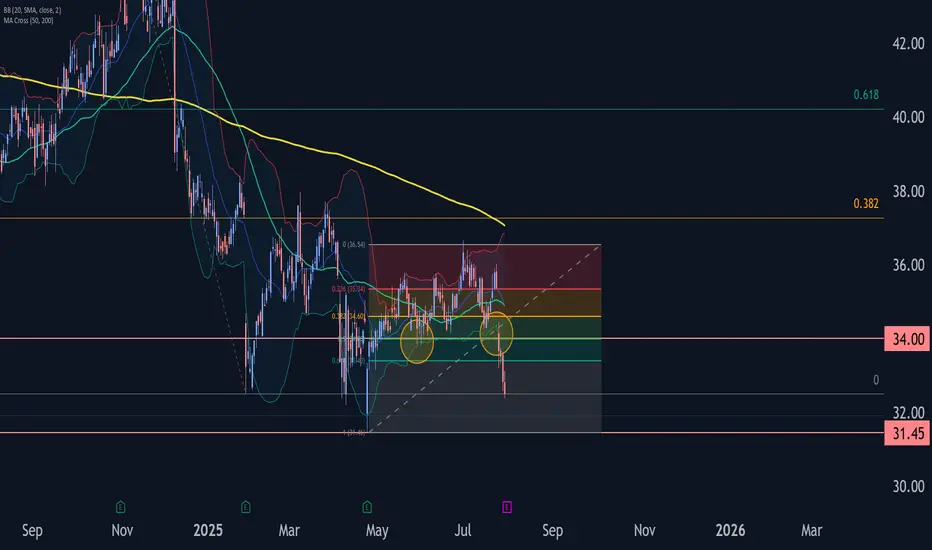
Comcast Wave Analysis – 30 July 2025- Comcast broke the support zone
- Likely fall to support level 31.45
Comcast recently broke the support zone located between the support level 34.00 (which has been reversing the price from the start of May) and the 50% Fibonacci correction of the upward wave A from April.
The breakout of this su
BUY NOW!! Best time in 10 yearsComm Services and Real Estate have the cheapest Shiller PEs right now in the whole market. CMCSA has a Shiller PE of 10.28 according to GuruFocus, almost at its lowest in 10 years, potentially indicating that this is one of the best times to buy, but lets look at some other factors as well.
The FW

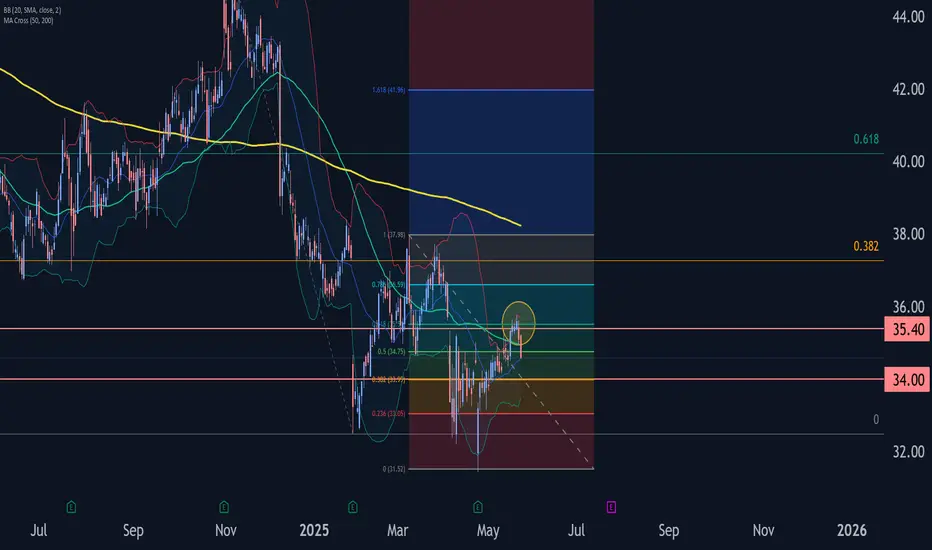
Comcast Wave Analysis – 22 May 2025
- Comcast reversed from resistance area
- Likely to fall to support level 34.00
Comcast recently reversed down from the resistance area between the resistance level 35.40, upper daily Bollinger Band and the 61.8% Fibonacci correction of the downward impulse from November.
The downward reversal fr
Comcast Stock Chart Fibonacci Analysis 052025Trading Idea
1) Find a FIBO slingshot
2) Check FIBO 61.80% level
3) Entry Point > 3/61.80%
Chart time frame:D
A) 15 min(1W-3M)
B) 1 hr(3M-6M)
C) 4 hr(6M-1year)
D) 1 day(1-3years)
Stock progress:A
A) Keep rising over 61.80% resistance
B) 61.80% resistance
C) 61.80% support
D) Hit the bottom
E) H

See all ideas
Summarizing what the indicators are suggesting.
Neutral
SellBuy
Strong sellStrong buy
Strong sellSellNeutralBuyStrong buy
Neutral
SellBuy
Strong sellStrong buy
Strong sellSellNeutralBuyStrong buy
Neutral
SellBuy
Strong sellStrong buy
Strong sellSellNeutralBuyStrong buy
An aggregate view of professional's ratings.
Neutral
SellBuy
Strong sellStrong buy
Strong sellSellNeutralBuyStrong buy
Neutral
SellBuy
Strong sellStrong buy
Strong sellSellNeutralBuyStrong buy
Neutral
SellBuy
Strong sellStrong buy
Strong sellSellNeutralBuyStrong buy
Displays a symbol's price movements over previous years to identify recurring trends.
Curated watchlists where CMCSA is featured.


Frequently Asked Questions
The current price of CMCSA is 42.900 USD — it hasn't changed in the past 24 hours. Watch Comcast Corporation Class A stock price performance more closely on the chart.
Depending on the exchange, the stock ticker may vary. For instance, on BCS exchange Comcast Corporation Class A stocks are traded under the ticker CMCSA.
We've gathered analysts' opinions on Comcast Corporation Class A future price: according to them, CMCSA price has a max estimate of 58.00 USD and a min estimate of 31.00 USD. Watch CMCSA chart and read a more detailed Comcast Corporation Class A stock forecast: see what analysts think of Comcast Corporation Class A and suggest that you do with its stocks.
CMCSA reached its all-time high on Mar 9, 2022 with the price of 56.300 USD, and its all-time low was 20.205 USD and was reached on Jun 27, 2013. View more price dynamics on CMCSA chart.
See other stocks reaching their highest and lowest prices.
See other stocks reaching their highest and lowest prices.
CMCSA stock is 34.06% volatile and has beta coefficient of 0.59. Track Comcast Corporation Class A stock price on the chart and check out the list of the most volatile stocks — is Comcast Corporation Class A there?
Today Comcast Corporation Class A has the market capitalization of 108.55 B, it has decreased by −2.48% over the last week.
Yes, you can track Comcast Corporation Class A financials in yearly and quarterly reports right on TradingView.
Comcast Corporation Class A is going to release the next earnings report on Oct 30, 2025. Keep track of upcoming events with our Earnings Calendar.
CMCSA earnings for the last quarter are 1.25 USD per share, whereas the estimation was 1.16 USD resulting in a 7.50% surprise. The estimated earnings for the next quarter are 1.10 USD per share. See more details about Comcast Corporation Class A earnings.
Comcast Corporation Class A revenue for the last quarter amounts to 30.31 B USD, despite the estimated figure of 29.80 B USD. In the next quarter, revenue is expected to reach 30.70 B USD.
CMCSA net income for the last quarter is 11.12 B USD, while the quarter before that showed 3.38 B USD of net income which accounts for 229.57% change. Track more Comcast Corporation Class A financial stats to get the full picture.
Yes, CMCSA dividends are paid quarterly. The last dividend per share was 0.33 USD. As of today, Dividend Yield (TTM)% is 4.35%. Tracking Comcast Corporation Class A dividends might help you take more informed decisions.
Comcast Corporation Class A dividend yield was 3.30% in 2024, and payout ratio reached 29.93%. The year before the numbers were 2.65% and 31.27% correspondingly. See high-dividend stocks and find more opportunities for your portfolio.
As of Oct 24, 2025, the company has 182 K employees. See our rating of the largest employees — is Comcast Corporation Class A on this list?
EBITDA measures a company's operating performance, its growth signifies an improvement in the efficiency of a company. Comcast Corporation Class A EBITDA is 38.22 B USD, and current EBITDA margin is 30.79%. See more stats in Comcast Corporation Class A financial statements.
Like other stocks, CMCSA shares are traded on stock exchanges, e.g. Nasdaq, Nyse, Euronext, and the easiest way to buy them is through an online stock broker. To do this, you need to open an account and follow a broker's procedures, then start trading. You can trade Comcast Corporation Class A stock right from TradingView charts — choose your broker and connect to your account.
Investing in stocks requires a comprehensive research: you should carefully study all the available data, e.g. company's financials, related news, and its technical analysis. So Comcast Corporation Class A technincal analysis shows the buy rating today, and its 1 week rating is buy. Since market conditions are prone to changes, it's worth looking a bit further into the future — according to the 1 month rating Comcast Corporation Class A stock shows the neutral signal. See more of Comcast Corporation Class A technicals for a more comprehensive analysis.
If you're still not sure, try looking for inspiration in our curated watchlists.
If you're still not sure, try looking for inspiration in our curated watchlists.