Verizon (VZ) — Bullish Reversal Setup! Smart Money Loading UpNYSE:VZ is showing early signs of a **trend reversal** after a long downtrend. The price is now testing the **upper boundary of its descending channel**, signaling potential breakout momentum.
Technicals suggest that **smart money might be accumulating** before a larger move toward the $45 range.
Key facts today
Next report date
—
Report period
—
EPS estimate
—
Revenue estimate
—
4,533 CLP
17.47 T CLP
134.52 T CLP
4.21 B
About Verizon Communications Inc.
Sector
Industry
CEO
Daniel H. Schulman
Website
Headquarters
New York
Founded
1983
ISIN
US92343V1044
FIGI
BBG00YFSGCZ5
Verizon Communications, Inc. is a holding company, which engages in the provision of communications, information, and entertainment products and services. It operates through the Consumer and Business segments. The Consumer segment provides consumer-focused wireless and wire line communications services and products. The Business segment offers wireless and wireline communications services and products, including FWA broadband, data, video and conferencing services, corporate networking solutions, security and managed network services, local and long-distance voice services, and network access to deliver various IoT services and products. The company was founded in 1983 and is headquartered in New York, NY.
Related stocks
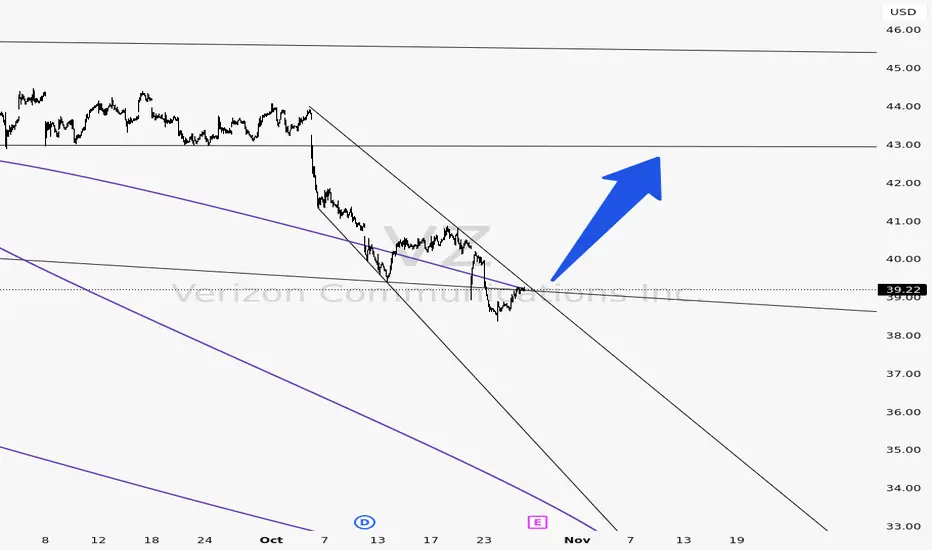
Verizon Wave Analysis – 23 October 2025
- Verizon falling inside sharp impulse wave 5
- Likely to reach support level 37.60
Verizon continues to fall inside the sharp downward impulse wave 5, which started earlier from the key resistance level 40.65 (former multi-month low from July) intersecting with the 38.2% Fibonacci correction of t

Starting To Buy Verizon VZ is at a support zone I bought 1/2 of a position with my lower timeframe showing up but the higher still down and overall sideways. If we push through I’ll add the other half at the $32 area. Currently in a nearly 3 decade consolidation the breakout could be massive. Let the dividends compound and

Mean Reversion Setup: VZ1. RSI in oversold region
2. Price likely to rebound back the the mean
Trade Rules:
Entry Trigger - RSI has cross below oversold region, enter limit buy at close price
Exit Trigger - Close at market when close price cross above exit trigger (Red Line)

VZ eyes on $41.xx: Major Support zone may hold the DUMP for buysVZ got dumped on the news of a CEO change.
Dropped into a Major Support zone $41.32-41.62
Old-school dividiend play at a good spot to add.

Verizon \$43.20 PUT – Weekly Short Play!
### 🚨💥 VZ \$43.20 PUT – Weekly Short Play! 💥🚨
**Strike:** \$43.20 🛑
**Expiry:** 2025-09-05 📅
**Direction:** PUT (SHORT) 🔻
**Entry Price:** \$0.25 💵
**Size:** 1 contract 📏
**Entry Timing:** Market Open ⏰
**Profit Target:** \$0.50 🎯 (+100%)
**Stop Loss:** \$0.12 🛑 (\~48%)
**Hold Horizon:** Exit by

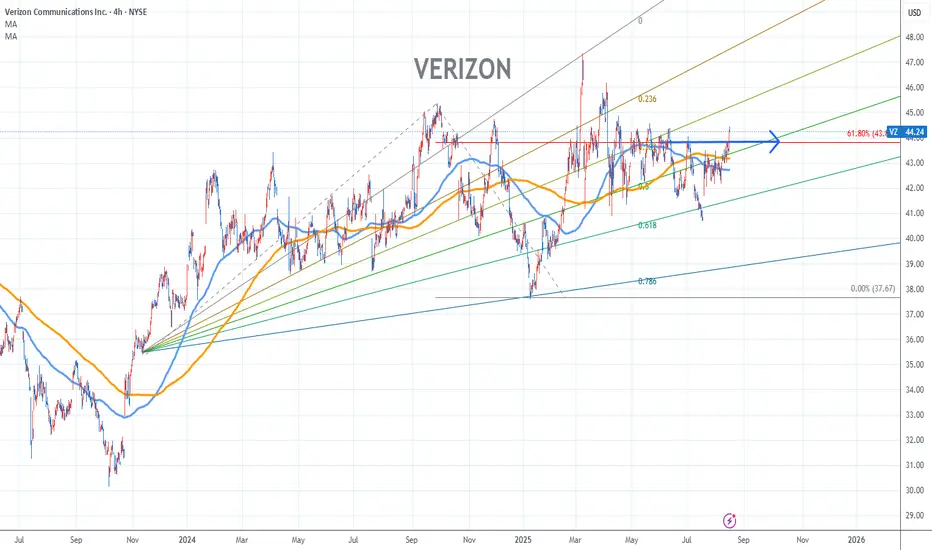
Verizon Stock Chart Fibonacci Analysis 081525Trading Idea
1) Find a FIBO slingshot
2) Check FIBO 61.80% level
3) Entry Point > 43/61.80%
Chart time frame:B
A) 15 min(1W-3M)
B) 1 hr(3M-6M)
C) 4 hr(6M-1year)
D) 1 day(1-3years)
Stock progress:A
A) Keep rising over 61.80% resistance
B) 61.80% resistance
C) 61.80% support
D) Hit the bottom
E)
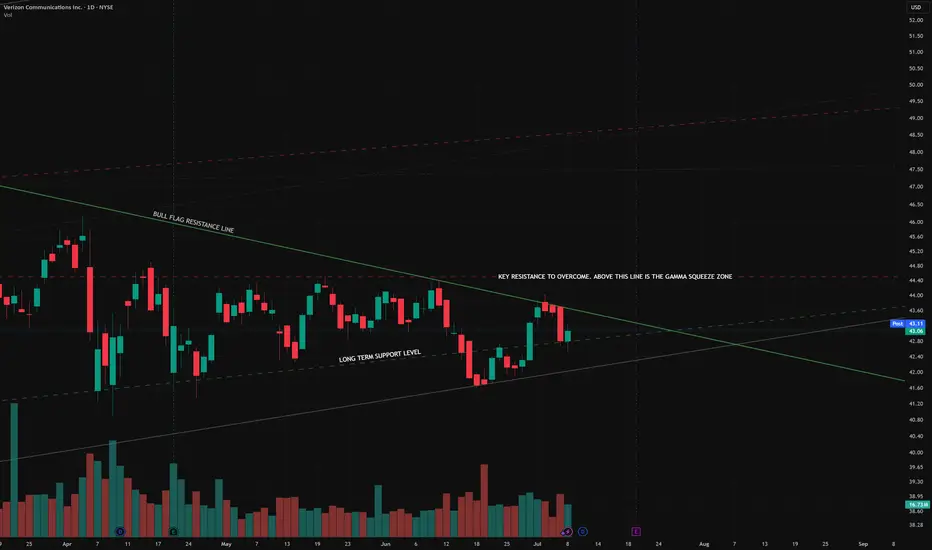
Verizon Communications Inc.(NYSE)- A Box Breakout⚠️ Disclaimer: This chart is for educational purposes only.
VZ- Price formed a multi-week horizontal consolidation (boxed range) and has just broken above the buy point (~$44.30). That breakout resolves the short-term range to the upside — a constructive sign.
The breakout candle printed on modest

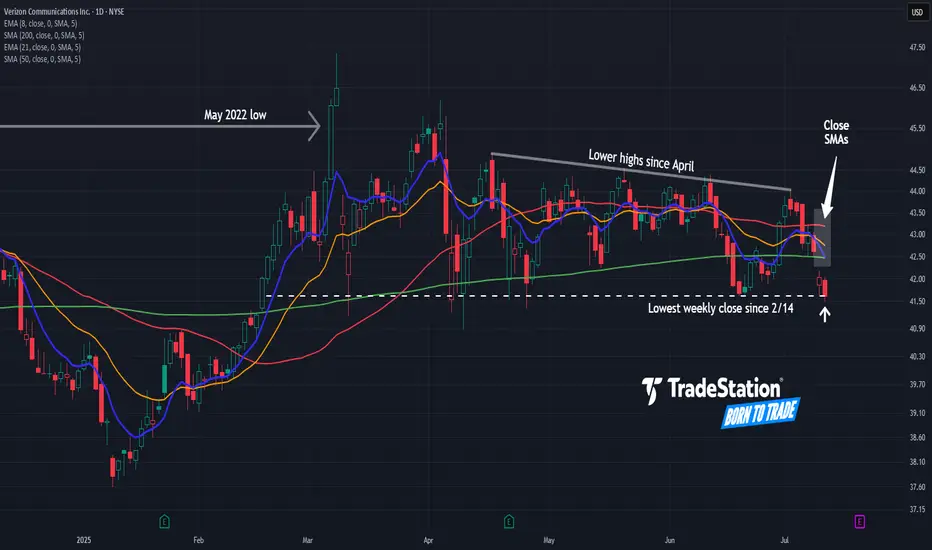
Verizon May Be Rolling OverVerizon Communications has been rangebound for more than a year, and now some traders could think it’s rolling over.
The first pattern on today’s chart is the May 2022 low of $45.55. VZ fell below that level in late 2022 and rebounded to it by mid-2024. The stock has been stuck below the same level
Where is Verizon headed next?Some quick points about the slight dip Verizon experienced over the past 5 trading days. Did bears step in and reject higher prices for VZ? Is the potential for a rally over?
In my opinion. No. But why you ask?
This stock trades relatively inverse to 10 year treasury yields. The 4 down days recen
See all ideas
Summarizing what the indicators are suggesting.
Neutral
SellBuy
Strong sellStrong buy
Strong sellSellNeutralBuyStrong buy
Neutral
SellBuy
Strong sellStrong buy
Strong sellSellNeutralBuyStrong buy
Neutral
SellBuy
Strong sellStrong buy
Strong sellSellNeutralBuyStrong buy
An aggregate view of professional's ratings.
Neutral
SellBuy
Strong sellStrong buy
Strong sellSellNeutralBuyStrong buy
Neutral
SellBuy
Strong sellStrong buy
Strong sellSellNeutralBuyStrong buy
Neutral
SellBuy
Strong sellStrong buy
Strong sellSellNeutralBuyStrong buy
Displays a symbol's price movements over previous years to identify recurring trends.
C
VZ.HQ
Chesapeake & Potomac Telephone Co. of West Virginia 8.4% 15-OCT-2029Yield to maturity
7.81%
Maturity date
Oct 15, 2029
VZ5680218
Verizon Communications Inc. 6.4% 15-NOV-2053Yield to maturity
6.39%
Maturity date
Nov 15, 2053
AU3CB026816
Verizon Communications Inc. 3.5% 04-NOV-2039Yield to maturity
6.36%
Maturity date
Nov 4, 2039
VZ5700832
Verizon Communications Inc. 6.1% 15-NOV-2053Yield to maturity
6.28%
Maturity date
Nov 15, 2053
VZ5652669
Verizon Communications Inc. 5.8% 15-SEP-2053Yield to maturity
6.20%
Maturity date
Sep 15, 2053
VZ4567039
Verizon Communications Inc. 4.65% 15-NOV-2047Yield to maturity
6.19%
Maturity date
Nov 15, 2047
VZ6231140
Verizon Communications Inc. 6.0% 30-NOV-2065Yield to maturity
6.07%
Maturity date
Nov 30, 2065
VZ5705330
Verizon Communications Inc. 6.05% 15-NOV-2053Yield to maturity
6.05%
Maturity date
Nov 15, 2053
VZ4774265
Verizon Communications Inc. 5.0% 15-DEC-2048Yield to maturity
6.04%
Maturity date
Dec 15, 2048
US92343VCM4
Verizon Communications Inc. 5.012% 21-AUG-2054Yield to maturity
6.03%
Maturity date
Aug 21, 2054
See all VZCL bonds
Curated watchlists where VZCL is featured.


Frequently Asked Questions
The current price of VZCL is 38,470 CLP — it has decreased by −10.05% in the past 24 hours. Watch Verizon Communications Inc. stock price performance more closely on the chart.
Depending on the exchange, the stock ticker may vary. For instance, on BCS exchange Verizon Communications Inc. stocks are traded under the ticker VZCL.
VZCL stock has fallen by −10.05% compared to the previous week, the month change is a −10.05% fall, over the last year Verizon Communications Inc. has showed a −4.04% decrease.
We've gathered analysts' opinions on Verizon Communications Inc. future price: according to them, VZCL price has a max estimate of 48,249.76 CLP and a min estimate of 40,681.17 CLP. Watch VZCL chart and read a more detailed Verizon Communications Inc. stock forecast: see what analysts think of Verizon Communications Inc. and suggest that you do with its stocks.
VZCL reached its all-time high on Sep 2, 2025 with the price of 42,768 CLP, and its all-time low was 25,852 CLP and was reached on Jul 17, 2023. View more price dynamics on VZCL chart.
See other stocks reaching their highest and lowest prices.
See other stocks reaching their highest and lowest prices.
VZCL stock is 11.17% volatile and has beta coefficient of 0.39. Track Verizon Communications Inc. stock price on the chart and check out the list of the most volatile stocks — is Verizon Communications Inc. there?
Today Verizon Communications Inc. has the market capitalization of 161.87 T, it has increased by 0.88% over the last week.
Yes, you can track Verizon Communications Inc. financials in yearly and quarterly reports right on TradingView.
Verizon Communications Inc. is going to release the next earnings report on Jan 27, 2026. Keep track of upcoming events with our Earnings Calendar.
VZCL earnings for the last quarter are 1.17 K CLP per share, whereas the estimation was 1.15 K CLP resulting in a 1.61% surprise. The estimated earnings for the next quarter are 1.00 K CLP per share. See more details about Verizon Communications Inc. earnings.
Verizon Communications Inc. revenue for the last quarter amounts to 32.63 T CLP, despite the estimated figure of 33.07 T CLP. In the next quarter, revenue is expected to reach 33.60 T CLP.
VZCL net income for the last quarter is 4.78 T CLP, while the quarter before that showed 4.68 T CLP of net income which accounts for 2.09% change. Track more Verizon Communications Inc. financial stats to get the full picture.
Yes, VZCL dividends are paid quarterly. The last dividend per share was 664.74 CLP. As of today, Dividend Yield (TTM)% is 6.60%. Tracking Verizon Communications Inc. dividends might help you take more informed decisions.
Verizon Communications Inc. dividend yield was 6.71% in 2024, and payout ratio reached 64.77%. The year before the numbers were 6.99% and 95.63% correspondingly. See high-dividend stocks and find more opportunities for your portfolio.
As of Nov 22, 2025, the company has 99.6 K employees. See our rating of the largest employees — is Verizon Communications Inc. on this list?
EBITDA measures a company's operating performance, its growth signifies an improvement in the efficiency of a company. Verizon Communications Inc. EBITDA is 48.32 T CLP, and current EBITDA margin is 35.98%. See more stats in Verizon Communications Inc. financial statements.
Like other stocks, VZCL shares are traded on stock exchanges, e.g. Nasdaq, Nyse, Euronext, and the easiest way to buy them is through an online stock broker. To do this, you need to open an account and follow a broker's procedures, then start trading. You can trade Verizon Communications Inc. stock right from TradingView charts — choose your broker and connect to your account.
Investing in stocks requires a comprehensive research: you should carefully study all the available data, e.g. company's financials, related news, and its technical analysis. So Verizon Communications Inc. technincal analysis shows the sell today, and its 1 week rating is sell. Since market conditions are prone to changes, it's worth looking a bit further into the future — according to the 1 month rating Verizon Communications Inc. stock shows the neutral signal. See more of Verizon Communications Inc. technicals for a more comprehensive analysis.
If you're still not sure, try looking for inspiration in our curated watchlists.
If you're still not sure, try looking for inspiration in our curated watchlists.