XOM. Recent dramatic drop looks like a buying opportunity I think we are at the end of a long consolidation (wave e of a EWT 4th wave). Stop would be close < c. Will be buying some this week.
XOMCL trade ideas

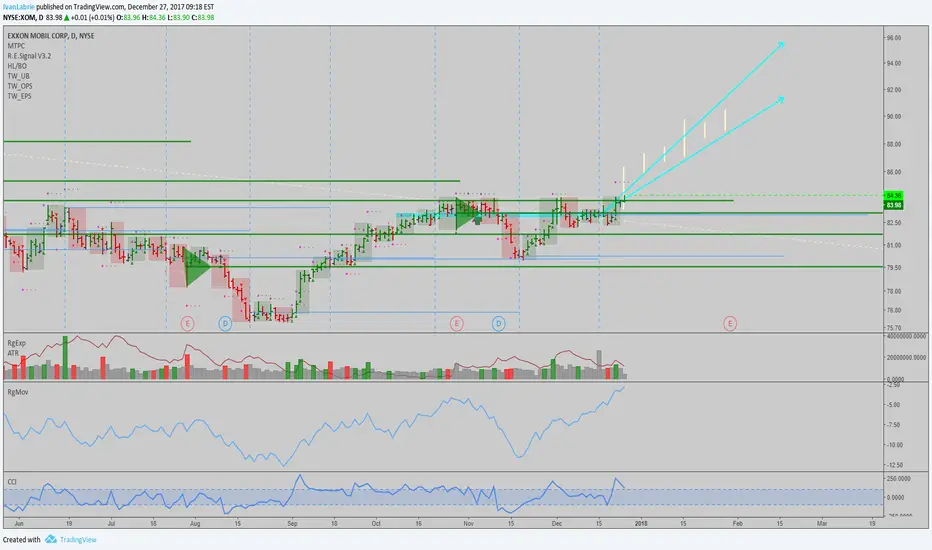
XOM: Weekly uptrend active, potentially explosiveI'm long $CVX and $XOM as well as oil futures here. I like how this setup looks, so I'm looking to add to longs today, ideally if we break the previous high. Weekly trend is already up, and it's likely that we see a really explosive rally out of this juncture, so try not to miss the run!
Best of luck,
Ivan Labrie.

ExxonMobil Perfect long term buy opportunity. Hi Guys, Here's good stock for investors out there, very high probability of going upside, it is at very good level for buy. i think it's part of bigger B wave, C wave still have to come, But looks very good to buy, possible level it can go i have shown in chart.
Thanks & Trade safe.


JUGGERNAUT EXXON MOBIL VERY BULLISH VALIDATION OF 200 WEEK MA...RETESTED AND VALIDATED 200 WEEK MA and 2 YEAR TREND LINE...STILL FLYING UP!


Bullish on EnergySearch #OOTT on twitter for more insight.
----
No comments I wish to write down. Read the chart.
----
Like
Comment
Follow for more

The rise of Exxon MobilFirst, I look at the monthly chart, it shows me a bullish trend from day 1. Again, don't cry over spilt milk, why didn't I put $100 in it when it was $1.78 in 1969 , some 40 over years ago ( if you are in that era). Good if you are still holding, congrats! A multi-bagger.
Next, I zoom into the weekly chart and I identify a nice ABC pattern with C partially forming. This is the opportunity for me!
If you look carefully, the peak of the C pattern touches the peak of 104.64 in 03/03/2014 if it hits.
Day chart tells me the price action is still bullish with a hammer as the last closing candle. Moving to a lower time frame, 1H chart shows me that there is a gap down last Friday. There is a gap between 82.99 and 83.95 awaiting to be filled. If that happens, it will bring the price action above the 21EMA, a confirmation that I like to see. I have mixed results with gaps, sometimes it close the gap within hours and in some cases (see EURUSD), it takes weeks and is not closing yet.
On closer examination, using the FIB level also shows me there are several times that price actions is rejected in the 83.90 zone which is nearly hitting the 50% FIB level. That explains the current price action being gap down which also means that there might be a possibility of the price to fall to the 0.236 FIB level or 80-ish mark on the price.
I would be awaiting for 2 things :
1. price gap to be closed first
2. see if price falls to 80's level and rebound
See my chart on USOIL and XOM for further explanation


The current position of the symbolThe current position of the symbol (support and resistance ahead)
Without forecast

APRIL 80 CALLI like this because it has been in a channel can see a nice
break out. above purple line.

XOM Another "Fill Up the SuperTanker"!Successfully closed above the Reverse H&S Neckline
RSI Breaks Trend line
Positive MACD
Crude Oil Bullish Crossover from 8 & 200 WEEK MA!

EXXON MOBILE in reverted Head and Shoulder configurationExxon has drawn a very clean "Head and Shoulder" pattern, just wait for the breakout of the neckline to take position...


Exxon Pushes Towards a Bullish Breakout on Oil Optimism ..As #oil climbs higher, $XOM & $XLE attempt to do the same
Is Exom Mobile heading north?Notice how the price rebound from the 50% FIB level ? Also, did you see the last green candle was a nice bullish engulfing candle over the previous one?

Exxon long the bullish uptrend channel indicates a bullish move for Exxon, espeiclally when oil prices recoverd

Stocks that have raised dividends for at least 25 Years11/18/17 - I am more bullish
than bearish long term looking
at the weekly and monthly time-
frames. I see higher lowes from
july 2010, sep 2015, and sept 2017
along with higher highs from oct 2007
and july 2014. The current price of
80.24 is the lowest it has been in the
last 6 years. Buy low, sell high, higher
div yield then inflation which is at 2%,
Over the last 34 years, Exxon’s dividend
payment has increased at an average
annual rate of 6.4%.
34 consecutive years of increases.
Dividend yield: 3.7% ($3.08/share)

Stocks that have raised dividends for at least 25 Years11/18/17 - I am more bullish than bearish long term looking at the weekly and monthly time- frames. I see higher lowes from july 2010, sep 2015, and sept 2017 along with higher highs from oct 2007 and July 2014. The current price of 80.24 is the lowest it has been in the last 6 years. Buy low, sell high, higher div yield then inflation which is at 2%, Over the last 34 years, Exxon’s dividend payment has increased at an average annual rate of 6.4%. 34 consecutive years of increases. Dividend yield: 3.7% ($3.08/share)


