HPE exhausting, down down!! DailyHPE is forming a HS and a bearish flag. The sentiment of the market is bearish, I'm not waiting to finish up both formations, there is no signal of bull power. Great risk and reward ratio on this early call. It can also go deeper but will see at that time.
2HP trade ideas

Top Trade Ideas for January 2022Top trade ideas for 2022. We are seeing some mean reversion from names at the top and names at the bottom. One use of these charts. The other use is to see relative strength. I have scanned the market for these names. Now I sort them based on performance. This allows me to track the trends and performance. It also allows me to show opportunity cost.

HPE IS GOOD TIME TO TAKE PROFIThpe is good time to take profit till next company meeting and devidend.

Possible Inverse head and shouldersThere is a possibility for inverse head and shoulders on HPE.
Wait the retest on neckline.
Stop loss under the head

HPE HS Break with back testAs described in title. Mid to long term swing. Head and shoulders break with backtest.

HPE reaching the top of the inverted H&S / possible LTF breakoutAfter a long inverted head and shoulders formation on HTFs, the price came to the top of the structure. Now it's reaccumulating on LTF, to break out above 15,40 and then continue above 16,00 once it reaches that level.
Inverted head and shoulders and Wyckoff is in play. There's a possibility that the price will move around a bit, before reaching 15,40 though, so only time will tell. I'm counting on this happening within the next few days.

HPE (Hewlett Packard Enterprise Company) Target Price 15.89HPE Entry Price 15.46
EMA 10 Close Price 15.23
EMA 20 Close Price 15.14

HPE Target Price 15.89HPE (Hewlett-Packard Enterprise)
H4 Chart
14.78 EMA 10 Close
14.74 Close
14.64 Horizontal Support Resistance
14.64 Fibonacci Retracement at 23.6%
14.62 EMA 20 Close
Daily Chart
14.72 Close
14.64 Horizontal Support Resistance
14.64 Fibonacci Retracement at 23.6%
14.63 EMA 10 Close
14.48 EMA 20 Close

SECOND POSSIBLE SCENARIO FOR HP! DISTRIBUTION!Hello my beauties.
We will wait for the price to move towards the top of the range and give us some more indications. I tend to think that HP is going to show strength regardless, but I would like to react to the price rather than predict it. What looks like a Spring (quick weakness in the price followed by a rapid recovery within the range). The price might also provide the Wyckoff events outlined in this analysis, so we still need to wait for some more information before we can delineate a clear trade setup. Remember that the lines don't intend to predict price action exactly, rather give us a general view of the events that will follow based on the Wyckoff trading strategy.
If you find this idea to be helpful like, follow, and drop a comment below if you'd want me to analyse a different pair.
Consider supporting me if you think I am providing you with value.
Peace.
Luca, TrickleDownFX

TWO SCENARIOS FOR HP ACCUMULATION OR DISTRIBUTION?Hello my beauties.
I think HP might be accumulating. The range is clearly defined, but we need to understand whether this was a spring or a sign of weakness. Regardless, we will wait for the price to react to the top of the range by whether breaking it and retesting it successfully, or by breaking out and quickly recovering beneath the red line.
If you find this idea to be helpful like, follow, and drop a comment below if you'd want me to analyse a different pair.
Consider supporting me if you think I am providing you with value.
Peace.
Luca, TrickleDownFX

Potential 2Down 2Up Weekly Reversal For HPE Potential 2Down 2Up Weekly Reversal For HPE : Per the Strat, this week I'm watching ticker HPE (Hewlett Packard Enterprise CO) for a weekly entry trigger at 13.60 (last weeks high). If that trigger is met, I'll look for it to reach a magnitude of 14.41 (week before last weeks high). If it can reach magnitude, then it could also continue up to previous highs. Just look out for exhaustion risk to the upside if it continues up after the original 14.41 magnitude.

It's here 🩳The idea behind this chart is to short from 13.49$ level from daily timeframe *used to be support now it's a resistance* + 13.5 it's an even number, then I see the sharp approach on m5 yesterday, and understanding where I'll be wrong, that's 13.61
❤️Please, support our work with like❤️

2 long position on HPEbuy on Fibonacci golden pocket 0.61-0.65 (13.51$) and second buy entry is at 0.5 (12.52$)


HPE, Trade review , something I missed originally. I have realized that I need to pay more attention to volume and effect and specifically , anomalies ...
I took HPE as a trade as it broke out of a base and then nothing really happened , the move was not really what you would expect looking at the volume candles and I figured I had found the jackpot . What I realized though is that those are not accumulation candles ! they are a sign that the up-trend was actually becoming exhausted! and we have market makers and or insiders selling into the breakout .
So yes , there was buyers at that time but the big beautiful green candles are actually an illusion , because in reality , if we had that kind of real buying volume come in, the price would show it ( effort vs result , Wyckoff methodology ) .
So , anyways , just wanted to share .I think as the tiny little mites in the trading world one of the best tools we have to see what the smart money is up to is Volume , which coincides with price and when we have an anomaly of these two we must assess what is probably happening . When we have an effort vs result that creates an anomaly we need to investigate like Holmes and Watson lol . I missed to do so on HPE but the trade has helped to improve my knowledge on the importance of volume price action anomalies . Who knows what will happen going forward HPE could continue its climb or it could start to decline but we do have a much better idea what happened on that failed breakout based on the volume and price action .
Perhaps check out Wyckoff's works and I really like Anna Coulling's publications on the subject too ( which are strongly founded on Wyckoff's methodology btw) .
This is all just my personal take , I am not a professional , but I am a dedicated trader who is always trying to review past trades and improve ~

Hewlet Packard Poised for GrowthWhat would drive this stock higher? A favorable earnings report. Investors don't seem ready to give up on the company, but they may need a little encouragement.

HPE - LongHPE CMP - $13.48
Looking bullish in higher time frame. One can go for Swing / Short Term Trade setup with the following entry, exit & targets.
Buy Range $13.50 / Stop Loss $13
Target 1 - $14
Target 2 - $15
Target 3 - $16
Disclaimer: This is my view and for educational purpose only.

Long | HPENYSE:HPE
Possible Scenario: LONG
Evidence: Price Action
TP1~ 16.5$
Call options, Strike 16$, 05/21/21
This is my idea and could be wrong 100%,

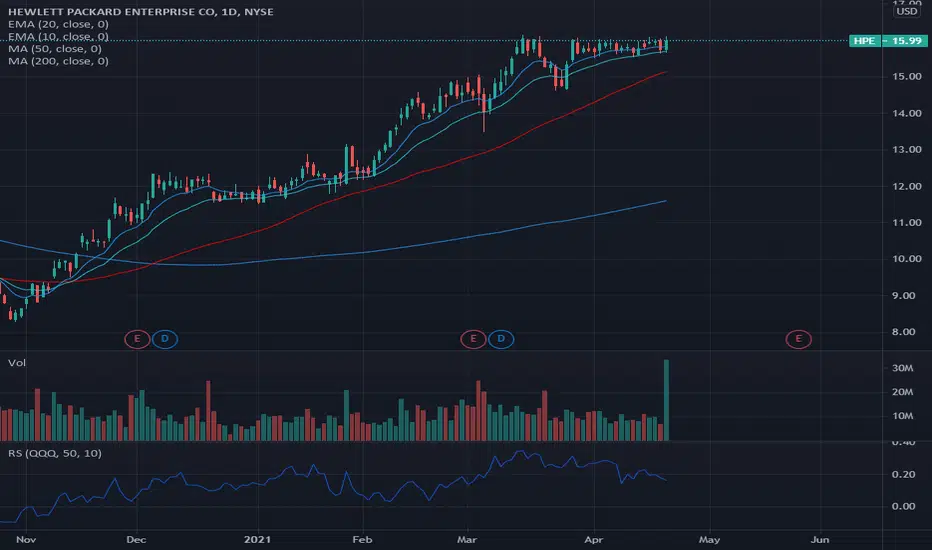
HPE, Looks ready to enter a new high .HPE is setting up well for a BO, I just took a position in the aftermarket (primarily based on todays volume, candle and the base we have formed) . I don't like the looks of its relative strength but most similar stocks are in the same boat at this time given the current trading environment and we closed strong overall today .


Big Potential for HEWLETT PACKARD ENTERPRISE CO
Hello traders, HEWLETT PACKARD ENTERPRISE CO is in a bullish configuration with large executed buy volume and a hammer candle. Looking at the TIMEFRAME M1 we observe a large hammer candle followed by a short trace and a large buy volume traded. It started with breaking the top of the bollinger to reach the top of the comfort zone and check it. There is a great chance of brekouting the price with the momentum, then subsequently the area to go to another. And climb on the high which comes before test for the breakout of the comfort zone and it will check the top of the bullish channel.
Please LIKE & FOLLOW, thank you!

HPE SUPPORT / RESISTANCE FLIP CONSECUTIVE BULL FLAGS NOW HOLDING SUPPORT OVE RPREVIOUS RESISTANCE. TARGET IS THE FLAG POLE HEIGHT AND POTENTIALLY THE 1.618 FIB. HIDDEN BULLISH DIVERGENCE ON THE MACD.
