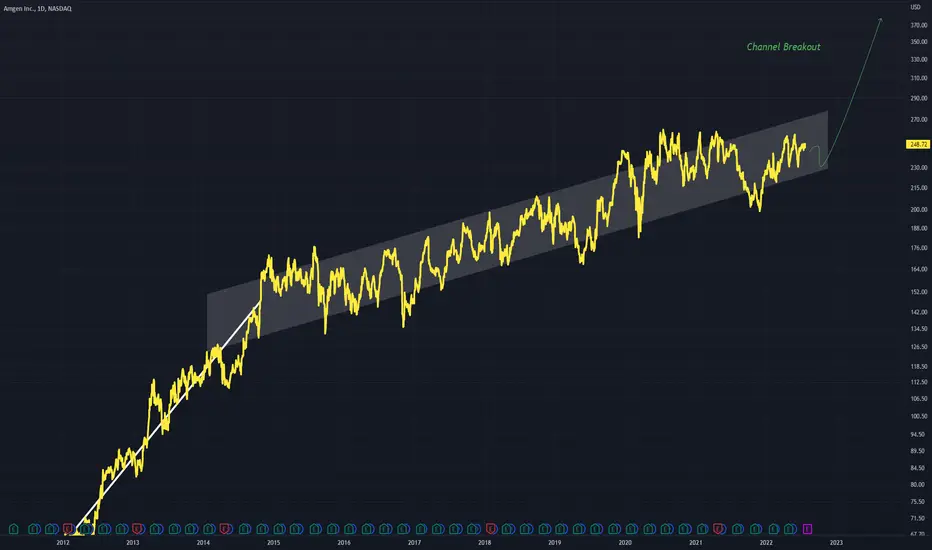
AMGN - Channel Breakout For a long period of time price on AMGN has been within an ascending channel
This channel could be viewed as a flag of a bullflag, but we will just assume its only an ascending channel .
A breakout higher out of the channel is required to continue the bull trend
AMG trade ideas
Amgen Could Be ToppySometimes in a bear market a handful of stocks remain closer to their highs before rolling over. Amgen (AMGN) could face such a condition.
The main pattern on today’s chart are the candlesticks of July 8, 11 and 12. The drugmaker attempted to push above $249 but each time closed below that level. Also notice how this price area roughly matches the closing price before the high-volume bearish gap on April 28.
The result could be a lower high. This may indicate sellers are back in control, especially with a potential double top near $258.
Next, stochastics are dipping from an overbought condition.
Finally you have the 50-day simple moving average (SMA), which AMGN held on Thursday. A break under this level could make traders expect a retest of the recent lows below $230.
TradeStation has, for decades, advanced the trading industry, providing access to stocks, options, futures and cryptocurrencies. See our Overview for more.
Important Information
TradeStation Securities, Inc., TradeStation Crypto, Inc., and TradeStation Technologies, Inc. are each wholly owned subsidiaries of TradeStation Group, Inc., all operating, and providing products and services, under the TradeStation brand and trademark. You Can Trade, Inc. is also a wholly owned subsidiary of TradeStation Group, Inc., operating under its own brand and trademarks. TradeStation Crypto, Inc. offers to self-directed investors and traders cryptocurrency brokerage services. It is neither licensed with the SEC or the CFTC nor is it a Member of NFA. When applying for, or purchasing, accounts, subscriptions, products, and services, it is important that you know which company you will be dealing with. Please click here for further important information explaining what this means.
This content is for informational and educational purposes only. This is not a recommendation regarding any investment or investment strategy. Any opinions expressed herein are those of the author and do not represent the views or opinions of TradeStation or any of its affiliates.
Investing involves risks. Past performance, whether actual or indicated by historical tests of strategies, is no guarantee of future performance or success. There is a possibility that you may sustain a loss equal to or greater than your entire investment regardless of which asset class you trade (equities, options, futures, or digital assets); therefore, you should not invest or risk money that you cannot afford to lose. Before trading any asset class, first read the relevant risk disclosure statements on the Important Documents page, found here: www.tradestation.com .

RectangleNeutral until a trendline is broken with a trend in that direction.
Targets for a break to the upside are above the Rectangle and vice versa.
No recommendation

AMGN Continuation Long on the Daily AMGN Continuation Long on the Daily . TPs and SL on the chart. Max leverage/margin or call option play.


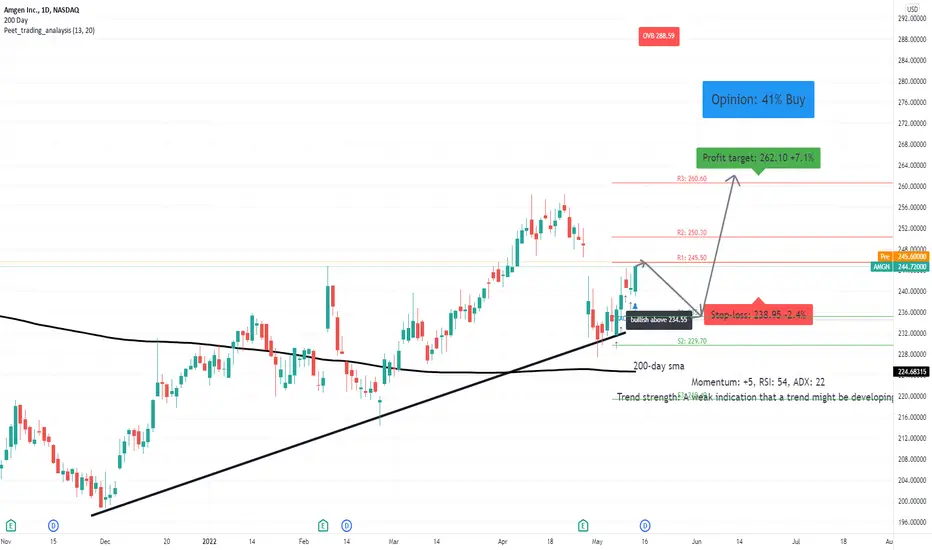
AMGN: higher highs and higher lowsA price action above 234.55 supports a bullish trend direction.
Crossing below this level will negate the bullish stance.
Remains above its 200-day simple moving average.
Upside price momentum supports the bullish trend.
RSI leaves enough room for further upside price potential.
$AMGN reversal looks nice #sss50percentrule possible2d2u on the week and making it to the target will trigger the 50% rule on the month. This may be a nice swing if it can hold and keep pushing.

$AMGN with a Bullish outlook following its earnings #Stocks The PEAD projected a Bullish outlook for $AMGN after a Negative over reaction following its earnings release placing the stock in drift C with an expected accuracy of 66.67%.
AMGN: A High Probability Buy Setup Amgen Inc. has been trending up since December last year. We can observe that price has recently reached a higher high at the resistance level of 258.00. Therefore, we are only looking for buy entries for this stock.
258.00 is a very strong resistance level; we can see from the past that prices have rejected more than 9 times from this level. After rejections, prices retraced but eventually rose again to retest this level multiple times. Last week, price gapped down from this resistance level, dropping back to the trend line. Therefore, this gives us a great opportunity to buy the pullback.
Entry Criteria:
We can observe from the past price movement that when the price touched the current ascending trend line, a gap up immediately was formed, followed by a strong bullish momentum sending the price back to the previous high. Therefore, during the next few days, we will be looking for a gap up from the trend line. Then we will place our buy stop orders to capture the bullish momentum.
This is a high probability buy setup because many factors support another bullish impulsive movement which could potentially send the price back to retest the recent high.

14/4/2022 NSDQ AMGNDesicion to Buy. Entry Price = $254.00. Target Price=$258.00. Stop Price=$250.00.

$AMGN watch for break of the 240 zoneSellers have been present in Amgen , keeping this stock under the 240 zone since FEB's pop.
Lot of dark pool and call option flow showing bullish signs as the stock continues consolidating and eating away supply.
I think the bulls win here, alarm it for $240 as a good long idea.
I'm in a starter JAN 275c looking to add more positions upon breakout
Conversely , if bulls fail to capitalize downside target would be 220 zone.


$AMGN LONG IDEA$AMGN is one of my favorite bio tech stocks as it has solidified its place as a winner over the years. They had a bit of a slowdown and consolidation over the past few years as they didn't have as much involvement with COVID, but certainly didn't lose too much value.
Watch for a 4hr close above $241.50 to send us back to $260+ over next few weeks.

$AMGN with a Bullish outlook following its earnings #Stocks The PEAD projected a Bullish outlook for $AMGN after a Positive Under reaction following its earnings release placing the stock in drift A with an expected accuracy of 100%.

Amgn analise wyckoffon this entry we have a distribution phase now we see a support point which confirmed the testing of the climactic movement

W PatternsAs a rule, when I see a crooked W, I steer clear and watch it if it is a security I want. The impulse/long leg/is to the downside whereas a bullish crooked M pattern, the impulse leg is up. We are all different.
Crooked Ws are not always bearish, but it just gets too complicated for this post so I will stop there. For the most part, a W is bearish.
I have noted a W will pull to the middle, or the hump, or point in the middle of the W. I marked it with a green X.
Does this always happen? NO. Can it go further than this point or not as far? YES. Just a guide for me, and we are all different.
Does the same exact thing happen twice in the market on a regular basis? NO LOL
Often a Double Bottom will have a W associated with it. I often wait for price to come back to this point and reassess if I am not already in the security when I see it. You can do fib levels to figure out which bearish harmonic pattern the W represents if you wish to hang on to the last leg up of that W, then sell and catch it again when it hits another entry level. Ws are usually bearish but if you know your patterns, it is possible to go long on the last leg up of the W.
No recommendation
Tomorrow is another day (o:

ABC BullishPossible stop under C.
No recommendation.
Short percent is 2.14%.
Earnings due again on 5-18 BMO.
W not so attractive but have noted that securities often pull to the middle hump of the W and this one is very close. With double bottoms often there is a W associated with the double bottom. Ws can be bearish. The tail of a red long legged doji candle did hit the 2nd
leg of the W.

AMGN Long Term LongTop pharma pick right now other than BMY. P/E 13.11 with forecasted 6-7% earnings growth and an EPS yield of 7.62%.
Historic Norm P/E 18.89
^ 10 Y = 14.50
^ 5 Y = 14.25
3.49% Div payer.
Valuation estimate based on 2023 forecasted EPS (19.11) and P/E of 14.25 = $272.32

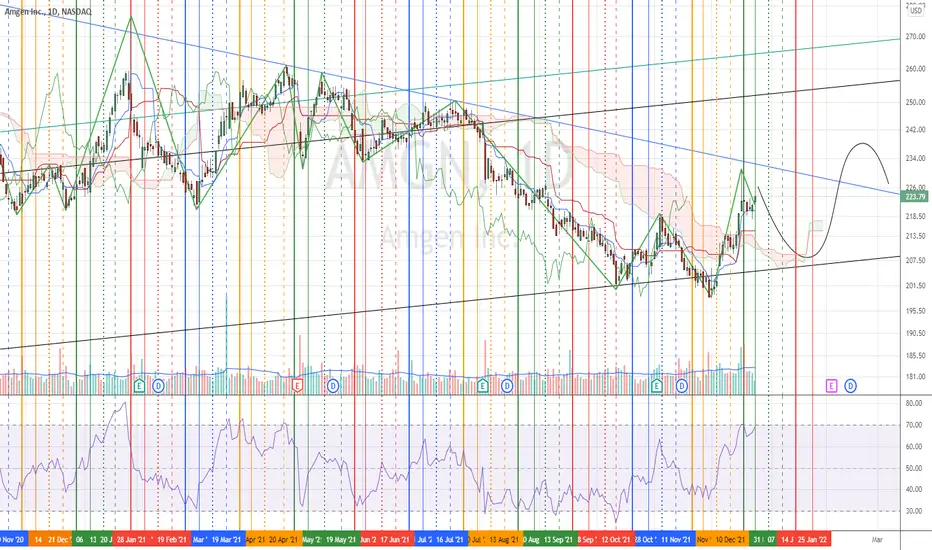
Bearish on Amgen. AMGNImmediate targets 211, 200,186. Invalidation at 279.
We are not in the business of getting every prediction right, no one ever does and that is not the aim of the game. The Fibonacci targets are highlighted in purple with invalidation in red. Fibonacci goals, it is prudent to suggest, are nothing more than mere fractally evident and therefore statistically likely levels that the market will go to. Having said that, the market will always do what it wants and always has a mind of its own. Therefore, none of this is financial advice, so do your own research and rely only on your own analysis. Trading is a true one man sport. Good luck out there and stay safe

AMGN ShortCommodity Channel Index (CCI)
Jan 26 Daily
Short-Term Bearish
Volume 2,799,706
Close Price 222.54
Pattern Duration 1 day
Triple Moving Average Crossover (4-day 9-day 18-day)
Jan 27 Daily
Short-Term Bearish
Volume 2,492,054
Close Price 224.00
Pattern Duration 1 day
Commodity Channel Index (CCI)
Jan 27 Daily
Other
Volume 2,492,054
Close Price 224.00
Pattern Duration 1 day

AMGN has a nice setupAMGN looks ready to rip. Bullish crossover on the Stochastic, Super Trend is green and price closed above the 200 EMA. Looking for $230+ this week.

AMGN_Continue the correction processLocated close to dynamic resistance.
Be careful on the BUY side.
The RSI has also reached the buy saturation zone.
BUY after breaking the dynamic resistance and stabilizing it high.