TSLA just goooooo alreadystill searching for 190s after 9 some days of bouncing right at the same spot. long two weeks out 180s 190s hopefully we'll see some action into this
TL0 trade ideas

$TSLA 2025-2031 cycleA repetition of the last 2013-2019 NASDAQ:TSLA stock cycle.
Taken from the end of 2019. In concordance with Bitcoin cycle.

TSLA : Pattern Analysis / Date : 26.05.24Key Points: NASDAQ:TSLA
1. A symmetrical triangle chart pattern is a period of consolidation,
2. A breakdown from the lower trend line marks the start of a new bearish trend.
3. A breakout from the upper trend line indicates the beginning of a new bullish trend
4. 196 may act as a strong resistance
5. 161 may act as a support.
Notice :
looking for a job
------------------------
Is Your company hiring an assistant day & swing Trader/ assistant technical analyst/ assistant equity analyst?
I am a day & swing trader, freelancer technical analyst & equity analyst. Now, I am looking for a job .
Skills: Chart analysis, Trend identification, Price pattern recognition, important support and resistance levels identification,
Set up trade idea ( long /short),
Set up entry and target price.
Valuation, making analysis report etc...
Experience: 5 years.

Tesla - Increased Probability of ValuationGoing against the market as we interpreted it in our short-term forward projection, Testla's Multi Timeframe Fibo Clouds are outlining contours that lead us to believe in immediate appreciation.
Graphical interpretation based on our FIbonuvens Multi Timeframe model has proved to be efficient even when apparently simple candles move with little expression. The quality of this reading model often allows us to set stop losses with very attractive values within the proposed risk management framework.

TSLA eyes on $179.94 then 157.16 for possible bottomsTSLA has just hit a Genesis fib at $179.94.
Expecting some bounce but looking lower.
Golden fib below at $157.16 would be ideal.
Here is a full view of the Genesis Fib
See "related Ideas" below for my methodology.

$TSLA Might be About to Make a Big MoveTSLA has been compressing into a multi-year squeeze on the charts.
Whether it's the global economy going into a rough patch, the uncertainty of the 2024 US presidential election, or multiple wars happening in the East there seem to be a lot of potential market forces possibly pushing high multiple stocks down for the near future.
But Tesla as a company is on track for 50% YoY growth, completely dominating the global EV market while traditional OEMs pull back their EV efforts, Chinese OEMs struggle with margins, and other pure EV companies struggle to turn a profit at all.
Personally, I think TSLA will have a rough winter as the market hedges their bets on a market level, after which it will be primed for a huge upward breakthrough once the dust settles on the other side.


Testing New MethodI've created my own model. For which I can see the current trend and trend formations. The mean returns indicator serves to observe the current trend in the past n days. It assumes that whenever mean returns is over 0 a long trend is occurring, while below 0 we are looking at a downtrend. This is the latest signal given by the program. Enjoy the signal, hope it's correct

TESLA IS REALLY BOTTOMINGBased on my previous post, looks like it is what i was expecting
I have been actively bought tesla for the past few days
For the short term view, the latest price action (the Black color line), was a sign
that the price structure has been on going for a change of character (ChoCh)
-this might be a sign that the next path will be in an uptrend
With influx of Demand Vol & Combination of 3rd Wyckoff Law, i am long for Tesla
Absolute Pure Wyckoff

Tesla shows an upward bias, supported by two key indicators.Tesla is well supported by the ascending trendline and has closed at the 38.2% Fibonacci level. This current price presents an opportunity to add some shares to your portfolio. Alternatively, you may consider waiting for the price to drop around $160, given the signs of weakness in the Nasdaq.

50/50 chance on TeslaTesla (TSLA) is in a four-year symmetrical triangle pattern, with an equal 50/50 chance of breaking out in either direction.
If it breaks out to the upside, a strong bullish trend is possible.
Conversely, if it breaks out to the downside, a bearish trend could occur.
The indicators have turned bullish. Let's see which direction it takes.

TSLA's bulls trapThe last bullish move was quite strong, with the price moving above a large consolidation zone from March to April. Now, we have something that looks like a bull flag—the price is crawling slowly down, finding some support near the consolidation POC. This is a very tempting opportunity to enter a LONG position with a potential upside of 15% or more. However, it is likely to fail. Here is why:
1. The price is in a monthly/weekly downtrend. For the monthly downtrend to reverse, we need a trend change at the weekly level. So far, the bulls have NOT even managed to set a higher low on the weekly chart.
2. TSLA is much weaker than the market. While the S&P has been rallying for the last two weeks, TSLA has been declining.
3. TSLA's last earnings report was bad. Although the price rallied for a short period, it doesn't mean that the sentiment has significantly changed.
To sum it up, the context is very bearish. I wouldn't seriously consider any LONG positions at this stage.
Disclaimer
I don't give trading or investing advice, just sharing my thoughts.


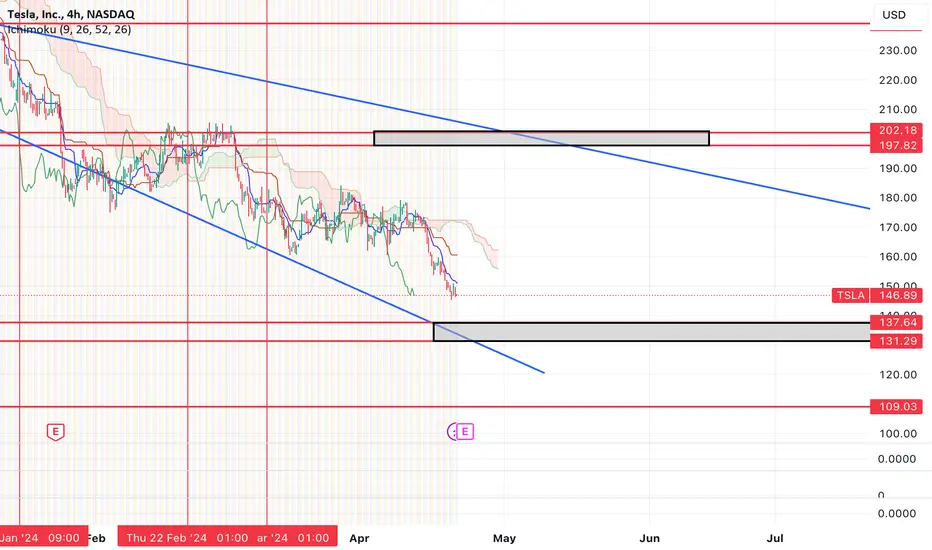
$TSLA bottoming soon around $131-137 and then push to $200?NASDAQ:TSLA looks to be close to making a short term bottom.
Thinking we could see price find support in the $131-137 range and then with earnings see a push to $200 or so.
NASDAQ:TSLA has been the leader to the downside and it looks to be nearing exhaustion. Would make sense for the leader to the downside to end up being the leader to the upside should the reaction to earnings be positive.
Let's see. This week should be telling on the directional move for equities.
TSLA Up Trend started ?This up move is different, It started with GREEN UMVD and now Green TrapZone is also showing up. Current bars are Gray so we must wait for GREEN Bars to enter when up momentum resumes. If we break both angles going UP , down trend may resume so keep you Technical Tools handy :)

TSLA: Buy ideaOn TSLA as you see on the chart we would have a hight probability to have an uptrend if only if we have the breakout with force the vwap and the resistance line by a big green candle follow by a large green volume.Thanks!

Reminder: Patience in trading: The key to success.It must be remembered once again that Patience is one of the key factors for success in trading. You can have all the techniques in the world but if you are not patient you are never going to be profitable. It is important to wait for the right time to enter a position and exit your position at the right time in order to optimize your gains and minimize your losses. This is how you will make good profits. Additionally, one should not trade at any time. Patience is a golden path. And nothing is impossible for him who believes. Love and peace....

TSLA: Short-term Probability Analysis | 57.35% Reversal!Short-term analysis of NASDAQ:TSLA indicates that the price is most likely to head to trade above +$200 in the coming days/weeks.
Breaking down the reason behind the current setup and why we should be expecting new mid-term highs:
Feel free to share your thoughts or any feedback you have on the analysis.
Also, if you're interested in analyzing the probabilities directly on your charts make sure to check out the Free Public Indicator that I've published recently!

TESLAMy opinion tesla in some corection here which might be wave 4 on htf. i would be looking for the previous lows liquidity. otherwise we could hold thies level we are at right now and break the trendline to go upside

Tesla Share Accumulation Strategy: RSI and Price Divergence InsiIt is clear from the figure that the RSI downtrend has ended and has been tested. Additionally, it appears that the price downtrend has also come to an end. Another supporting factor is the divergence between the price and the RSI. Therefore, it seems that this is an opportune time to accumulate Tesla shares. The first and second target prices are indicated in the figure as TP1 and TP2, respectively.

short idea on weekly and daily analysisTesla making lower highs and lower lows on weekly and daily, sellers have come in and i expect the price to fall sharply to the target within a week, i would recommend to open 2 seperate positions, once price moves 50% move stops 50% to reduce risk and possibly close 1 position depending on how daily candles close, once 1 position has closed then move stoploss to breakeven for a risk free trade

Tesla Bottoming out Tesla is finding support between the price levels of $150 and $170.
Wick rejections on the monthly time frame indicate that the price is bouncing off this demand zone, suggesting an upward movement towards $200.
With the Cybertruck becoming increasingly popular, there is potential for Tesla's price to test the $300 level and beyond.

$TSLA #Tesla Parallel Uptrend Begins NASDAQ:TSLA Parallel Uptrend Begins, Algorithm Buy Alert large green dot we start to accumulate, large red dot we do not accumulate we wait.
