XU100 trade ideas
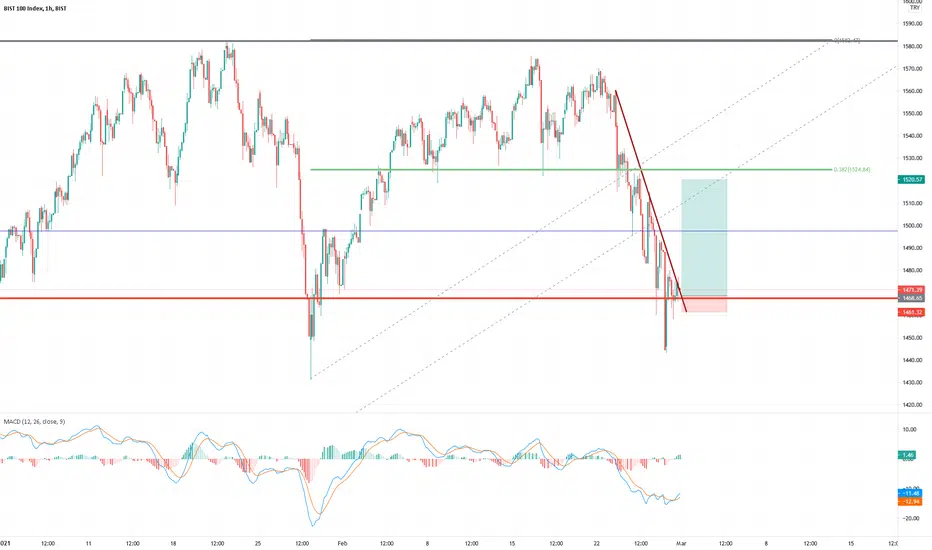

Double top formation strongly hinting a bearish BIST 100Apart from the double top formation; my observations supporting a bearish BIST 100 are:
Already broke the 21 and 50 day SMAs.
Broke the upward trend for RSI.
Targets:
1380-1420: 100 day SMA and %78.6 Fibonacci level.
1280-1300: 61.8% Fibonacci level and support from the upward trend starting March 2020. This will also likely be around the 200 day SMA, too.
1190-1210: 50% Fibonacci level and filling the gap from November 2020.


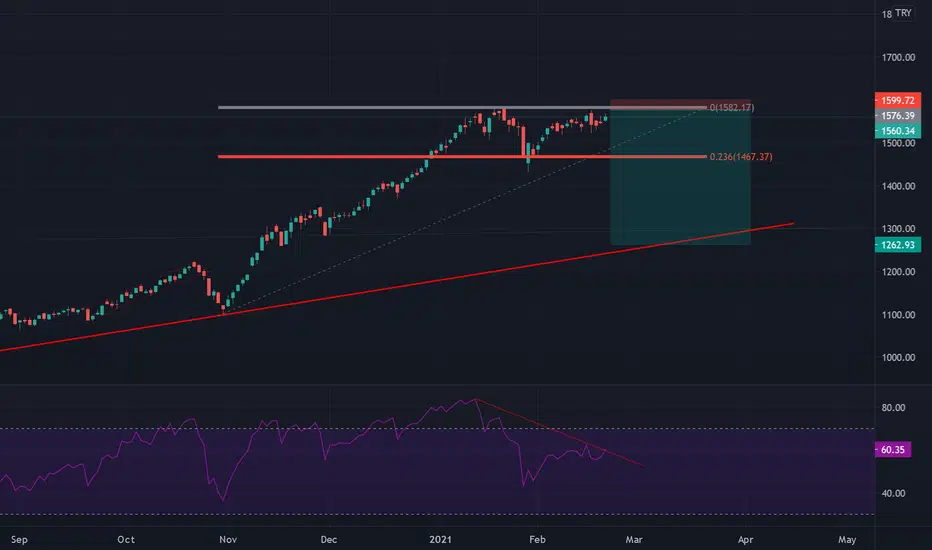


XU100 may corrected by 10 percent // BIST100 geri çekilebilir XU100 has two pick formations and it may fall by 10 percent.
It is not an investment suggestion. Please be carefully with your decision.
BIST100 çift tepe formasyonu yaptı ve desteğe kadar geri çekilebilir.
Yatırım tavsiyesi değildir. Lütfen kararlarınızı kendi değerlendirmelerinize göre dikkatlice alın.

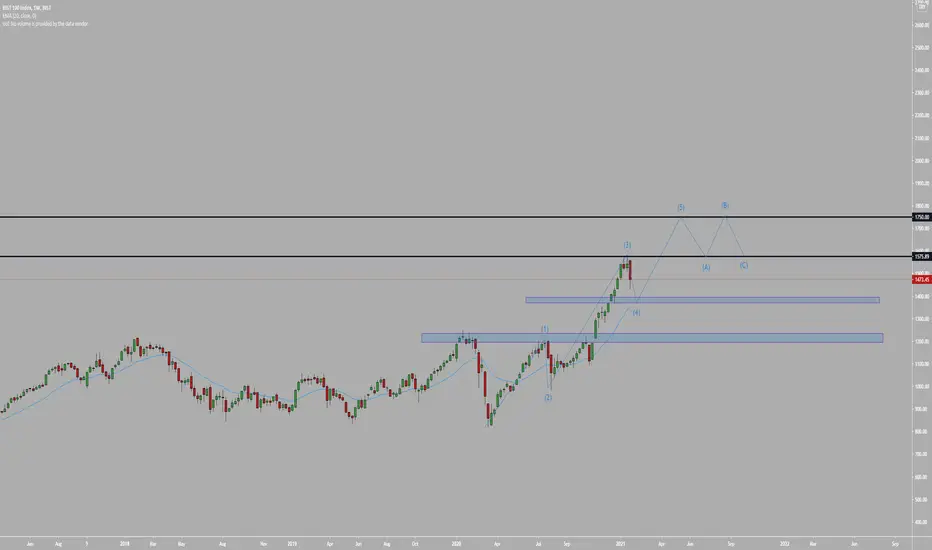
BIST100 MONTHLY TREND ANALYSISBIST100 have a bullish trend for years and will be bullish for the following years as long as DAX30 stays long.

İyimser bakınca böyle, an optimistic point of view İyimser bakınca böyle, an optimistic point of view
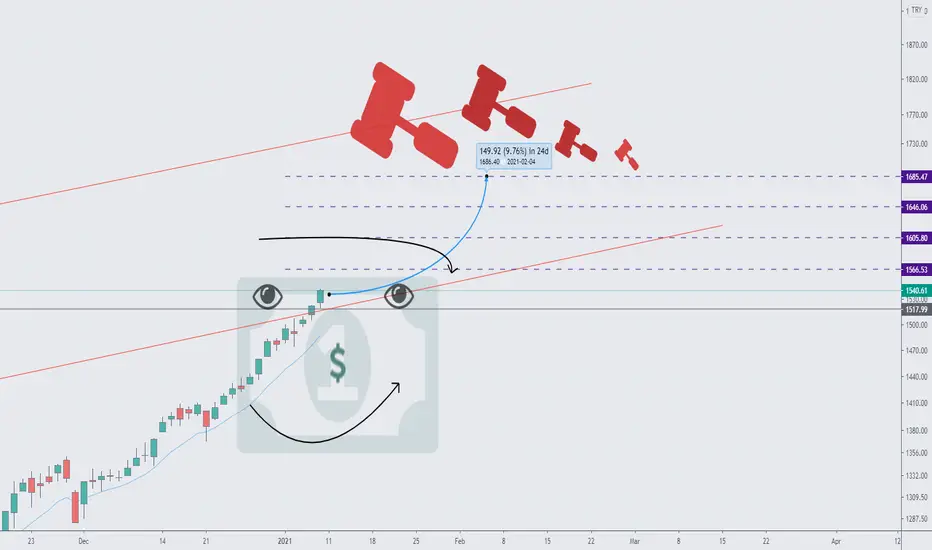
XU100 at weekly resistanceWe are at the resistance of channel. There is a bearish engulfing pattern. I'm thinking of waiting until the lower support at around 140 usd.

BIST100 AYLIK KANAL BIST100 2007den gelen kanalın üst bandında. Dikkatli olunması gereken seviyeler.


BIST 100 BEKLENEN DUZELTME GELIR MI?KESINLIKLE YATIRIM TAVSIYESI DEGILDIR.
BIST-100 UN KASIM 2020 DEN BERI DEVAM EDEN YUKSELISINI TEMEL SEVIYE RSI VE FIBO ILE INCELEDIK


XU/100 BIST100 TURKISH STOCK MARKETIf it breaks the resistance line which comes from 2013, then it may goes to 275 (2000 in TRY). If not, it would return to 200 (1470 in TRY) at least.
I wish you good profit!
Follow me!
Thanks
Important Notice
- The index, stock, commodity, etc. I share here should not mean that I personally take a position.
- It is important that my shares are not interpreted as buy-hold-sell advice in any way.
-Please process according to your own risk appetite
-You can send me a direct message for your financial, technical or training requests.
- Liking the shares and following the account is an important indicator for the continuation of the shares.
- All the works I have shared; all the information, drawings, graphics and comments, the notes I have taken for myself and / or my experiments on technical analysis , my training notes.
Legal Notice
Investment information, comments and recommendations contained herein are not within the scope of investment consultancy. Investment consultancy service: It is offered within the framework of an investment consultancy agreement to be signed between brokerage houses, portfolio management companies, banks that do not accept deposits and the customer. The comments and recommendations contained herein are based on the personal opinions of those who make comments and recommendations. These views may not be suitable for your financial situation and risk and return preferences. Therefore, making an investment decision based solely on the information contained herein may not produce results in line with your expectations. Nevertheless, I cannot be held responsible for any direct and / or indirect damages, loss of profit, moral damages and damages that may be incurred by third parties, which may be incurred by investors as a result of the use of the information on the site and the resources used for the site


XU100 BEARISH DEEP CRABHi all,
That is not investment advice,
channel and 1 month bearish deep crab pattern
Trader with care.
Harmonic trader.
