$CSX - above $90.65 - looking for entryThis has been consolidating a long time, if it can get above the volume shelf and hold above $90.65, it would be worth an entry.
CSX trade ideas

CSX Bull FlagLarge bullish volume, bull flag is curving upwards and technical indicators suggest a buy. Tradingview is rating CSX as a "buy"


AOS Bullish Bias!Due to strong building permits and housing starts data AOS could see more upside in price move. Looking for an entry above $93.00 level.


Cup and Handle Ascending TriangleLarge effective volume yesterday/meaning large players were buying this and there was also a pocket pivot
I have noticed that large players are not always super careful with entry..lol. Afterall, it is not always their money that they are spending.
Effective Volume analyses the intraday volume on the minute level to determine what small and large players are doing in terms of accumulation and distribution. For using the indicator you should basically understand: if the red line goes up, large players are buying on average, if it goes down, they are selling.
The idea here is that you only want to buy the stock when it actually starts to rise and when it arrives above the breakout level. It is very well possible that the stock never reaches this level. It is also possible that the stock only reaches this level next week. Both cases make sure you only enter the stock when the actual breakout happens. If it doesn't happen you have prevented a loss by never entering the stock. If you are a pull back trader or a bottom fisher, then these patterns may not be ideal for you. I love to bottom fish as well (o:
C&H patterns are only valid at long entry level.
There is also an ascending triangle and a rising wedge. CSX took a small dip down through lower trendline of RW. Rising wedges can be bearish.
Possible T2 116.75 to 125
Ascending triangles do fail, or bust like all other patterns do. The top trendline is R so it may not be easy to get through it
But if it does, it can become support (S)
To break an A triangle it must do so with confirmation and in an uptrend
Maybe just keep that in mind with this onecause the Ascending triangle is right there close to entry level.
It’s not about being right, but doing the right things when you are. Success isn’t in picking the stock but in how it is played once you own it. When to buy more and when to sell is far more important than knowing what to buy. One good trade can be a life changer.
Not a recommendation


$CSX - small bounce for $2 - $4NASDAQ:CSX - bounce off mid line of bullish parallel channel, seasonal play, good risk reward

CSX Getting ready to breakout$CSX
CSX Corporation
Keep a watch at 79.78 levels - About to break it.
Monthly Candle is turning positive as well.
More upside evident close to 111 in next few months.
#Diversify #SwingTrade
#DJT $DJT #trading #investing

CSX Long Play for Week of 7.12CSX looking bullish on the 4hr chart with the MACD crossover and the RSI looking up; along with ending the day on bullish volume.
Would like to enter the trade when we close hourly above 70 on bullish volume.
Target 1: 71.10
Target 2: 73.25
Target 3: 74.50
Stop: 67.50
Best of Luck,
--d0x

It's going down for real!We expect after after a good amount of sells , a very clean pull back. our rate is 60% the more we get closer to red support, the higher are rates.

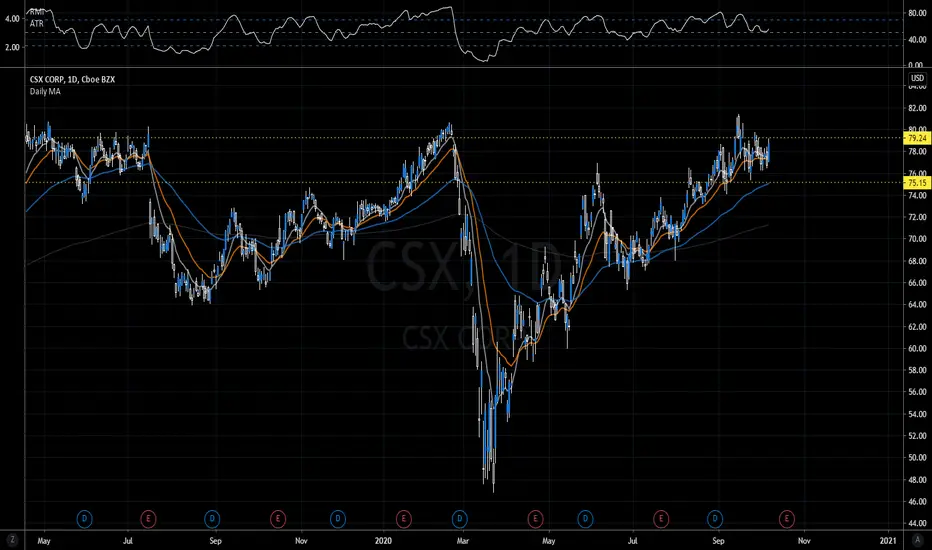
BUY CSX CORP DailyHey traders, **DISCLAIMER** content on this analysis is subject to change at any time without notice, and is provided for the sole purpose of assisting traders to make independent investment decisions. CSX CORP is in a very important moment, upward trend possible that after his pull back it starts falling again.
Please LIKE & FOLLOW, thank you!


CSX It better not Disappoint. Earnings tomorrow and any negative news could result in quite a ugly drop.
Currently trading within tightening rising wedge, which is not a BULLISH PATTERN.

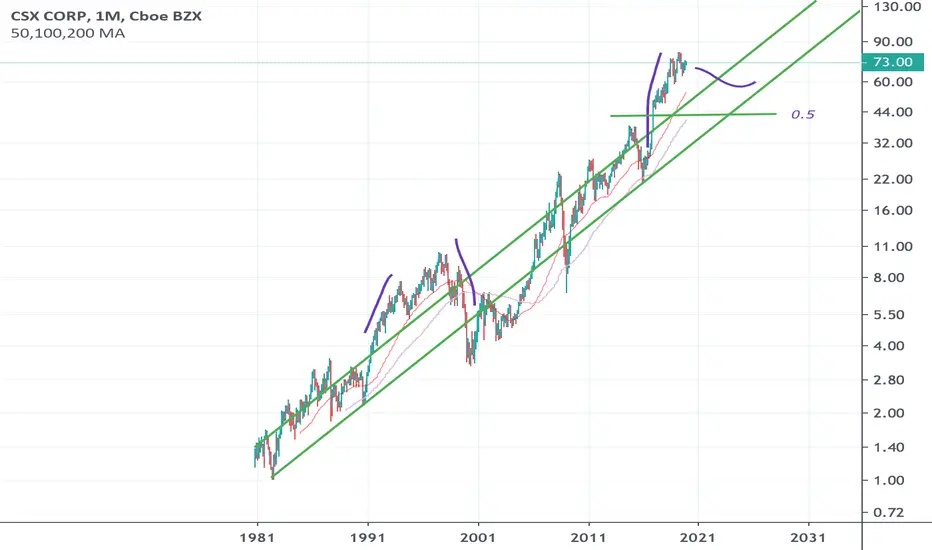
CSX Bump and Run!Currently in the bump section of the bump and run, expect a run back down to the trend. Included 0.5 fib level as possible support.
$CSX Monthly lChimoku AnalysisPotential buy opportunity.
Price dropped & hit the 9 day moving average & reversed.
Flat 26 moving day average & lagging span indicating a breakout.
Large gap between 26 MA & 9 MA indicating MA disequilibrium
Thick lChimoku cloud indicating high buying volume.
lChimoku cloud momentum indicating an uptrend.
Price above lChimoku cloud.

CSX Bottoming FormationCSX is in a bottoming formation with higher lows but consistent highs within the bottoming action. The candlesticks are now in a common compression mode with moderate volume supporting upside action.


$CSX Corp set to fill the gap Above Entry level $74.50 = Target price $80 = Stop loss $72.75
Indicators bullish and in upward trajectory.
Gap fill potential which could result in targeting highs for the year.
P/E ratio 17.54, very reasonable.
Company profile
CSX Corp. engages in the provision of rail-based freight transportation services. Its services include rail service, the transport of intermodal containers and trailers, rail-to-truck transfers and bulk commodity operations. The company was founded in 1827 and is headquartered in Jacksonville, FL.
