$SEDG RallyWith the Russia-Ukraine conflict and oil prices skyrocketing, solar stocks have been rising as well. We saw a perfect bounce at 200 and could see a really all the way up to 379. Depending on the news, may be able to push to ATH.
SEDG/N trade ideas

Time to go upI like the overall running flat correction and i think its time to go up. I am going to watch the Wave 1 and 2 formation before going long in a week or so.

SEDG PredictionsI'm using this as a guide to play earnings. I think earnings are priced in after the move seen in conjunction with with ENPH. Its possible the surprise is enough to move the entire channel up with a bottom around current levels but I think we're more likely to see some guidance around margins being squeezed so we will probably have to wait a few quarters to retest the top of the channel again.

Groundhog Day 2/2/22Today on Groundhog Day 2/2/22 Punxsutawney Phil predicted 6 more weeks of Winter weather instead of early Spring weather. So, what does that have to do with the stock market? Absolutely nothing. But it is a good segue into a possible renewable energy rotation from fossil fuel energy by March. Winter officially started on December 21st and it ends on March 20th. This is a seasonal trend If you want to plan some longer-term trades ahead of time. Here's 4 renewable energy tickers & 4 fossil fuel energy tickers comparison chart. As you can see there's a clear divergence once Winter officially began on the Calendar. And by Spring going into the Summer, they will converge. Yes, I know very well about the current macroeconomic factors such as gas price inflation worries, but the FOMC interest rate hike in March has begun to quell that.
fossil fuel energy:
XOM
MRO
EOG
CVX
renewable energy:
SEDG
ENPH
NEE
FSLR
Do your own due diligence, your risk is 100% your responsibility. This is for educational and entertainment purposes only. You win some or you learn some. Consider being charitable with some of your profit to help humankind. Good luck and happy trading friends...
*3x lucky 7s of trading*
7pt Trading compass:
Price action, entry/exit
Volume average/direction
Trend, patterns, momentum
Newsworthy current events
Revenue
Earnings
Balance sheet
7 Common mistakes:
+5% portfolio trades, capital risk management
Beware of analyst's motives
Emotions & Opinions
FOMO : bad timing, the market is ruthless, be shrewd
Lack of planning & discipline
Forgetting restraint
Obdurate repetitive errors, no adaptation
7 Important tools:
Trading View app!, Brokerage UI
Accurate indicators & settings
Wide screen monitor/s
Trading log (pencil & graph paper)
Big, organized desk
Reading books, playing chess
Sorted watch-list
Checkout my indicators:
Fibonacci VIP - volume
Fibonacci MA7 - price
pi RSI - trend momentum
TTC - trend channel
AlertiT - notification
tickerTracker - MFI Oscillator
www.tradingview.com


SEDG looking good for Bullswe are at a down part of a channel that is being consolidating for the last 7 months,
the lowest point of the year on this stock (200usd) was the initiation of this channel (around may 12) when it was in the middle of the golden zone (around 0.618 fibb)
we had visited the down part of the channel in july, october and couple of days ago. Every time we had made those visits, the EMA 200 had been broken but for short terms to rebounce and visit higher highs...
MACD indicator showing a perfect point for a long and RSI was completly oversold it on december 20, 2021...
Personally, this is one of my favorites stocks, the idea of clean energies around the world is something beyond trends and the awareness of the ppl about this topic is growing over time so i hold it for long term, for months...
whats your favorite stock beyond the speculative ones? what are the industries you would like to support more if you could choose? do you know any particular one that you would recommend about clean energies?
lets share!


SEDG wants to breakout🚀we saw a huge 100 dollar move to the upside after the downtrend break + retest!
now approaching previous resistance, look for a few weeks of consolidation up here before the next leg higher. price targets are 389.84/435.56

$SEDG: Time To Get $TAN?SEDG made a major break through the key 370 level we were watching on my Stocktwits page. TAN (Solar ETF) broke above 100 today as well and looks very strong against alternative energy plays. In fact if you look at $XLE vs $TAN you'll see that energy potentially has a long way to fall vs solar companies who are leading the pack today. Could be good to hold longer term until retail trends begin to develop in a more broad based way. Good luck!

Went short on this todayTook a short, its risky given the infra bill bullishness but the chart wasn't supporting a bull count. I guess we will see that in few days :)
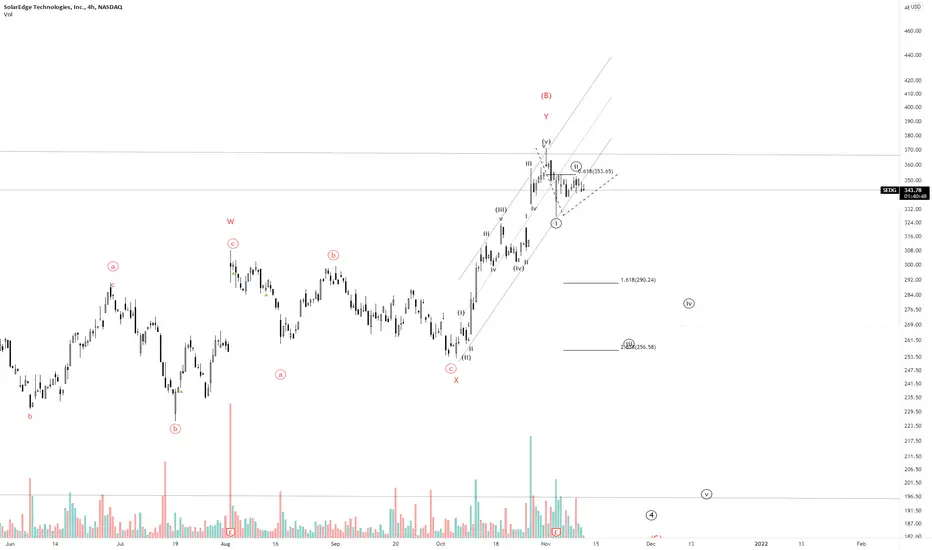
Change in direction/countI have been posting about SEDG since it was $260 and this week i closed all my positions at $370. Though my previous charts shows a much higher target for this stock but i think i was missing that the last wave which got us to the current price doesn't really fit well into an impulsive structure. Hence, recounting it is making me believe that this was just one rebound of the overall correction and we have one more leg down coming to make it a 3-3-5 ( FLAT correction ). Short term i will be bearish on this stock with the Target back to $220 with the SL of $375. I think that's a great RR on this trade.

Bringing this back up againI have posted about this in the past many times and i think its time for this to make a significant move up. Earnings next week for this ticker but based on how ENPH has done today, expect this to do as well.
Its trading in a range of high resistance and a break above $325 will lead to #350, $375 in short term.
Getting ready for an ATH

SEDGLet's see how this plays out. SEDG could do a third and final zigzag before moving to the upside, or this could be wave 1. Lets see how this plays out. TAN looks poised for a break to the upside.


Update | Inverse H&S- BullishVery bullish on SEDG here along with many others in the sector- while certainly a longer-term play, will be watching for a breakout. ICLN & TAN look ready for a breakout as well (attached below along with previous chart)- some bigger support and resistance levels to watch along with some RSI based supply and demand zones to keep an eye on- Bullish all the way and looking for a breakout here
- Inverse Head and Shoulders formed (Orange Neckline)
- Ascending triangle forming on its yearly chart
- Sitting right on its 100-day EMA with the rest starting to curl upwards
- Bollinger bands are starting to squeeze (not pictured)
- Slight hidden bullish divergence on the RSI accompanied with buyers volume starting to pick up relative to seller volume
PT1- $279.50
PT2- $287.52
PT3- $294.32 + Breakout
ICLN
TAN
Previous Charts


SEDGEntered position at -2 sigma. Bullish on the sector as a whole, TAN appears to have broken through a cradle.

Slide into earnings post infrastructureInfrastructure bill is set to pass or fail on Thursday 9/30. This is a technical analysis into earnings post infrastructure. Current nice trend line - and a pennant forming. We are almost at the end of the pennant and based on previous behavior I have charted what candle patterns could develop post infrastructure and into/out of earnings. The company is fundamentally sound with a good balance sheet, no reason to see this pull back unless it is with sympathy of Fear Uncertainty and Doubt of the current market conditions (debt ceiling and inflation sentiment).


Symmetrical Triangle - (Update)See Previous Charts-
- Buyer volume picking back up, has had nice relative strength compared to others in the sector
- MACD cross
Looks like SEDG has finally bottomed after quite a long, and in my opinion a much-needed pullback. SEDG recently was upgraded by Goldman Sachs, will be looking for long entries as there appears to be a Cup and Handle forming as well, bullish
PT1- 260.77$
PT2- $270+
(Boxes are RSI based Supply/Demand zones)
After consolidating in a long regression trend for quite some time, SEDG is holding within a triangle while forming an inverse head and shoulders, (orange- neckline). SEDG has earnings on 8/3' along with ENPH. Looking for a run-up to ER. Both previous price targets hit, undoubtedly a long-term play should provide multiple good entries. Bullish


Bullish- LongLooks like SEDG has finally bottomed after quite a long, and in my opinion a much-needed pullback. SEDG recently was upgraded by Goldman Sachs, will be looking for long entries as there appears to be a Cup and Handle forming as well, bullish.
PT1- 260.77$
PT2- $270+
(Boxes are RSI based Supply/Demand zones)
