SEDG/N trade ideas


♻️ SEDG ✅Trade in the canalSolarEdge Technologies
Symbol NASDAQ:SEDG
Market Cap 11.70B
Short Float 3.18%
Target Price 330.50
P/E 78.03
Trading idea
Swing trade with 3 points of profit collection.
#1 - Target Price = 260$
#2 - Target Price = 290$
#3 - Target Price = 330$
Simple trade, long inside the channel.
As we see it has reached its support zone.
Change of direction points.
This is not a recommendation to buy or sell, just a trading idea.
Not an investment advisor.
Have Fun.

SEDG // Fibonacci studywedge indicator resistance on weekly timeframe
The targets were determined according to Fibonacci.

SEDG in a retest stage => Does it continue its bearish move ?NASDAQ:SEDG
According to the daily analysis, SolarEdge has broken the bearish triangle and now it's retesting the major support of 208 after a rejection.
A bearish move could continue and would try to achieve the next support of 180. We shoud have a confirmation before shorting it..
Stay tuned and enjoy!
We keep it touch..

$SEDG with a Bearish outlook following its earnings #Stocks The PEAD projected a Bearish outlook for $SEDG after a Negative Under reaction following its earnings release placing the stock in drift D.

Head and ShouldersPrice is below the neckline which is also the .382 of the trend up.
Ugly looking red candle today. Price retested the neckline this week but so far has not been able to make a sustained move back above it.
Possible stop above neckline.
No recommendation.
Price is below the bands which indicates serious selling pressure and possible oversold status.
Short interest is approximately 3.39%/Earnings 11-2.
EPS (FWD)
5.55
PE (FWD)
46.25
Div Rate (TTM)
-0
Short Interest
3.39%
Market Cap
$13.89B
SolarEdge Technologies, Inc., together with its subsidiaries, designs, develops, and sells direct current (DC) optimized inverter systems for solar photovoltaic (PV) installations worldwide. It operates through five segments: Solar, Energy Storage, e-Mobility, Critical Power, and Automation Machines. The company offers inverters, power optimizers, communication devices, and smart energy management solutions used in residential, commercial, and small utility-scale solar installations; and a cloud-based monitoring platform that collects and processes information from the power optimizers and inverters, as well as monitors and manages the solar PV system. It also provides residential, commercial, and large scale PV, energy storage and backup, electric vehicle charging, and home energy management solutions, as well as grid services; and e-Mobility, automation machines, lithium-ion cells and battery packs, and uninterrupted power supply solutions, as well as virtual power plants, which helps to manage the load on the grid and grid stability. In addition, the company offers pre-sales support, ongoing trainings, and technical support and after installation services. The company sells its products to the providers of solar PV systems; and solar installers and distributors, electrical equipment wholesalers, and PV module manufacturers, as well as engineering, procurement, and construction firms. SolarEdge Technologies, Inc. was founded in 2006 and is headquartered in Herzliya, Israel.

SEDG short ideaHey all,
I think we're watching SEDG and solar top out in real time. On smaller time frames, SEDG looks like a done stock. I think this thing falls very soon, fast.

SolarEdge Holds Support After Gapping DownSolar stocks have outperformed lately as investors react to high oil prices and the green-energy movement. Today we’re looking at SolarEdge Technologies , the No. 2 company in the group by market cap behind Enphase Energy .
The main pattern on the chart is the falling trendline that began in November and ran along the highs of April and most of July. SEDG ripped through that resistance on July 27 as lawmakers advanced key legislation supporting the sector.
Earnings subsequently missed on August 2. That caused the stock to gap lower, but it managed to remain above the previous trendline. Has old resistance become new support?
Second, the 50-day simple moving average (SMA) just rose above the 200-day SMA: a potentially bullish “golden cross” pattern.
Next, consider the sequentially higher lows since January – unlike the broader market’s steady decline through mid-June. Finally, notice how the relative strength index (RSI) has remained mostly above its midline at 50. Both of those patterns could reflect buyers outnumbering sellers.
TradeStation has, for decades, advanced the trading industry, providing access to stocks, options, futures and cryptocurrencies. See our Overview for more.
Important Information
TradeStation Securities, Inc., TradeStation Crypto, Inc., and TradeStation Technologies, Inc. are each wholly owned subsidiaries of TradeStation Group, Inc., all operating, and providing products and services, under the TradeStation brand and trademark. You Can Trade, Inc. is also a wholly owned subsidiary of TradeStation Group, Inc., operating under its own brand and trademarks. TradeStation Crypto, Inc. offers to self-directed investors and traders cryptocurrency brokerage services. It is neither licensed with the SEC or the CFTC nor is it a Member of NFA. When applying for, or purchasing, accounts, subscriptions, products, and services, it is important that you know which company you will be dealing with. Please click here for further important information explaining what this means.
This content is for informational and educational purposes only. This is not a recommendation regarding any investment or investment strategy. Any opinions expressed herein are those of the author and do not represent the views or opinions of TradeStation or any of its affiliates.
Investing involves risks. Past performance, whether actual or indicated by historical tests of strategies, is no guarantee of future performance or success. There is a possibility that you may sustain a loss equal to or greater than your entire investment regardless of which asset class you trade (equities, options, futures, or digital assets); therefore, you should not invest or risk money that you cannot afford to lose. Before trading any asset class, first read the relevant risk disclosure statements on the Important Documents page, found here: www.tradestation.com .

Symmetrical Triangle - Watching closelySEDG has been holding this symmetrical triangle for quite some time now, broader market conditions permitting, will certainly be looking for a breakout to the upside going into earnings and as a sympathy play for ENPH, which has earnings on 7/26'. SEDG has some nice bullish divergence on the RSI as buyer volume increases relative to seller volume. SEDG is flagging on the weekly timeframe (See attached chart below), Bollinger bands are also squeezing on the daily and weekly timeframes in addition to a bullish harmonic pattern forming on the daily timeframe. Bullish and will be looking for a breakout from this triangle (Broader Market Conditions Permitting). Just some support and resistance levels to watch along with some RSI-based supply and demand zones to keep an eye on in the meantime- Price Targets & Previous charts are attached below
--Weekly Timeframe--
--Previously Charted--
PT1- $277.62
PT2- $281.27
PT3- $286.34
PT4- $293.14 + Breakout

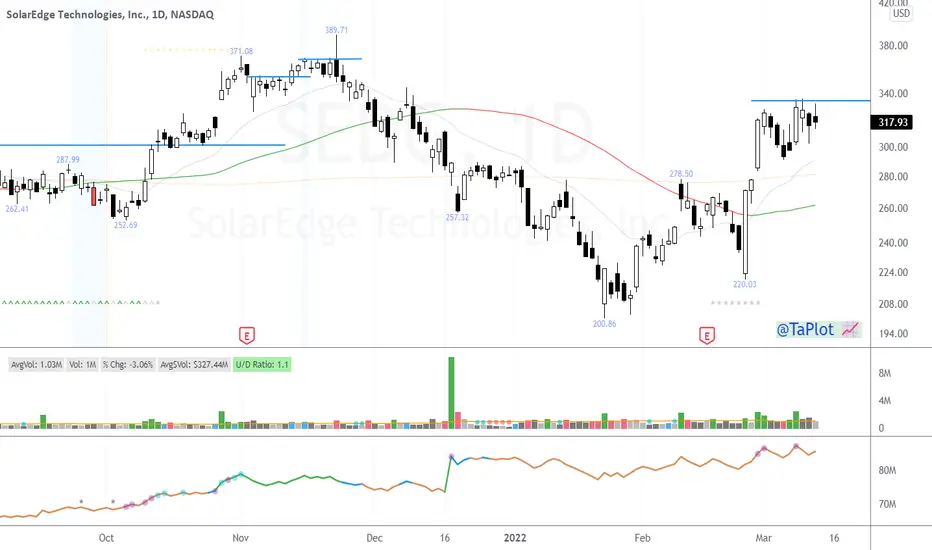
#SEDG $SEDG approaching cluster resistance ! 🥶onn the break of 313.61 we can target 341-388-433 .. break of 250.30 support/trendline support is my short trigger


Play Action No Huddle Offense - Bullish to 355Its going to repeat what I labled as round 1 on the chart (proportionally), explosive +80 point run from here. This is a beautiful and simple setup - run what works.
~ Coach Knute Rockne

Symmetrical Triangle Inverse Head & ShouldersInverse head and shoulders as well which must break the neckline with a trend to the upside to meet long entry level.
Earnings were yesterday. The news does not always equal the reaction so time will tell.
The triangle is neutral until a trendline is broken with a trend in the direction
No recommendation.
The market can be irrational and sometimes everything is interpreted positively and other times negatively.

$SEDG with a Bullish outlook following its earnings #Stocks The PEAD projected a Bullish outlook for $SEDG after a Positive Under reaction following its earnings release placing the stock in drift A with an expected accuracy of 75%.

Inside day trend line breakInside day break to long side held also downtrend line broken.
Nice easy low risk play
Not financial advice. Please use proper risk management


Short SEDG SolarEdge TechnologiesI'm shorting it to the range of $140-$150. Don't ask me why, but this is what I'm doing.

SEDG Cup and Handle FormationHey folks, happy weekends!
SEDG seems to be forming a cup and handle pattern and we are currently in the formation of the handle! This is a stock to keep on your watchlist! Have fun trading!

$SEDG Mini Coil Setup$SEDG mini coil setup at the top of its consolidation range. Looks like it wants to snap to the upside.
Leader in the solar space

SEDG Weekly Looking for continuation from SEDG this week after 9 straight green weeks and nearly 70% increase in stock price

Bullish reaction to recent secondary Target 390, stop loss 277
SEDG setting up for a bullish continuation once it clears 327-330
Stochastic RSI primed for liftoff
Not advice in the financial sense or whatever.

$SEDG a Potential Solar Leader$SEDG 7 weeks up straight from the bottom. Remember what O'Neil says about stocks that are up 5 + weeks in a row?
The pivot can really use few more quite days. Would love to get on this name but need a low risk point to do so.
Will be watching it. A potential solar leader.