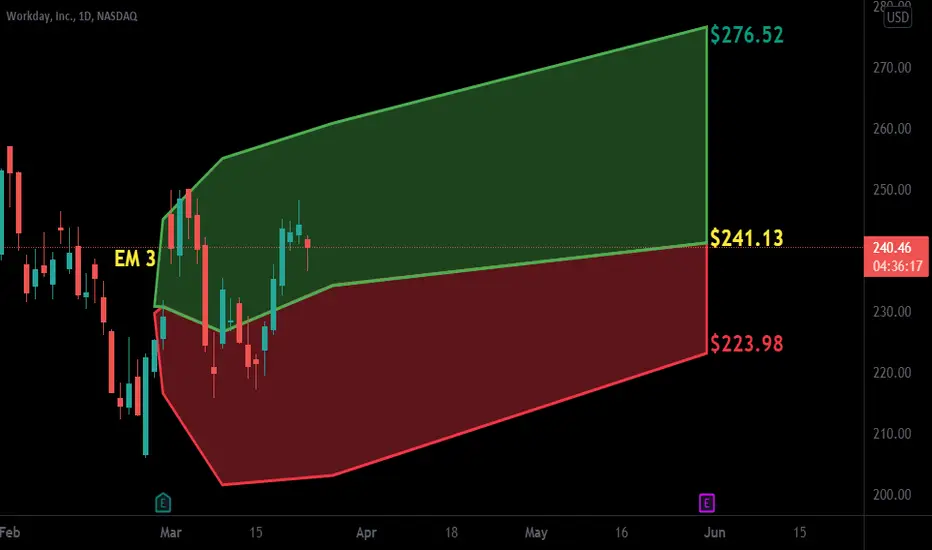
$WDAY with a Bullish outlook following its earnings #Stocks
The PEAD projected a Bullish outlook for $WDAY after a Positive over reaction following its earnings release placing the stock in drift B with an expected accuracy of 100%.
WDAY trade ideas
WDAYConfirmed a falling wedge reversal pattern and a bull flag continuation pattern. Expected a move to the upside.

WORKDAY Testing SupportWDAY is a new one on my radar and I'm glad I found this one. After further review of this company, a lot of things attract me about this stock while being in the current state of the market. WDAY has the highest P/E that I have ever come across (17,418) while trading. This company hasn't generated a positive net income in 5 years and is currently sitting on support. Frankly, I'm pessimistic about the outlook of this company. As money starts moving away from equities, the companies with the highest P/E's are typically hit the hardest. If WDAY breaks below the trendline, WDAY will most likely head to the 2.618 Fib retracement at $220.
Not financial advice

WorkDay USA Sun Storm Investment Trading Desk & NexGen Wealth Management Service Present's: SSITD & NexGen Portfolio of the Week Series
Focus: Worldwide
By Sun Storm Investment Research & NexGen Wealth Management Service
A Profit & Solutions Strategy & Research
Trading | Investment | Stocks | ETF | Mutual Funds | Crypto | Bonds | Options | Dividend | Futures |
USA | Canada | UK | Germany | France | Italy | Rest of Europe | Mexico | India
Disclaimer: Sun Storm Investment and NexGen are not registered financial advisors, so please do your own research before trading & investing anything. This is information is for only research purposes not for actual trading & investing decision.
#debadipb #profitsolutions

WDAY spike reversal intraday - yuckTested 300 and got smacked. small bear wedge implies more downside, perhaps to lower end of channel. looking for 270-280. be careful as we get closer to earnings. playing with dec 310 puts.


WDAY BullWDAY IMO looks bullish with this power earnings gap flag holding up and now wanting to go towards the next pivot at $283

WDAY huge earnings pumpWDAY we were watching in early august for that breakout and we ended up getting it and a huge win from it! Now, it appears that wave 3 is looking for the 261.8 extension in the upper 280s. We will be finding wave 3 top somewhere up here, but I do expect us to melt higher into next week (unless market weakness makes us find wave 3 top early). From there we can find a wave 4 PT and see the spot to go long for wave 5. Wave 5 PT is looking to be about 300 right now

Descending Triangle Earnings 8-26 AMCWDAY is above the neckline of a multiple bottom/inverse head and shoulders pattern.
The neckline is a source of support after price is above it. The upper trendline of the triangle is also support once price is above it.
Large Descending Triangle and price is over the upper trendline which can now be a source of support. Descending triangles can break to the upside, ascending triangles can break to the downside. A triangle is a consolidation pattern and price forms a vacuum as the trendlines converge. Price will break one way or the other eventually. Possible stop under neckline or where you see support.
No recommendation

What to look for $WDAYChart analysis
Workday had a big uptrend since the Covid-19 Crash. But as we saw in November 2020- May 2021 there was a head and shoulders formation and price traded pretty much sideways.
Buying side:
-find a lot of support in the red area (9x)
-huge candle with 2 times big wick underneath (bullish)
-above 20+50 SMA
Selling side:
-under 100+200 SMA
-intact downtrend since February
-breakout of a potential triangle formation (violet/white lines)
RSI: not clear
MACD: the daily not clear, weekly tendency to uptrend, monthly t. to downtrend
I next days will be important to watch. What I would be looking for as a buyer is that prices goes above the downtrend line (violet) to get this confirmation of an new uptrend.
The second thing is that we get above the SMA 100 (blue line) and this more than 3 days.
This would be in the range of <240$. It could be your first entry but your stop lost must be very tight to the SMAs. Target could be new ATH (+17%) in a matter of weeks. Profit exit could be the 249$ (Sep. ATH), too.
Second idea would be to invest over the resistance of 249$. It is a 3,5% difference to first idea but I would say a safer play because we would be beyond the September ATH and therefore have a more valuable buy signal. Target would be new ATH (+13,5%).
Alway expect small corrections the way up. They are most likely connected with support/resistance lines I draw.
Fundamentals:
Seeking Alpha article by Gary Alexander
„In my view, Workday's rally is nearing an end. The company has hit a fairly rich valuation at ~11x forward revenue, despite the fact that revenue growth is slowing to the mid-teens and margins are expected to deteriorate following a hiring spree. With a saturated market, I don't see much opportunity for Workday going forward.“
Source:
seekingalpha.com

Great setup$WDAY
Chart is getting tight. Lots of chop within this pattern $ a massive flush last week.
Like this chart alot. Will LOVE it when 241 clears with some bullish vol

Multiple bottomsAnd barely an inverse head and shoulders due to the closeness of the bottoms. The bulls take a stand at these bottoms and have not let it go below 217ish so far.
WDAY has not broken the neckline which represents resistance. It will be support if broken
Negative volume is high. Short interest is 4.52% and days to cover shorts is 5.6 (short ratio)
No recommendation. I bought this on the deep pull back when AMZN dropped the contract with WDAY . I figured it was not the end of the world and price hit support.
No recommendation.
WDAY fell from an ugly top.

WDAYWorkday, Inc.
Peak highlighted candles are bearish
blue arrow represents the move down
High lighted candles resting on the POC indicate strength
ADX and MACD line up twice to show the move
pt 260


WDAY 6 tests breakdownWDAY has now tested the 220 level over 6 times. With each test demand is diminishing, which will create a further sell-off to the 208 area, where it will find support


WDAY: Consolidation is broken upwards.The uptrend targets are around 277 and 300. If 226 is retested, the uptrend could have a much higher target.


WDAY back at the 100day MAAgain back at the 100 day MA, it has used this as support for a long time so there could be high probability plays off this. I'll be watching very closely to see what kind of reaction we are going to get. So far there is some bullish divergence forming on the lower timeframes so we'll see if that ends up panning out.

Wday Inverted Flirty 😜It's been consolidating nicely at .5 fib or 259. This consolidating breakout history of this stock is highlighted in the purple box. I drew a resistance trendline on the RSI and I'll be waiting for that break along with a move to 261 for conformation
Right now it's showing a Inverted H&S .
Entry at 261 + RSI trendline breakout
Stop loss at 259

WDAY double bottomWDAY has been double bottoming off this trendline for the past couple of months. Looking for it to do it again right here.

WDAY🌦I love stocks that follow my formula: impulse, correction, impulse. As evident by the chart this pattern is called a running flat. Running flats are characterized by two trend lines both heading up. The next step is to look for a similar pattern on XLK
