WYNN trade ideas

Just getting my 240 thoughts on WYNNSuch a far cry from the 220.50 high. but there is some divergence suggesting that some of the selling has been/is being exhausted. Could see some buyers stepping in around the 108 range.


WYNN - Watch closely!Weekly candle chart...
Supports are the supporting trend line and the 200 week moving average.
The resistance is the 50 day moving average (NOT SHOWN).
The convergence of the supports and resistance levels will force a reaction most likely in one direction or the other. I don't like entering here...I'd wait and see how it plays out. Ideally, we will see a break above the 50 day moving average on volume and the 200 week ROC become for positive. But if not, be careful.
You will also notice what appears to be a giant cup and handle formation, which, upon it's breakout (shown) behaved as such.


WYNN SHORT/REVERSAL OF TRENDWYNN looks to have peaked at a time China is slowing down.
WYNN is at an inflection point and pressure to the downside seems more likely. General Market direction will play a key role in WYNN's movement.
Is it a healthy consolidation on a long term uptrend. Or will exposure to China and reliance from the consumer put pressure on margins and rapidly decrease growth.
BUY MARCH 185 PUTS@ 25
SELL the March 195 CALLS @ 1.30


WYNN - bouncing off of weekly support. Divergence
Status: Watching.
Technicals:
Horizontal S&R: yes, weekly
Channel S&R: yes
MA S&R: no, in fact could act as resistence
Pearson's R >= 85: ok
Price @ MOB or Fib Ext >1.38<1.62: yes
AO divergence: very minor
Fundamentals:
Next Earnings date: 10/15/2014
IBD EPS Rating: 97
IBD SMR Rating: A
competitors: lvs + mgm


Wynn Resorts WYNN Rolled over after earnings - downside targetsWYNN had a decent rally after earnings to squeeze out the short sellers that were leaning on it due to lowered guidance over the past few months. Note how WYNN has lifted above key resistance from the past two earnings releases at 206.50 and 209.00 (green lines to the right of the EPS triangle) and yet once again has rolled over under the latest earnings release at 213. So, I may be jumping the gun here but given this setup and the weak revenues in Macau leading to potentially lower future earnings estimates, but the trade has reasonable risk/reward parameters. 190 target (down 19 pts) versus risk (up 4 pts) for a ratio that is nearly 5:1.
The Range Movement line is not strongly down, but still in a downtrend since it hasn't hit a 2-month high.
Tim
3:42PM EST 8/5/2014
Stop 215
Target <190
Last 208.77 bid
3:36PM EST 8/5/2014 Tuesday


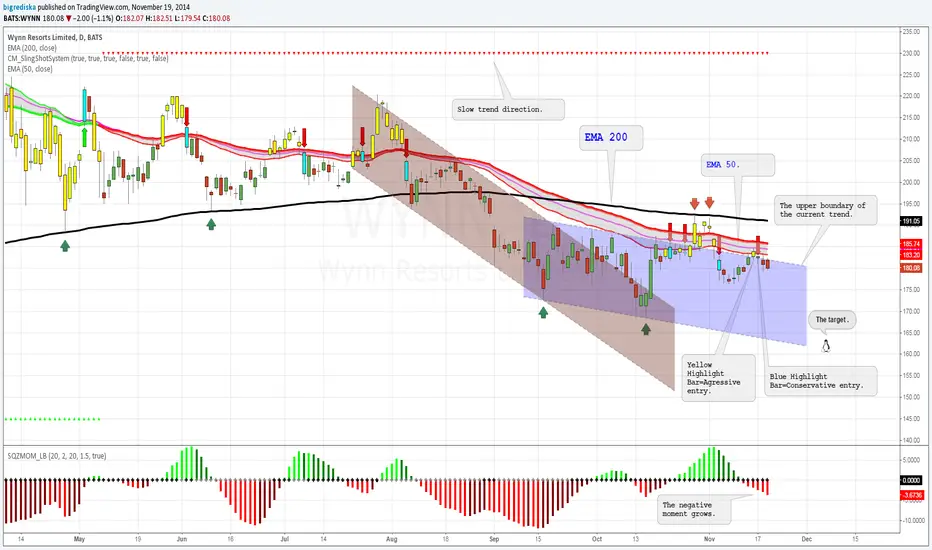
Wynn Resorts WYNN - Big triangle implies downside potential Big distribution pattern could be finishing here with a multi-month triangle formation.
Looking at the recent trading range that WYNN has been in and projecting that down gives a target under $170 and more aggressive targets are made by assuming the move off of the high will repeat itself from the apex of the triangle, which implies $145.
Either way, WYNN is an expensive stock at nearly 3.5 times sales, but it has been growing its revenues steadily at a high pace and with good profit margins. However, expectations are high and lately analysts have been lowering estimates a little. Any weakness to margins or revenue growth and this stock could come tumbling down in short order.
Risk is awaiting in the form of earnings due in 20 days. Keep that in mind when holding shorts. Perhaps we can cover most before earnings are due and leave some on the table for a possible big profit on a weaker than expected report.
Tim 201.53 last 11:10AM EST 7/15/2014

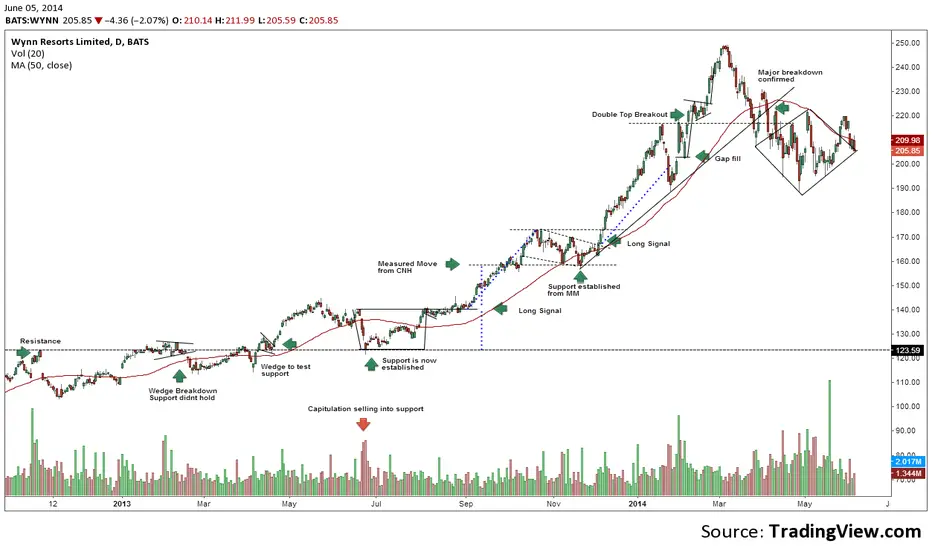
Wynn Resorts WYNN - Daily to 2008 - Bloated Valuation target 160Wynn Resorts - WYNN - Daily chart shows a large 12-fold+ return from the lows in 2009 to the blow off peak in 2014. Investors have oscillated between paying under 1.9x's sales for WYNN, highlighted in bright green, and 3.7x's sales, highlighted in brilliant red.
Note that margins are on a cyclical peak and optimism abounds for the future of WYNN since it has a premium valuation.
You could make a technical case, like the time in 2011 that it is tracing out a distribution pattern, often-times remarked as a "head & shoulders pattern". Perhaps under the surface there has been a lack of new buying and perhaps some "smart money" is unloading shares up here to take advantage of these PREMIUM prices.
The headlines are seemingly bullish, with strong growth in revenues, but they have come up short of high expectations. I think that is what investors should expect in WYNN going forward - more "digestion" and sideways to lower price action until you catch up to the lower green band traveling across the chart at the 160-100 level and rising at about 10-15% a year.
WYNN 208.73 last -9.29 -4.26% today after 9% sales growth in Macau.
Strategy, sell short above today's high in tomorrow's trading. Risk 225. Target 188 initially.
Tim 2:21PM EST June 3, 2014

